Taft Mosswood, CA (California) Houses and Residents
| Taft Mosswood: | $364,042 |
| California: | $715,900 |
Mean price in 2022:
Detached houses: $338,765
Here: $338,765 State: $988,808
Total population: 1,530 (Urban population: 1,282, Rural population: 0)
Houses: 379 (340 occupied: 189 owner occupied, 147 renter occupied)
| % of renters here: | 44% |
| State: | 44% |
Housing density: 694 houses/condos per square mile
Median price asked for vacant for-sale houses and condos in 2022 in this county: $775,303.
Median contract rent in 2022: $1,524 (lower quartile is $1,263, upper quartile is $1,800)
Median rent asked for vacant for-rent units in 2022: $2,053
Median gross rent in Taft Mosswood, CA in 2022: over $2,000
Housing units in Taft Mosswood with a mortgage: 145 (0 second mortgage, 0 home equity loan, 0 both second mortgage and home equity loan)
Houses without a mortgage: 0
Median household income for houses/condos with a mortgage: $76,353
Median household income for apartments without a mortgage: $52,021
Median monthly housing costs: $1,640
Compare current foreclosures near Taft Mosswood, CA:
| Photo | Address | Area | Beds / Baths | Price | Details |
|---|---|---|---|---|---|

|
#1
Quail Lakes Dr Apt 126
Stockton, CA 95207
|
612 sq. feet
|
1 baths 1 beds |
$179,000
|
show details |

|
#2
E Bianchi Rd Apt 2
Stockton, CA 95207
|
840 sq. feet
|
1 baths 2 beds |
$183,000
|
show details |

|
#3
Vineyard Dr
Lodi, CA 95240
|
1,225 sq. feet
|
2 baths 3 beds |
$370,000
|
show details |

|
#4
Almond Dr Apt 84
Lodi, CA 95240
|
1,064 sq. feet
|
1 baths 2 beds |
show details | |

|
#5
W Benjamin Holt Dr
Stockton, CA 95219
|
926 sq. feet
|
1 baths 2 beds |
show details | |

|
#6
E Taylor St
Stockton, CA 95205
|
960 sq. feet
|
2 baths 3 beds |
show details | |

|
#7
Keys Way
Tracy, CA 95377
|
4,098 sq. feet
|
4 baths 5 beds |
show details | |

|
#8
Mulberry Ct
Tracy, CA 95377
|
2,720 sq. feet
|
3 baths 5 beds |
show details | |

|
#9
Clipper Ln
Stockton, CA 95204
|
1,402 sq. feet
|
2 baths 3 beds |
show details | |

|
#10
Ashburn Dr
Stockton, CA 95209
|
1,835 sq. feet
|
2 baths 4 beds |
show details |
| Photo | Address | Area | Beds / Baths | Price | Details |
|---|---|---|---|---|---|

|
#11
Christina Ave
Stockton, CA 95204
|
- sq. feet
|
2 baths 3 beds |
show details | |

|
#12
Fargo St
Stockton, CA 95204
|
1,776 sq. feet
|
2 baths 4 beds |
show details | |

|
#13
Herndon Pl
Stockton, CA 95219
|
- sq. feet
|
1 baths 3 beds |
show details | |

|
#14
E Washington St
Stockton, CA 95215
|
1,064 sq. feet
|
2 baths 3 beds |
show details | |

|
#15
Prairie Dunes Dr
Lathrop, CA 95330
|
1,714 sq. feet
|
3 baths 3 beds |
show details | |

|
#16
Betty Mae Ct
Stockton, CA 95212
|
2,468 sq. feet
|
2 baths 4 beds |
show details | |

|
#17
Laguna Dr
Tracy, CA 95376
|
1,577 sq. feet
|
2 baths 3 beds |
show details | |

|
#18
Fern Dell Ln
Manteca, CA 95336
|
1,343 sq. feet
|
2 baths 4 beds |
show details | |

|
#19
W Harding Way
Stockton, CA 95204
|
2,029 sq. feet
|
2 baths 4 beds |
show details | |

|
#20
Green Plz
Lathrop, CA 95330
|
3,297 sq. feet
|
2 baths 4 beds |
show details |
| Photo | Address | Area | Beds / Baths | Price | Details |
|---|---|---|---|---|---|

|
#21
E Roosevelt St
Stockton, CA 95205
|
- sq. feet
|
1 baths 3 beds |
show details | |

|
#22
W Colony Rd
Ripon, CA 95366
|
2,881 sq. feet
|
3 baths 5 beds |
show details | |

|
#23
Plumas Dr.
Lathrop, CA 95330
|
1,829 sq. feet
|
2 baths 3 beds |
show details | |

|
#24
W Poplar St
Stockton, CA 95203
|
1,335 sq. feet
|
1 baths 2 beds |
show details | |

|
#25
Shorelake Ct
Stockton, CA 95219
|
2,668 sq. feet
|
3 baths 4 beds |
show details | |

|
#26
Brooks Ln
Ripon, CA 95366
|
3,262 sq. feet
|
3 baths 4 beds |
show details | |

|
#27
Clinton Dr
Stockton, CA 95210
|
1,503 sq. feet
|
2 baths 3 beds |
show details | |

|
#28
Treana Ct
Tracy, CA 95377
|
2,126 sq. feet
|
2 baths 4 beds |
show details | |

|
#29
Myran Ave
Stockton, CA 95205
|
1,025 sq. feet
|
1 baths 2 beds |
show details | |

|
#30
E Robinhood Dr
Stockton, CA 95207
|
960 sq. feet
|
1 baths 3 beds |
show details |
| Photo | Address | Area | Beds / Baths | Price | Details |
|---|---|---|---|---|---|

|
#31
Bristol Ave
Stockton, CA 95204
|
1,742 sq. feet
|
1 baths 3 beds |
show details | |

|
#32
Atlanta Cir
Stockton, CA 95219
|
- sq. feet
|
2 baths 3 beds |
show details | |

|
#33
Monterey Ct
Tracy, CA 95376
|
1,880 sq. feet
|
2 baths 3 beds |
show details | |

|
#34
N Country Club Blvd
Stockton, CA 95204
|
1,615 sq. feet
|
2 baths 3 beds |
show details | |

|
#35
Section Ave
Stockton, CA 95215
|
1,038 sq. feet
|
1 baths 3 beds |
show details | |

|
#36
Shirleen Dr
Stockton, CA 95209
|
2,837 sq. feet
|
3 baths 4 beds |
show details | |

|
#37
Boston Ave
Stockton, CA 95206
|
1,294 sq. feet
|
2 baths 4 beds |
show details | |

|
#38
Lannis Ct
Ripon, CA 95366
|
1,324 sq. feet
|
2 baths 4 beds |
show details | |

|
#39
Creek Trail Cir
Stockton, CA 95209
|
2,135 sq. feet
|
3 baths 5 beds |
show details | |

|
#40
Shippee Ln
Stockton, CA 95212
|
1,528 sq. feet
|
2 baths 3 beds |
show details |
| Photo | Address | Area | Beds / Baths | Price | Details |
|---|---|---|---|---|---|

|
#41
Erie Ct
Tracy, CA 95304
|
3,128 sq. feet
|
2 baths 3 beds |
show details | |

|
#42
Murietta Way
Manteca, CA 95337
|
1,900 sq. feet
|
2 baths 3 beds |
show details | |

|
#43
Dundee Way
Stockton, CA 95210
|
2,382 sq. feet
|
3 baths 5 beds |
show details | |

|
#44
Schooner Dr
Stockton, CA 95219
|
2,112 sq. feet
|
2 baths 4 beds |
show details | |

|
#45
Tejon St
Lodi, CA 95242
|
1,815 sq. feet
|
2 baths 4 beds |
show details | |

|
#46
Shiloh Pl
Stockton, CA 95219
|
1,062 sq. feet
|
1 baths 2 beds |
show details | |

|
#47
Aylesford Ln
Stockton, CA 95210
|
1,336 sq. feet
|
2 baths 4 beds |
show details | |

|
#48
La Contenta Ln
Manteca, CA 95337
|
1,766 sq. feet
|
2 baths 3 beds |
show details | |

|
#49
Hacienda Ave
Manteca, CA 95336
|
1,496 sq. feet
|
2 baths 4 beds |
show details | |

|
Check over 1 million property listings on Foreclosure.com!
|
browse all offers | |||


 | Nonwhite youth population growing in California and nation, report finds (30 replies) |

Median year apartment built: 2011
Household type by relationship:
Households: 1,004- Male householders: 190 (13 living alone), Female householders: 146 (14 living alone)
155 spouses (155 opposite-sex spouses), 19 unmarried partners, (19 opposite-sex unmarried partners), 305 children (292 natural, 0 adopted, 13 stepchildren), 58 grandchildren, 10 brothers or sisters, 15 parents, 0 foster children, 69 other relatives, 34 non-relatives
Size of family households: 172 2-persons, 20 3-persons, 16 4-persons, 63 5-persons, 8 7-or-more-persons.
Size of nonfamily households: 28 1-person, 20 2-persons.
106 married couples with children.
40 single-parent households (0 men, 40 women).
33.6% of residents of Taft Mosswood speak English at home.
49.4% of residents speak Spanish at home (45% speak English very well, 18% speak English well, 18% speak English not well, 19% don't speak English at all).
20.1% of residents speak Asian or Pacific Island language at home (34% speak English very well, 8% speak English well, 44% speak English not well, 14% don't speak English at all).
Foreign born population: 447 (44.5%)
(37.4% of them are naturalized citizens)
| Here: | 4.8 |
| State: | 6.0 |
| Here: | 5.7 |
| State: | 3.9 |

- Bedrooms in owner-occupied houses and condos in Taft Mosswood, California
- 0no bedroom
- 01 bedroom
- 692 bedrooms
- 763 bedrooms
- 334 bedrooms
- 115+ bedrooms

- Bedrooms in renter-occupied apartments in Taft Mosswood, California
- 0no bedroom
- 01 bedroom
- 132 bedrooms
- 693 bedrooms
- 654 bedrooms
- 05+ bedrooms

- Cars and other vehicles available in Taft Mosswood in owner-occupied houses/condos
- 14no vehicle
- 731 vehicle
- 442 vehicles
- 573 vehicles
- 14 vehicles
- 05+ vehicles

- Cars and other vehicles available in Taft Mosswood in renter-occupied apartments
- 0no vehicle
- 671 vehicle
- 552 vehicles
- 73 vehicles
- 184 vehicles
- 05+ vehicles

- Rooms in owner-occupied houses in Taft Mosswood, California
- 01 room
- 02 rooms
- 03 rooms
- 764 rooms
- 445 rooms
- 436 rooms
- 07 rooms
- 158 rooms
- 119+ rooms

- Rooms in renter-occupied apartments in Taft Mosswood, California
- 01 room
- 02 rooms
- 03 rooms
- 124 rooms
- 485 rooms
- 826 rooms
- 67 rooms
- 08 rooms
- 09+ rooms


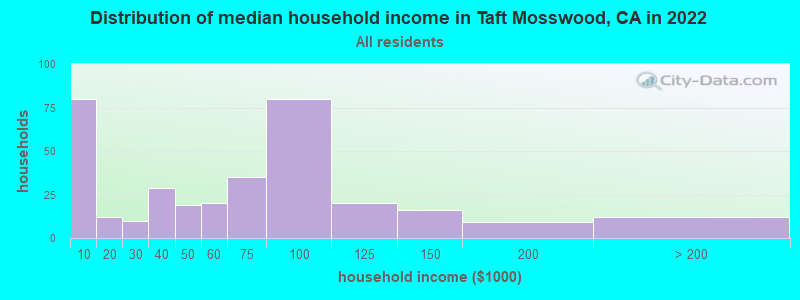
Taft Mosswood, CA household income distribution

- 80Less than $10,000
- 12$10,000 to $19,999
- 10$20,000 to $29,999
- 29$30,000 to $39,999
- 19$40,000 to $49,999
- 20$50,000 to $59,999
- 35$60,000 to $74,999
- 80$75,000 to $99,999
- 20$100,000 to $124,999
- 16$125,000 to $149,999
- 9$150,000 to $199,999
- 12$200,000 or more
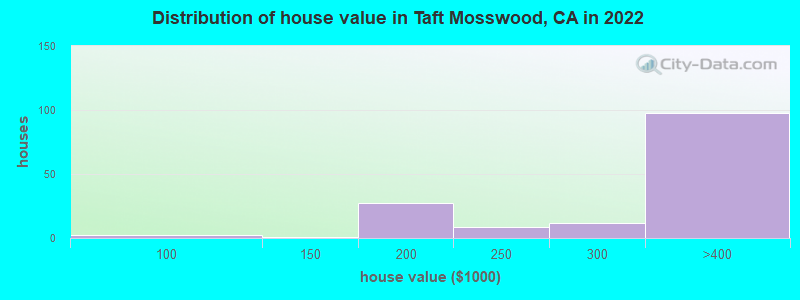
Home value of owner - occupied houses in 2022 in Taft Mosswood, CA
-
- 2$90,000 to $99,999
- 0$100,000 to $124,999
- 13$150,000 to $174,999
- 13$175,000 to $199,999
- 8$200,000 to $249,999
- 11$250,000 to $299,999
- 97$300,000 to $399,999
Rent paid by renters in 2022 in Taft Mosswood, CA
-
- 10$650 to $699
- 4$750 to $799
- 4$800 to $899
- 14$1,000 to $1,249
- 35$1,250 to $1,499
- 57$1,500 to $1,999
- 6$2,000 to $2,499
- 6No cash rent


Percentage of workers working in this county: 91.0%
Number of people working at home: 31 (7.1% of all workers)
Travel time to work (commute)
- Less than 5 minutes: 0
- 5 to 9 minutes: 48
- 10 to 14 minutes: 61
- 15 to 19 minutes: 64
- 20 to 24 minutes: 26
- 25 to 29 minutes: 47
- 30 to 34 minutes: 45
- 35 to 39 minutes: 0
- 40 to 44 minutes: 0
- 45 to 59 minutes: 43
- 60 to 89 minutes: 9
- 90 or more minutes: 59
Means of transportation to work:
- Drove a car alone: 200 (57.5%)
- Carpooled: 108 (31.0%)
- Bus or trolley bus: 11 (3.2%)
- Walked: 7 (2.0%)
- Other means: 5 (1.4%)
- Worked at home: 17 (4.9%)

- Unemployment by race in 2022
- Unemployment rate for other race residents
- 10.4%Males
- 40.4%Females
- Unemployment rate for Hispanic or Latino residents
- 3.9%Males
- 22.1%Females

- Year of entry for the foreign-born population in Taft Mosswood, California
- 922010 or later
- 972000 to 2009
- 851990 to 1999
- 961980 to 1989
- 1221970 to 1979
- 42Before 1970
Most common places of birth for foreign-born residents (%):
| Taft Mosswood: | 61.9% (258) |
| California: | 37.2% (3,881,193) |
| Taft Mosswood: | 13.9% (58) |
| California: | 0.5% (51,974) |
| Taft Mosswood: | 11.0% (46) |
| California: | 0.6% (65,335) |
| Taft Mosswood: | 8.6% (36) |
| California: | 4.9% (512,335) |
| Taft Mosswood: | 3.4% (14) |
| California: | 7.8% (818,297) |
Place of birth for U.S.-born residents:
- This state: 567
- Other state: 9
- Northeast: 0
- Midwest: 0
- South: 8
- West: 0
98.0% of Taft Mosswood residents lived in the same house 1 years ago.
Out of people who lived in different houses, 44.2% lived in this county.
Out of people who lived in different counties, 100.0% lived in California.
| Taft Mosswood: | 98.0% |
| State average: | 88.9% |
Education attainment for males 25 years and older:
- No schooling: 50
- Nursery to 4th grade: 4
- 5th and 6th grade: 0
- 7th and 8th grade: 12
- 9th grade: 0
- 10th grade: 4
- 11th grade: 0
- 12th grade, no diploma: 30
- High school graduate (or equivalency): 232
- Less than 1 year of college: 0
- Some college more than 1 year, no degree: 7
- Associate degree: 4
- Bachelor's degree: 12
- Master's degree: 0
- Professional school degree: 0
- Doctorate degree: 0

Education attainment for females 25 years and older:
- No schooling: 59
- Nursery to 4th grade: 0
- 5th and 6th grade: 23
- 7th and 8th grade: 63
- 9th grade: 3
- 10th grade: 3
- 11th grade: 0
- 12th grade, no diploma: 10
- High school graduate (or equivalency): 18
- Less than 1 year of college: 45
- Some college more than 1 year, no degree: 15
- Associate degree: 32
- Bachelor's degree: 23
- Master's degree: 1
- Professional school degree: 0
- Doctorate degree: 0


Housing units in structures:
- One, detached: 368
- One, attached: 4
- Mobile homes: 7
Housing units lacking complete kitchen facilities in 2022: 10.3%
House/condo owner moved in on average 9 years ago
Renter moved in on average 1 years ago

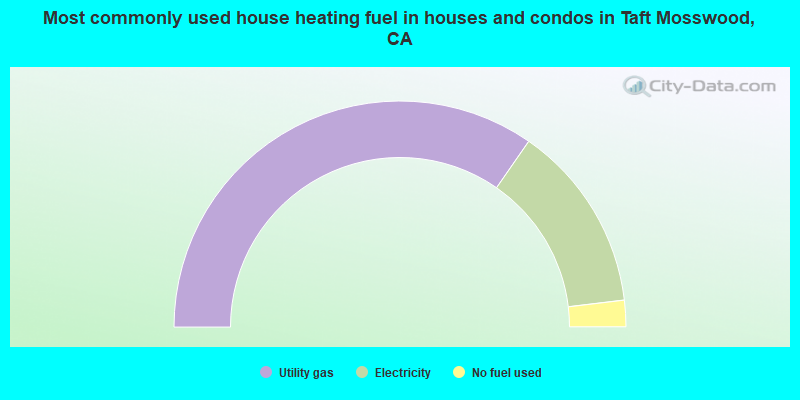
- 69.4%Utility gas
- 26.9%Electricity
- 3.8%No fuel used
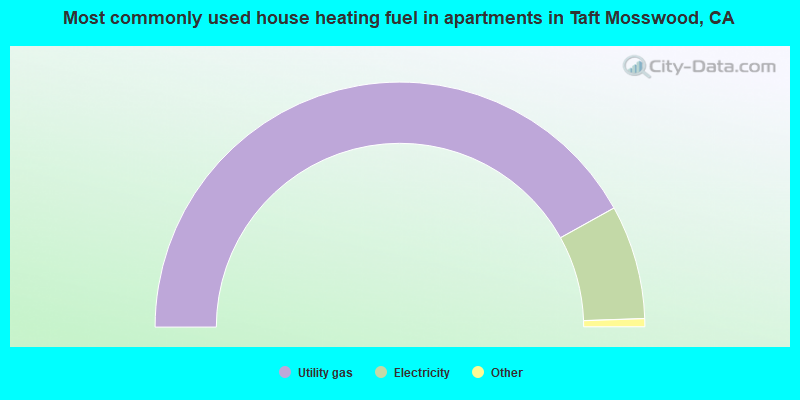
- 84.8%Utility gas
- 15.2%Electricity
Private vs. public school enrollment:
| Here: | 0.0% |
| California: | 10.5% |
| Here: | 0.0% |
| California: | 8.5% |
| Here: | 0.0% |
| California: | 15.9% |


