Housing density: 953 houses/condos per square mile
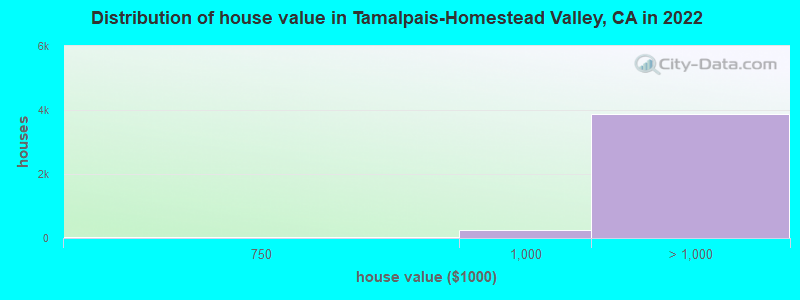
Median price asked for vacant for-sale houses and condos in 2022: $4,918,494.
Median contract rent in 2022: over $2,000 (lower quartile is $1,801, upper quartile is over $2,000)
Median rent asked for vacant for-rent units in 2022: $30,201
Median gross rent in Tamalpais-Homestead Valley, CA in 2022: over $2,000
Housing units in Tamalpais-Homestead Valley with a mortgage: 2,893 (518 second mortgage, 5 home equity loan, 478 both second mortgage and home equity loan) Houses without a mortgage: 62
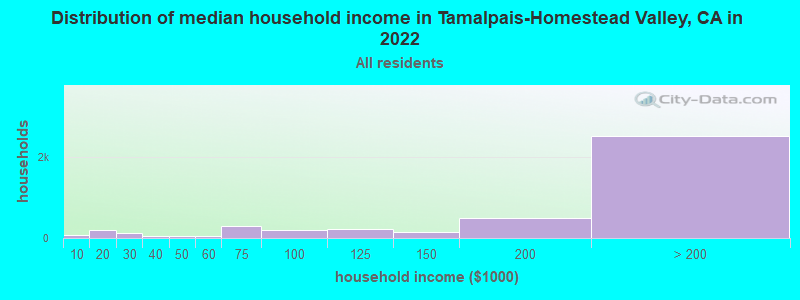
Median household income for houses/condos with a mortgage: $263,303
Median household income for apartments without a mortgage: $266,026
Median monthly housing costs: $3,816
Compare current foreclosures near Tamalpais-Homestead Valley, CA:
Size of family households: 1,158 2-persons, 937 3-persons, 719 4-persons, 274 5-persons, 38 6-persons, 29 7-or-more-persons.
Size of nonfamily households: 947 1-person, 217 2-persons, 41 3-persons.
2,650 married couples with children.
343 single-parent households (134 men, 209 women).
89.1% of residents of Tamalpais-Homestead Valley speak English at home.
5.6% of residents speak Spanish at home (81% speak English very well, 16% speak English well, 3% speak English not well).
3.2% of residents speak other Indo-European language at home (95% speak English very well, 2% speak English well, 2% speak English not well).
1.7% of residents speak Asian or Pacific Island language at home (52% speak English very well, 33% speak English well, 15% speak English not well).
Foreign born population: 1,587 (13.2%)
(72.5% of them are naturalized citizens)
Percentage of workers working in this county: 70.5% Number of people working at home: 2,448 (43.6% of all workers)
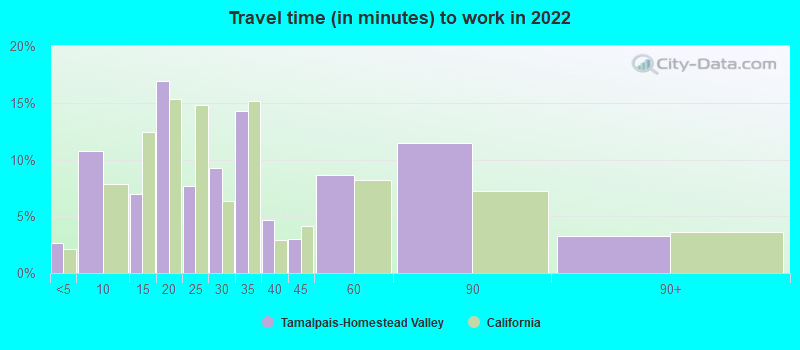
Travel time to work (commute)
Less than 5 minutes: 51
5 to 9 minutes: 266
10 to 14 minutes: 204
15 to 19 minutes: 651
20 to 24 minutes: 446
25 to 29 minutes: 256
30 to 34 minutes: 282
35 to 39 minutes: 181
40 to 44 minutes: 142
45 to 59 minutes: 365
60 to 89 minutes: 222
90 or more minutes: 211
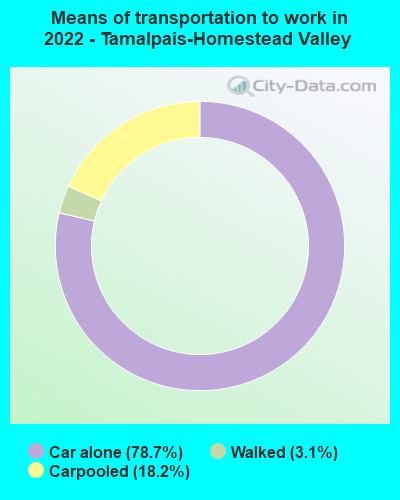
Means of transportation to work:
Drove a car alone: 1,088 (30.7%)
Carpooled: 240 (6.8%)
Walked: 56 (1.6%)
Worked at home: 2,448 (69.1%)
Unemployment by race in 2022
Unemployment rate for White non-Hispanic residents
6.0%Males
3.0%Females
Unemployment rate for Asian residents
4.7%Females
Unemployment rate for two or more race residents
3.6%Males
18.8%Females
Year of entry for the foreign-born population in Tamalpais-Homestead Valley, California
3342010 or later
4462000 to 2009
2921990 to 1999
3031980 to 1989
2381970 to 1979
453Before 1970
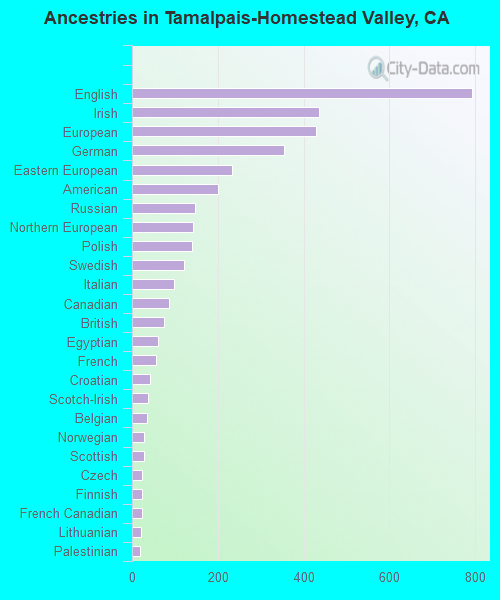
First ancestries reported:
English: 793 (15.9%)
Irish: 436 (8.7%)
European: 429 (8.6%)
German: 354 (7.1%)
Eastern European: 233 (4.7%)
American: 200 (4.0%)
Russian: 146 (2.9%)
Northern European: 142 (2.8%)
Polish: 140 (2.8%)
Swedish: 121 (2.4%)
Italian: 99 (2.0%)
Canadian: 86 (1.7%)
British: 74 (1.5%)
Egyptian: 60 (1.2%)
French: 57 (1.1%)
Croatian: 43 (0.9%)
Scotch-Irish: 38 (0.8%)
Belgian: 36 (0.7%)
Norwegian: 29 (0.6%)
Scottish: 29 (0.6%)
Czech: 24 (0.5%)
Finnish: 23 (0.5%)
French Canadian: 23 (0.5%)
Lithuanian: 21 (0.4%)
Palestinian: 18 (0.4%)
Portuguese: 17 (0.3%)
Dutch: 15 (0.3%)
Scandinavian: 11 (0.2%)
Swiss: 11 (0.2%)
Hungarian: 8 (0.2%)
Austrian: 7 (0.1%)
Greek: 6 (0.1%)
Lebanese: 5 (0.1%)
Most common places of birth for foreign-born residents (%):
United Kingdom, excluding England and Scotland
Tamalpais-Homestead Valley:
13.9% (223)
California:
0.6% (60,582)
Canada
Tamalpais-Homestead Valley:
12.7% (203)
California:
1.2% (127,477)
South Africa
Tamalpais-Homestead Valley:
7.5% (120)
California:
0.2% (20,614)
Mexico
Tamalpais-Homestead Valley:
7.2% (115)
California:
37.2% (3,881,193)
China, excluding Hong Kong and Taiwan
Tamalpais-Homestead Valley:
5.1% (82)
California:
6.6% (684,672)
Germany
Tamalpais-Homestead Valley:
4.5% (72)
California:
0.7% (73,304)
Colombia
Tamalpais-Homestead Valley:
4.0% (64)
California:
0.5% (55,249)
Egypt
Tamalpais-Homestead Valley:
3.6% (57)
California:
0.4% (42,718)
India
Tamalpais-Homestead Valley:
3.5% (56)
California:
5.2% (539,184)
Spain
Tamalpais-Homestead Valley:
3.4% (54)
California:
0.2% (16,586)
Other South America
Tamalpais-Homestead Valley:
3.1% (49)
California:
0.0% (3,239)
Nicaragua
Tamalpais-Homestead Valley:
2.9% (46)
California:
0.6% (58,161)
Korea
Tamalpais-Homestead Valley:
2.7% (43)
California:
3.0% (315,248)
Philippines
Tamalpais-Homestead Valley:
2.6% (41)
California:
7.8% (818,297)
England
Tamalpais-Homestead Valley:
2.3% (37)
California:
0.6% (57,953)
Bosnia and Herzegovina
Tamalpais-Homestead Valley:
1.8% (28)
California:
0.0% (4,867)
France
Tamalpais-Homestead Valley:
1.7% (27)
California:
0.4% (40,224)
Place of birth for U.S.-born residents:
This state: 5,660
Other state: 4,516
Northeast: 2,088
Midwest: 1,187
South: 691
West: 546
92.1% of Tamalpais-Homestead Valley residents lived in the same house 1 years ago. Out of people who lived in different houses, 29.3% lived in this county. Out of people who lived in different counties, 73.4% lived in California.
Tamalpais-Homestead Valley:
92.1%
State average:
88.9%
Education attainment for males 25 years and older:
No schooling: 4
Nursery to 4th grade: 0
5th and 6th grade: 0
7th and 8th grade: 0
9th grade: 0
10th grade: 0
11th grade: 31
12th grade, no diploma: 23
High school graduate (or equivalency): 178
Less than 1 year of college: 50
Some college more than 1 year, no degree: 218
Associate degree: 34
Bachelor's degree: 1,563
Master's degree: 913
Professional school degree: 597
Doctorate degree: 285
Education attainment for females 25 years and older:
No schooling: 7
Nursery to 4th grade: 0
5th and 6th grade: 0
7th and 8th grade: 0
9th grade: 13
10th grade: 20
11th grade: 0
12th grade, no diploma: 20
High school graduate (or equivalency): 300
Less than 1 year of college: 148
Some college more than 1 year, no degree: 193
Associate degree: 106
Bachelor's degree: 1,583
Master's degree: 1,387
Professional school degree: 457
Doctorate degree: 188
Housing units in structures:
One, detached: 4,198
One, attached: 205
Two: 83
3 or 4: 104
5 to 9: 133
10 to 19: 18
20 to 49: 6
Housing units lacking complete plumbing facilities in 2022: 0.9%
Housing units lacking complete kitchen facilities in 2022: 1.9%
House/condo owner moved in on average 16 years ago