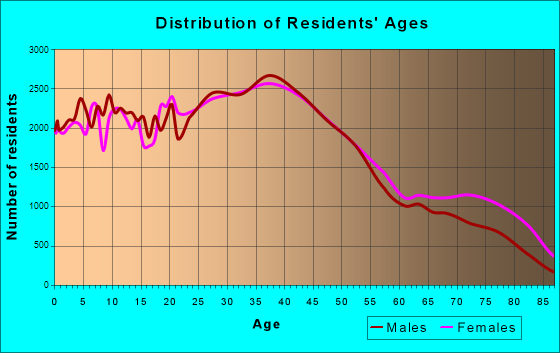
Tampa, FL (Florida) Houses and Residents
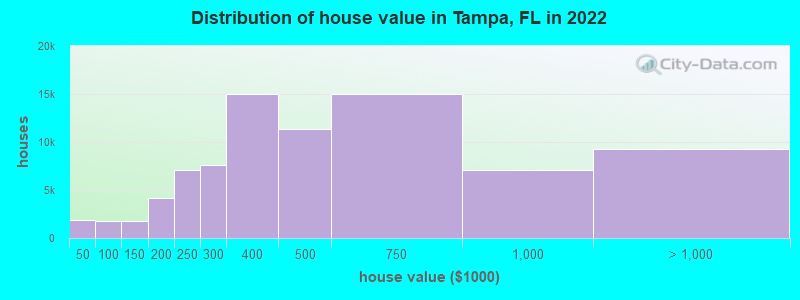
Estimated median house or condo value in 2022: $417,100 (it was $80,700 in 2000 )
Tampa:
$417,100Florida:
$354,100
Lower value quartile - upper value quartile: $277,600 - $683,100Mean price in 2022: Detached houses: $619,603 Here:
$619,603State:
$500,941
Townhouses or other attached units: $463,186 Here:
$463,186State:
$370,869
In 2-unit structures: $353,439 Here:
$353,439State:
$423,188
In 3-to-4-unit structures: $385,581 Here:
$385,581State:
$309,944
In 5-or-more-unit structures: $486,579 Here:
$486,579State:
$447,145
Mobile homes: $105,416 Here:
$105,416State:
$113,202
Occupied boats, RVs, vans, etc.: $203,537 Here:
$203,537State:
$73,933
Total population: 358,699 (Urban population: 302,441, Rural population: 1,071 (all nonfarm) )
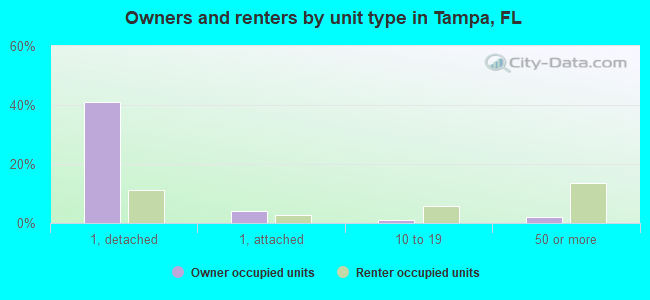
Houses: 183,457 (166,243 occupied: 81,517 owner occupied, 84,726 renter occupied )
% of renters here:
51%State:
33%
Housing density: 1,637 houses/condos per square mile
Median price asked for vacant for-sale houses and condos in 2022: $482,872.
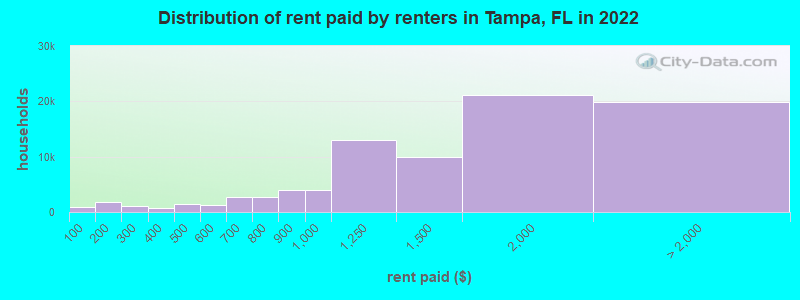
Median contract rent in 2022: $1,444 (lower quartile is $999, upper quartile is $1,935)
Median rent asked for vacant for-rent units in 2022: $2,369
Median gross rent in Tampa, FL in 2022: $1,620
Housing units in Tampa with a mortgage: 53,625 (4,818 second mortgage, 39 home equity loan, 3,909 both second mortgage and home equity loan )Houses without a mortgage: 1,057
Median household income for houses/condos with a mortgage: $115,861
Median household income for apartments without a mortgage: $67,450
Median monthly housing costs: $1,565
Data:
Median house or condo value ($)
Median house or condo value ($ change since 2000)
Median house or condo value ($) - White
Median house or condo value ($) - Black or African American
Median house or condo value ($) - Asian
Median house or condo value ($) - Hispanic or Latino
Median house or condo value ($) - American Indian and Alaska Native
Median house or condo value ($) - Multirace
Median house or condo value ($) - Other Race
Median price asked for mobile homes ($)
Household density (households per square mile)
Mean house or condo value by units in structure - 1, detached ($)
Mean house or condo value by units in structure - 1, attached ($)
Mean house or condo value by units in structure - 2 ($)
Mean house or condo value by units in structure by units in structure - 3 or 4 ($)
Mean house or condo value by units in structure - 5 or more ($)
Mean house or condo value by units in structure - Boat, RV, van, etc. ($)
Mean house or condo value by units in structure - Mobile home ($)
Median contract rent ($)
Median contract rent - Lower quartile ($)
Median contract rent - Upper quartile ($)
Median gross rent ($)
Urban houses (%)
Rural houses (%)
Houses occupied (%)
Houses occupied (% change since 2000)
Houses owner occupied (%)
Houses owner occupied (% change since 2000)
Houses renter occupied (%)
Houses renter occupied (% change since 2000)
Vacant housing units - For rent (%)
Vacant housing units - For rent (% change since 2000)
Vacant housing units - For sale only (%)
Vacant housing units - For sale only (% change since 2000)
Vacant housing units - Rented or sold, not occupied (%)
Vacant housing units - Rented or sold, not occupied (% change since 2000)
Vacant housing units - For seasonal, recreational, or occasional use (%)
Vacant housing units - For seasonal, recreational, or occasional use (% change since 2000)
Vacant housing units - For migrant workers (%)
Vacant housing units - For migrant workers (% change since 2000)
Vacant housing units - Other vacant (%)
Vacant housing units - Other vacant (% change since 2000)
Median monthly housing costs ($)
Median household income for houses/condos with a mortgage ($)
Median household income for houses/condos without a mortgage ($)
Median household income ($)
Median household income ($) - White
Median household income ($) - Black or African American
Median household income ($) - Asian
Median household income ($) - Hispanic or Latino
Median household income ($) - American Indian and Alaska Native
Median household income ($) - Multirace
Median household income ($) - Other Race
Mortgage status - with mortgage (%)
Mortgage status - with second mortgage (%)
Mortgage status - with home equity loan (%)
Mortgage status - with both second mortgage and home equity loan (%)
Mortgage status - without a mortgage (%)
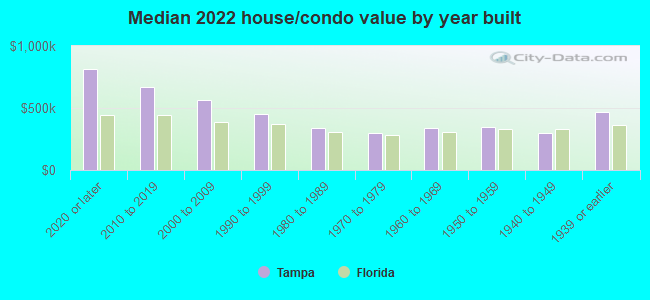
Median year house/condo built
Median year apartment built
Household type by relationship - Male householder living alone (%)
Household type by relationship - Male householder not living alone (%)
Household type by relationship - Female householder living alone (%)
Household type by relationship - Female householder not living alone (%)
Household type by relationship - Opposite-Sex spouse (%)
Household type by relationship - Same-Sex spouse (%)
Household type by relationship - Opposite-Sex unmarried partner (%)
Household type by relationship - Same-Sex unmarried partner (%)
Household type by relationship - In group quarters (%)
Size of family households - 2-person household (%)
Size of family households - 3-person household (%)
Size of family households - 4-person household (%)
Size of family households - 5-person household (%)
Size of family households - 6-person household (%)
Size of family households - 7-or-more-person household (%)
Size of nonfamily households - 1-person household (%)
Size of nonfamily households - 2-person household (%)
Size of nonfamily households - 3-person household (%)
Size of nonfamily households - 4-person household (%)
Size of nonfamily households - 5-person household (%)
Size of nonfamily households - 6-person household (%)
Size of nonfamily households - 7-or-moreperson household (%)
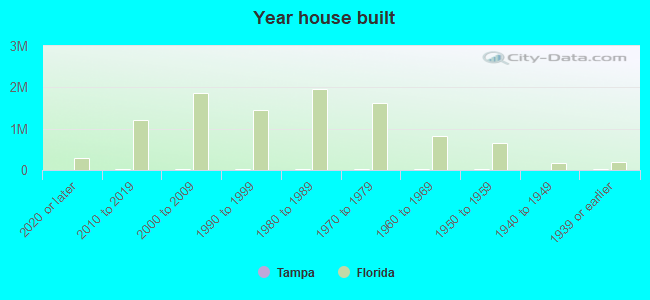
Year house built - Built 2010 or later (%)
Year house built - Built 2000 to 2009 (%)
Year house built - Built 1990 to 1999 (%)
Year house built - Built 1980 to 1989 (%)
Year house built - Built 1970 to 1979 (%)
Year house built - Built 1960 to 1969 (%)
Year house built - Built 1950 to 1959 (%)
Year house built - Built 1940 to 1949 (%)
Year house built - Built 1939 or earlier (%)
Median number of rooms in houses and condos
Median number of rooms in apartments
Median number of bedrooms in owner occupied houses
Mean number of bedrooms in owner occupied houses
Median number of bedrooms in renter occupied houses
Mean number of bedrooms in renter occupied houses
Median number of vehichles in owner occupied houses
Mean number of vehichles in owner occupied houses
Median number of vehichles in renter occupied houses
Mean number of vehichles in renter occupied houses
Rooms in owner-occupied houses - 1 room (%)
Rooms in owner-occupied houses - 2 rooms (%)
Rooms in owner-occupied houses - 3 rooms (%)
Rooms in owner-occupied houses - 4 rooms (%)
Rooms in owner-occupied houses - 5 rooms (%)
Rooms in owner-occupied houses - 6 rooms (%)
Rooms in owner-occupied houses - 7 rooms (%)
Rooms in owner-occupied houses - 8 rooms (%)
Rooms in owner-occupied houses - 9+ rooms (%)
Rooms in renter-occupied houses - 1 room (%)
Rooms in renter-occupied houses - 2 rooms (%)
Rooms in renter-occupied houses - 3 rooms (%)
Rooms in renter-occupied houses - 4 rooms (%)
Rooms in renter-occupied houses - 5 rooms (%)
Rooms in renter-occupied houses - 6 rooms (%)
Rooms in renter-occupied houses - 7 rooms (%)
Rooms in renter-occupied houses - 8 rooms (%)
Rooms in renter-occupied houses - 9+ rooms (%)
Bedrooms in owner-occupied houses - no bedrooms (%)
Bedrooms in owner-occupied houses - 1 bedroom (%)
Bedrooms in owner-occupied houses - 2 bedrooms (%)
Bedrooms in owner-occupied houses - 3 bedrooms (%)
Bedrooms in owner-occupied houses - 4 bedrooms (%)
Bedrooms in owner-occupied houses - 5+ bedrooms (%)
Bedrooms in renter-occupied houses - no bedrooms (%)
Bedrooms in renter-occupied houses - 1 bedroom (%)
Bedrooms in renter-occupied houses - 2 bedrooms (%)
Bedrooms in renter-occupied houses - 3 bedrooms (%)
Bedrooms in renter-occupied houses - 4 bedrooms (%)
Bedrooms in renter-occupied houses - 5+ bedrooms (%)
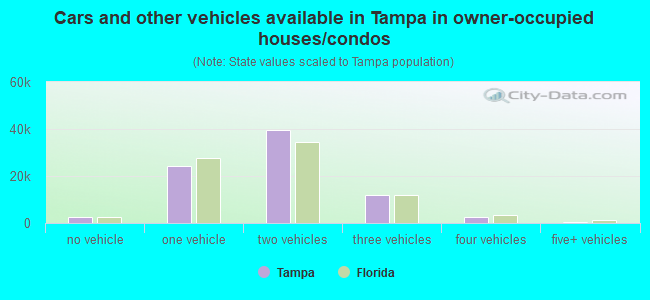
Vehicles available in owner-occupied houses - no vehicle available (%)
Vehicles available in owner-occupied houses - 1 vehicle available(%)
Vehicles available in owner-occupied houses - 2 Vehicles available (%)
Vehicles available in owner-occupied houses - 3 Vehicles available (%)
Vehicles available in owner-occupied houses - 4 Vehicles available (%)
Vehicles available in owner-occupied houses - 5+ Vehicles available (%)
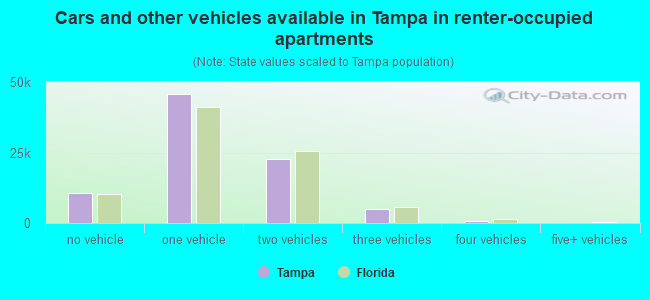
Vehicles available in renter-occupied houses - no vehicle available (%)
Vehicles available in renter-occupied houses - 1 vehicle available (%)
Vehicles available in renter-occupied houses - 2 Vehicles available (%)
Vehicles available in renter-occupied houses - 3 Vehicles available (%)
Vehicles available in renter-occupied houses - 4 Vehicles available (%)
Vehicles available in renter-occupied houses - 5+ Vehicles available (%)
Housing units in structures - 1, detached (%)
Housing units in structures - 1, attached (%)
Housing units in structures - 2 (%)
Housing units in structures - 3 or 4 (%)
Housing units in structures - 5 to 9 (%)
Housing units in structures - 10 to 19 (%)
Housing units in structures - 20 to 49 (%)
Housing units in structures - 50 or more (%)
Housing units in structures - Mobile home (%)
Housing units in structures - Boat, RV, van, etc. (%)
Housing units in structures - Owners - 1, detached (%)
Housing units in structures - Owners - 1, attached (%)
Housing units in structures - Owners - 2 (%)
Housing units in structures - Owners - 3 or 4 (%)
Housing units in structures - Owners - 5 to 9 (%)
Housing units in structures - Owners - 10 to 19 (%)
Housing units in structures - Owners - 20 to 49 (%)
Housing units in structures - Owners - 50 or more (%)
Housing units in structures - Owners - Mobile home (%)
Housing units in structures - Owners - Boat, RV, van, etc. (%)
Housing units in structures - Renters - 1, detached (%)
Housing units in structures - Renters - 1, attached (%)
Housing units in structures - Renters - 2 (%)
Housing units in structures - Renters - 3 or 4 (%)
Housing units in structures - Renters - 5 to 9 (%)
Housing units in structures - Renters - 10 to 19 (%)
Housing units in structures - Renters - 20 to 49 (%)
Housing units in structures - Renters - 50 or more (%)
Housing units in structures - Renters - Mobile home (%)
Housing units in structures - Renters - Boat, RV, van, etc. (%)
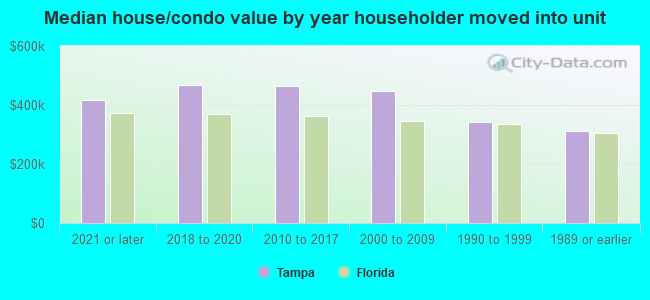
House/condo owner moved in on average (years ago)
Renter moved in on average (years ago)
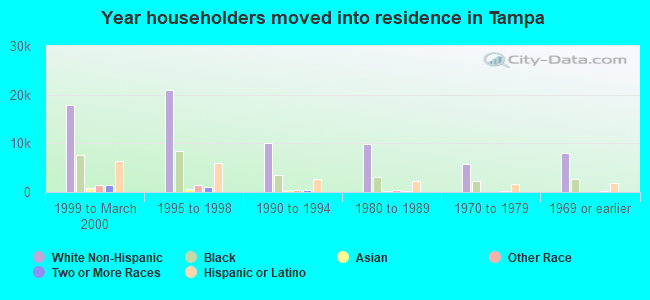
Year householder moved into unit - Moved in 1999 to March 2000 (%)
Year householder moved into unit - Moved in 1999 to March 2000 (%) - White
Year householder moved into unit - Moved in 1999 to March 2000 (%) - Black or African American
Year householder moved into unit - Moved in 1999 to March 2000 (%) - Asian
Year householder moved into unit - Moved in 1999 to March 2000 (%) - Hispanic or Latino
Year householder moved into unit - Moved in 1999 to March 2000 (%) - American Indian and Alaska Native
Year householder moved into unit - Moved in 1999 to March 2000 (%) - Multirace
Year householder moved into unit - Moved in 1999 to March 2000 (%) - Other Race
Year householder moved into unit - Moved in 1995 to 1998 (%)
Year householder moved into unit - Moved in 1995 to 1998 (%) - White
Year householder moved into unit - Moved in 1995 to 1998 (%) - Black or African American
Year householder moved into unit - Moved in 1995 to 1998 (%) - Asian
Year householder moved into unit - Moved in 1995 to 1998 (%) - Hispanic or Latino
Year householder moved into unit - Moved in 1995 to 1998 (%) - American Indian and Alaska Native
Year householder moved into unit - Moved in 1995 to 1998 (%) - Multirace
Year householder moved into unit - Moved in 1995 to 1998 (%) - Other Race
Year householder moved into unit - Moved in 1990 to 1994 (%)
Year householder moved into unit - Moved in 1990 to 1994 (%) - White
Year householder moved into unit - Moved in 1990 to 1994 (%) - Black or African American
Year householder moved into unit - Moved in 1990 to 1994 (%) - Asian
Year householder moved into unit - Moved in 1990 to 1994 (%) - Hispanic or Latino
Year householder moved into unit - Moved in 1990 to 1994 (%) - American Indian and Alaska Native
Year householder moved into unit - Moved in 1990 to 1994 (%) - Multirace
Year householder moved into unit - Moved in 1990 to 1994 (%) - Other Race
Year householder moved into unit - Moved in 1980 to 1989 (%)
Year householder moved into unit - Moved in 1980 to 1989 (%) - White
Year householder moved into unit - Moved in 1980 to 1989 (%) - Black or African American
Year householder moved into unit - Moved in 1980 to 1989 (%) - Asian
Year householder moved into unit - Moved in 1980 to 1989 (%) - Hispanic or Latino
Year householder moved into unit - Moved in 1980 to 1989 (%) - American Indian and Alaska Native
Year householder moved into unit - Moved in 1980 to 1989 (%) - Multirace
Year householder moved into unit - Moved in 1980 to 1989 (%) - Other Race
Year householder moved into unit - Moved in 1970 to 1979 (%)
Year householder moved into unit - Moved in 1970 to 1979 (%) - White
Year householder moved into unit - Moved in 1970 to 1979 (%) - Black or African American
Year householder moved into unit - Moved in 1970 to 1979 (%) - Asian
Year householder moved into unit - Moved in 1970 to 1979 (%) - Hispanic or Latino
Year householder moved into unit - Moved in 1970 to 1979 (%) - American Indian and Alaska Native
Year householder moved into unit - Moved in 1970 to 1979 (%) - Multirace
Year householder moved into unit - Moved in 1970 to 1979 (%) - Other Race
Year householder moved into unit - Moved in 1969 or earlier (%)
Year householder moved into unit - Moved in 1969 or earlier (%) - White
Year householder moved into unit - Moved in 1969 or earlier (%) - Black or African American
Year householder moved into unit - Moved in 1969 or earlier (%) - Asian
Year householder moved into unit - Moved in 1969 or earlier (%) - Hispanic or Latino
Year householder moved into unit - Moved in 1969 or earlier (%) - American Indian and Alaska Native
Year householder moved into unit - Moved in 1969 or earlier (%) - Multirace
Year householder moved into unit - Moved in 1969 or earlier (%) - Other Race
Housing units lacking complete plumbing facilities (%)
Housing units lacking complete kitchen facilities (%)
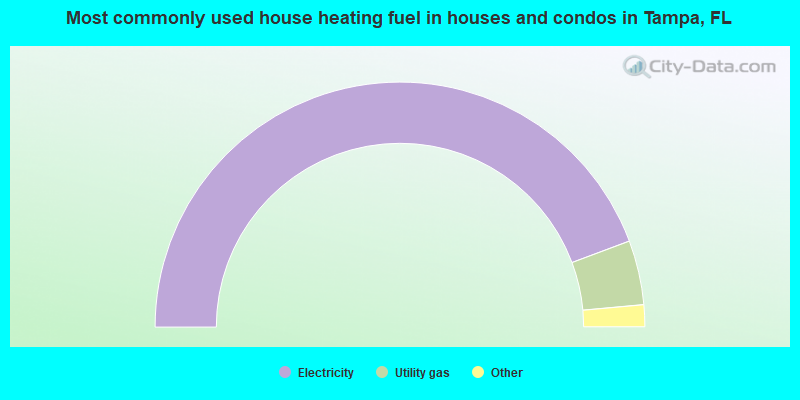
House heating fuel used in houses and condos - Utility gas (%)
House heating fuel used in houses and condos - Bottled, tank, or LP gas (%)
House heating fuel used in houses and condos - Electricity (%)
House heating fuel used in houses and condos - Fuel oil, kerosene, etc. (%)
House heating fuel used in houses and condos - Coal or coke (%)
House heating fuel used in houses and condos - Wood (%)
House heating fuel used in houses and condos - Solar energy (%)
House heating fuel used in houses and condos - Other fuel (%)
House heating fuel used in houses and condos - No fuel used (%)
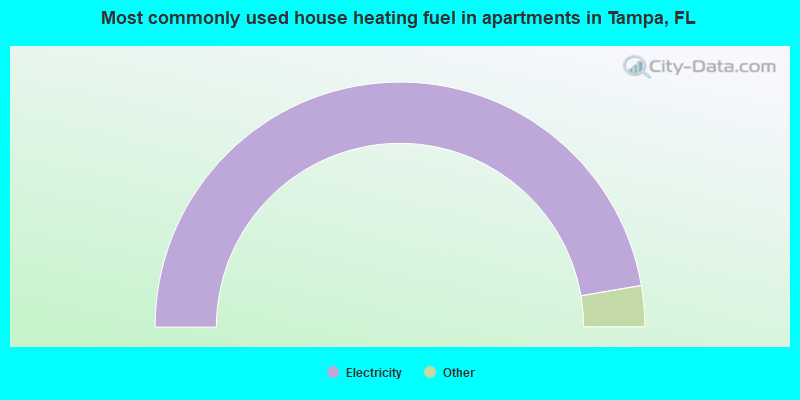
House heating fuel used in apartments - Utility gas (%)
House heating fuel used in apartments - Bottled, tank, or LP gas (%)
House heating fuel used in apartments - Electricity (%)
House heating fuel used in apartments - Fuel oil, kerosene, etc. (%)
House heating fuel used in apartments - Coal or coke (%)
House heating fuel used in apartments - Wood (%)
House heating fuel used in apartments - Solar energy (%)
House heating fuel used in apartments - Other fuel (%)
House heating fuel used in apartments - No fuel used (%)
Latest news about housing in Tampa, FL collected exclusively by city-data.com from local newspapers, TV, and radio stations
Median year house/condo built: 1981Median year apartment built: 1989Household type by relationship:
Households: 398,160
Male householders: 84,817 (29,136 living alone ), Female householders: 81,426 (28,241 living alone )59,071 spouses (58,281 opposite-sex spouses ), 16,138 unmarried partners , (14,146 opposite-sex unmarried partners ), 92,631 children (88,145 natural , 2,038 adopted , 2,448 stepchildren ), 7,440 grandchildren , 6,046 brothers or sisters , 7,134 parents , 533 foster children , 7,451 other relatives , 17,724 non-relatives In group quarters: 17,749
Size of family households: 38,266 2-persons , 20,940 3-persons , 17,536 4-persons , 8,149 5-persons , 2,511 6-persons , 539 7-or-more-persons .
Size of nonfamily households: 57,377 1-person , 17,889 2-persons , 2,682 3-persons , 306 4-persons , 48 5-persons .
40,855 married couples with children. single-parent households (7,173 men , 19,935 women ).
71.6% of residents of Tampa speak English at home. of residents speak Spanish at home (52% speak English very well , 16% speak English well , 17% speak English not well , 15% don't speak English at all ).of residents speak other Indo-European language at home (75% speak English very well , 17% speak English well , 5% speak English not well , 3% don't speak English at all ).of residents speak Asian or Pacific Island language at home (63% speak English very well , 21% speak English well , 14% speak English not well , 2% don't speak English at all ).of residents speak other language at home (64% speak English very well , 27% speak English well , 4% speak English not well , 5% don't speak English at all ).
Foreign born population: 79,760 (20.0%)of them are naturalized citizens )
Median number of rooms in houses and condos:
Median number of rooms in apartments
Owner-occupied Renter-occupied
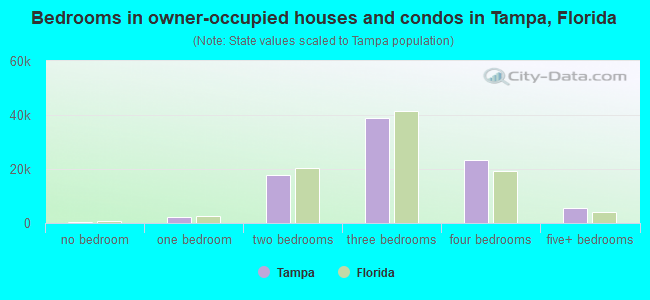
Bedrooms in owner-occupied houses and condos in Tampa, Florida
574 no bedroom 2,158 1 bedroom 17,076 2 bedrooms 36,773 3 bedrooms 19,265 4 bedrooms 5,671 5+ bedrooms
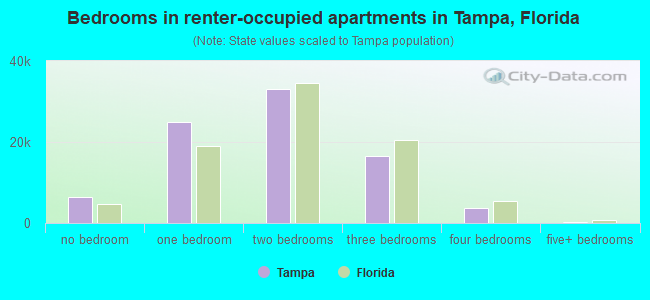
Bedrooms in renter-occupied apartments in Tampa, Florida
6,331 no bedroom 24,893 1 bedroom 33,104 2 bedrooms 16,507 3 bedrooms 3,679 4 bedrooms 212 5+ bedrooms
Owner-occupied Renter-occupied
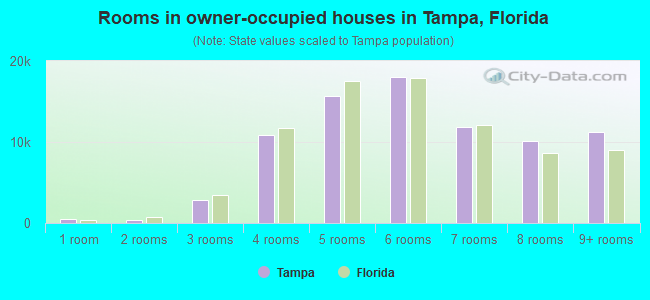
Rooms in owner-occupied houses in Tampa, Florida
467 1 room 356 2 rooms 2,901 3 rooms 10,865 4 rooms 15,685 5 rooms 18,035 6 rooms 11,854 7 rooms 10,124 8 rooms 11,230 9+ rooms
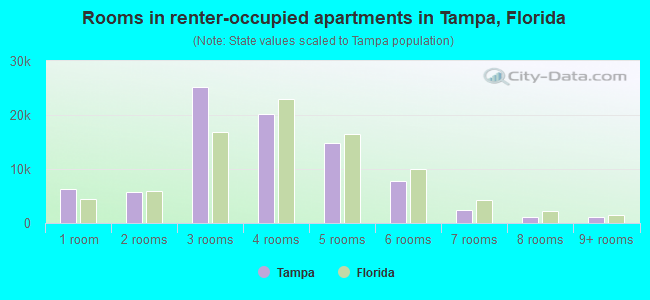
Rooms in renter-occupied apartments in Tampa, Florida
6,294 1 room 5,734 2 rooms 25,181 3 rooms 20,263 4 rooms 14,899 5 rooms 7,796 6 rooms 2,421 7 rooms 1,099 8 rooms 1,039 9+ rooms
Tampa, FL household income distribution 12,053 Less than $10,00013,756 $10,000 to $19,99911,886 $20,000 to $29,99912,850 $30,000 to $39,99912,054 $40,000 to $49,99910,357 $50,000 to $59,99914,471 $60,000 to $74,99918,683 $75,000 to $99,99915,361 $100,000 to $124,9998,756 $125,000 to $149,99912,536 $150,000 to $199,99923,480 $200,000 or more
Home value of owner - occupied houses in 2022 in Tampa, FL 511 Less than $10,000275 $15,000 to $19,999161 $20,000 to $24,99926 $25,000 to $29,999195 $30,000 to $34,999127 $35,000 to $39,999612 $40,000 to $49,99953 $50,000 to $59,999342 $60,000 to $69,999245 $70,000 to $79,999457 $80,000 to $89,99982 $90,000 to $99,9991,140 $100,000 to $124,999675 $125,000 to $149,9991,891 $150,000 to $174,9992,319 $175,000 to $199,9997,085 $200,000 to $249,9997,586 $250,000 to $299,99915,027 $300,000 to $399,99911,377 $400,000 to $499,99914,955 $500,000 to $749,9997,082 $750,000 to $999,9994,716 $1,000,000 to $1,499,9992,096 $1,500,000 to $1,999,9992,482 $2,000,000 or moreRent paid by renters in 2022 in Tampa, FL 836 Less than $100565 $100 to $1491,298 $150 to $199855 $200 to $249305 $250 to $299206 $300 to $349507 $350 to $399529 $400 to $449926 $450 to $499476 $500 to $549724 $550 to $5991,308 $600 to $6491,324 $650 to $699967 $700 to $7491,831 $750 to $7994,051 $800 to $8993,940 $900 to $99912,950 $1,000 to $1,2499,998 $1,250 to $1,49921,176 $1,500 to $1,9999,968 $2,000 to $2,4995,200 $2,500 to $2,9991,704 $3,000 to $3,4991,035 $3,500 or more2,047 No cash rent
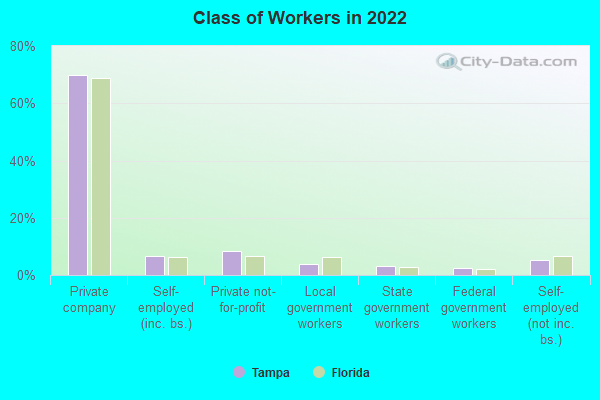
Percentage of workers working in this county: 88.0%Number of people working at home: 44,286 (21.3% of all workers )
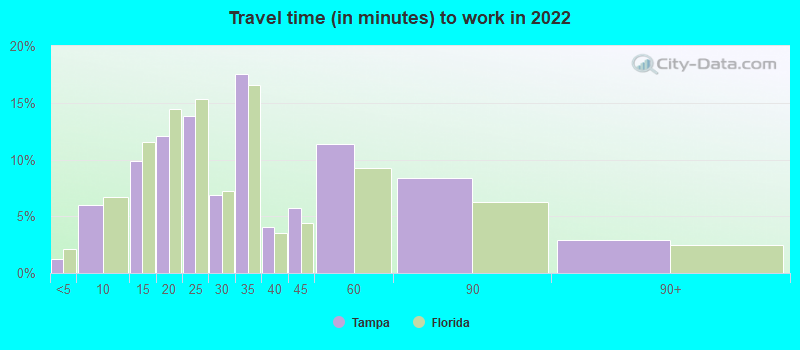
Travel time to work (commute)
Less than 5 minutes: 2,9625 to 9 minutes: 14,05710 to 14 minutes: 25,56015 to 19 minutes: 25,07220 to 24 minutes: 26,12525 to 29 minutes: 13,11530 to 34 minutes: 23,65935 to 39 minutes: 4,91740 to 44 minutes: 6,61145 to 59 minutes: 10,17160 to 89 minutes: 8,28590 or more minutes: 3,303
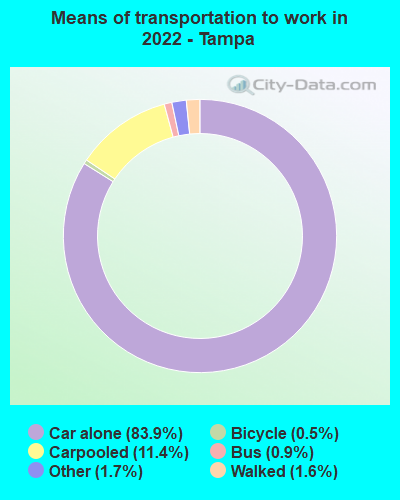
Means of transportation to work:
Drove a car alone: 275,672 (74.0%)Carpooled: 37,392 (10.0%)Bus : 2,906 (0.8%)Taxi: 5,741 (1.5%)Bicycle: 1,595 (0.4%)Walked: 5,180 (1.4%)Worked at home: 44,286 (11.9%)
Unemployment by race in 2022
Unemployment rate for White non-Hispanic residents 2.0% Males2.8% FemalesUnemployment rate for Black residents 8.1% Males9.3% FemalesUnemployment rate for American Indian and Alaska Native residents 5.1% Males23.4% FemalesUnemployment rate for Asian residents 0.9% Males3.6% FemalesUnemployment rate for other race residents 10.9% FemalesUnemployment rate for two or more race residents 6.2% Males2.8% FemalesUnemployment rate for Hispanic or Latino residents 5.1% Males6.4% Females
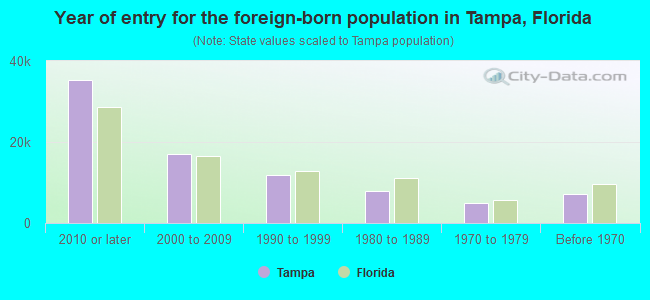
Year of entry for the foreign-born population in Tampa, Florida
35,405 2010 or later 16,946 2000 to 2009 11,869 1990 to 1999 7,982 1980 to 1989 4,960 1970 to 1979 7,281 Before 1970
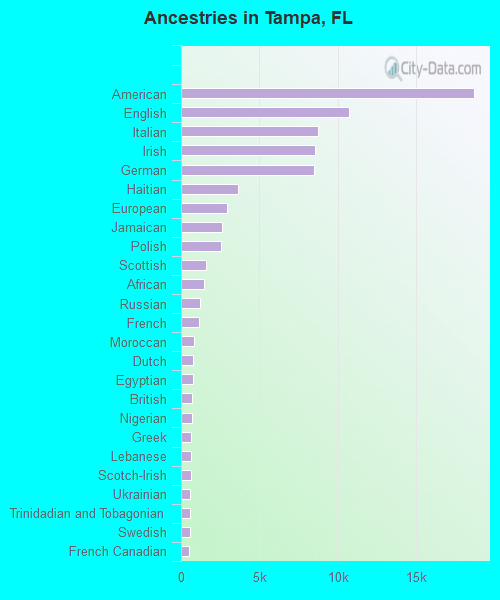
First ancestries reported:
American: 18,740 (8.1%)
English: 10,717 (4.6%)
Italian: 8,751 (3.8%)
Irish: 8,577 (3.7%)
German: 8,521 (3.7%)
Haitian: 3,627 (1.6%)
European: 2,966 (1.3%)
Jamaican: 2,591 (1.1%)
Polish: 2,545 (1.1%)
Scottish: 1,566 (0.7%)
African: 1,456 (0.6%)
Russian: 1,189 (0.5%)
French: 1,119 (0.5%)
Moroccan: 822 (0.4%)
Dutch: 794 (0.3%)
Egyptian: 757 (0.3%)
British: 698 (0.3%)
Nigerian: 686 (0.3%)
Greek: 666 (0.3%)
Lebanese: 633 (0.3%)
Scotch-Irish: 620 (0.3%)
Ukrainian: 606 (0.3%)
Trinidadian and Tobagonian: 598 (0.3%)
Swedish: 569 (0.2%)
French Canadian: 529 (0.2%)
Bahamian: 525 (0.2%)
Arab: 497 (0.2%)
Iranian: 490 (0.2%)
Eastern European: 480 (0.2%)
Palestinian: 479 (0.2%)
Norwegian: 473 (0.2%)
Portuguese: 440 (0.2%)
British West Indian: 408 (0.2%)
Hungarian: 347 (0.2%)
Iraqi: 335 (0.1%)
Brazilian: 331 (0.1%)
Albanian: 328 (0.1%)
Syrian: 321 (0.1%)
Bulgarian: 317 (0.1%)
Israeli: 314 (0.1%)
U.S. Virgin Islander: 286 (0.1%)
Ethiopian: 285 (0.1%)
Czech: 279 (0.1%)
Turkish: 279 (0.1%)
Romanian: 275 (0.1%)
West Indian: 252 (0.1%)
Northern European: 228 (0.10%)
Welsh: 228 (0.10%)
Lithuanian: 227 (0.10%)
Scandinavian: 226 (0.10%)
Canadian: 208 (0.09%)
Danish: 182 (0.08%)
Slovak: 179 (0.08%)
Yugoslavian: 171 (0.07%)
Jordanian: 159 (0.07%)
Austrian: 149 (0.06%)
Swiss: 130 (0.06%)
Guyanese: 128 (0.06%)
Croatian: 121 (0.05%)
South African: 117 (0.05%)
Slavic: 81 (0.04%)
Australian: 79 (0.03%)
Afghan: 74 (0.03%)
Belgian: 73 (0.03%)
Kenyan: 64 (0.03%)
Armenian: 64 (0.03%)
Macedonian: 64 (0.03%)
Icelander: 61 (0.03%)
Serbian: 61 (0.03%)
Basque: 52 (0.02%)
Celtic: 43 (0.02%)
Finnish: 40 (0.02%)
Dutch West Indian: 35 (0.02%)
Belizean: 31 (0.01%)
Ugandan: 28 (0.01%)
Cypriot: 26 (0.01%)
Zimbabwean: 23 (0.01%)
Assyrian: 22 (0.01%)
Slovene: 21 (0.01%)
Maltese: 19 (0.01%)
Sierra Leonean: 19 (0.01%)
Liberian: 17 (0.01%)
Most common places of birth for foreign-born residents (%): Cuba Tampa:
24.4% (18,358)Florida:
22.0% (1,006,576)
India Tampa:
6.6% (5,006)Florida:
2.1% (94,349)
Mexico Tampa:
5.7% (4,281)Florida:
5.6% (257,152)
Colombia Tampa:
4.1% (3,063)Florida:
6.5% (298,669)
Dominican Republic Tampa:
4.0% (2,980)Florida:
3.0% (137,727)
Venezuela Tampa:
3.8% (2,852)Florida:
5.7% (262,042)
Honduras Tampa:
3.5% (2,668)Florida:
2.3% (107,160)
Jamaica Tampa:
3.1% (2,371)Florida:
5.0% (227,319)
Haiti Tampa:
2.9% (2,216)Florida:
7.5% (342,375)
Peru Tampa:
2.2% (1,628)Florida:
2.1% (96,693)
China, excluding Hong Kong and Taiwan Tampa:
2.0% (1,505)Florida:
1.2% (56,071)
Vietnam Tampa:
1.8% (1,322)Florida:
1.3% (60,604)
Canada Tampa:
1.6% (1,206)Florida:
2.4% (109,132)
Philippines Tampa:
1.6% (1,203)Florida:
1.8% (84,403)
Place of birth for U.S.-born residents:
This state: 158,022Other state: 142,135Northeast: 54,267Midwest: 32,118South: 40,717West: 15,033 77.9% of Tampa residents lived in the same house 1 years ago.
Out of people who lived in different houses, 34.3% lived in this county.
Out of people who lived in different counties, 41.9% lived in Florida.
Tampa:
77.9%State average:
86.3%
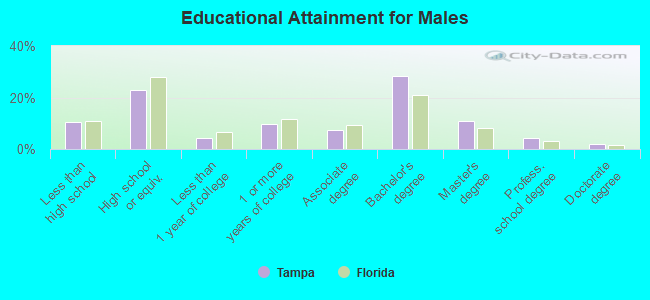
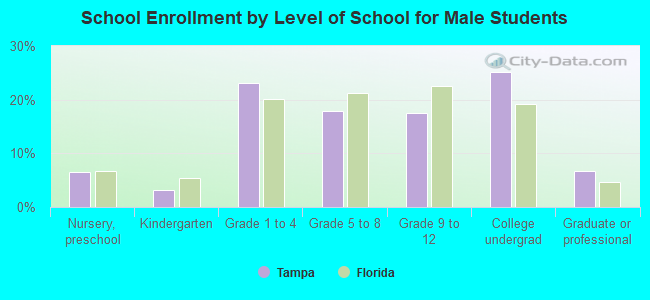
Education attainment for males 25 years and older:
No schooling: 2,439Nursery to 4th grade: 6435th and 6th grade: 1,4507th and 8th grade: 1,0529th grade: 2,79010th grade: 1,90311th grade: 2,07512th grade, no diploma: 1,939High school graduate (or equivalency): 31,200Less than 1 year of college: 5,803Some college more than 1 year, no degree: 13,347Associate degree: 10,063Bachelor's degree: 38,745Master's degree: 14,897Professional school degree: 6,042Doctorate degree: 2,715
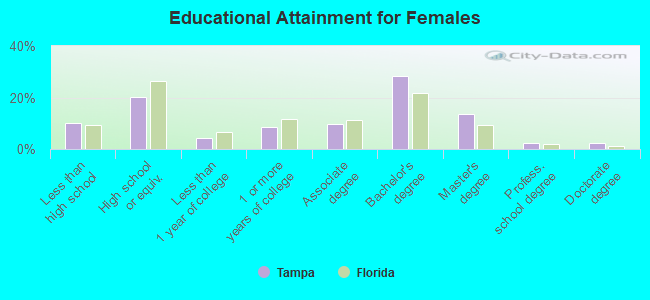
Education attainment for females 25 years and older:
No schooling: 2,166Nursery to 4th grade: 6555th and 6th grade: 1,9227th and 8th grade: 8209th grade: 1,93810th grade: 1,87111th grade: 1,79612th grade, no diploma: 2,512High school graduate (or equivalency): 27,096Less than 1 year of college: 5,674Some college more than 1 year, no degree: 11,583Associate degree: 13,040Bachelor's degree: 38,198Master's degree: 18,140Professional school degree: 3,345Doctorate degree: 3,191
Housing units in structures:
One, detached: 91,475One, attached: 12,233Two: 6,2583 or 4: 6,8985 to 9: 10,69710 to 19: 13,00320 to 49: 8,70050 or more: 30,778Mobile homes: 2,886Boats, RVs, vans, etc.: 529Median worth of mobile homes: $48,200
Housing units lacking complete plumbing facilities in 2022: 0.8%Housing units lacking complete kitchen facilities in 2022: 1.5%House/condo owner moved in on average 9 years ago
Renter moved in on average 2 years ago
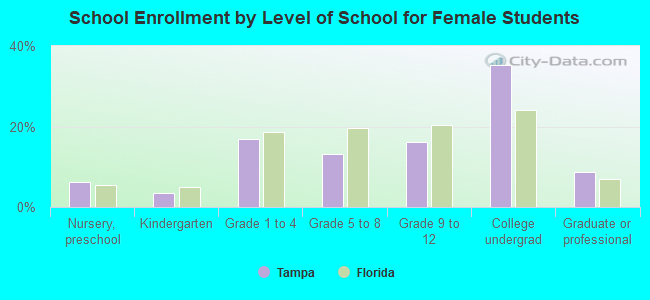
Private vs. public school enrollment:
Students in private schools in grades 1 to 8 (elementary and middle school): 4,628 Students in private schools in grades 9 to 12 (high school): 1,772 Students in private undergraduate colleges: 10,916