Tinley Park, IL (Illinois) Houses and Residents
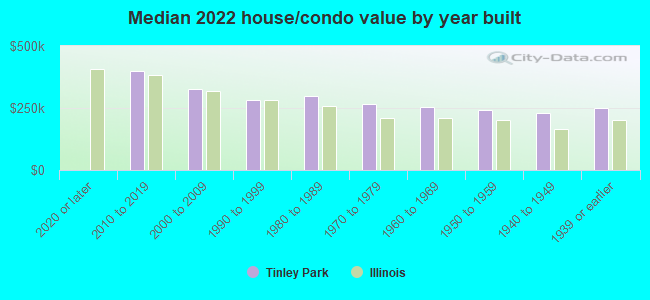
Estimated median house or condo value in 2022: $285,596 (it was $160,900 in 2000 )
Tinley Park:
$285,596Illinois:
$251,600
Lower value quartile - upper value quartile: $220,118 - $372,844Mean price in 2022: Detached houses: $335,437 Here:
$335,437State:
$310,164
Townhouses or other attached units: $228,659 Here:
$228,659State:
$286,230
In 2-unit structures: $332,630 Here:
$332,630State:
$299,638
In 3-to-4-unit structures: $150,183 Here:
$150,183State:
$330,907
In 5-or-more-unit structures: $174,172 Here:
$174,172State:
$318,887
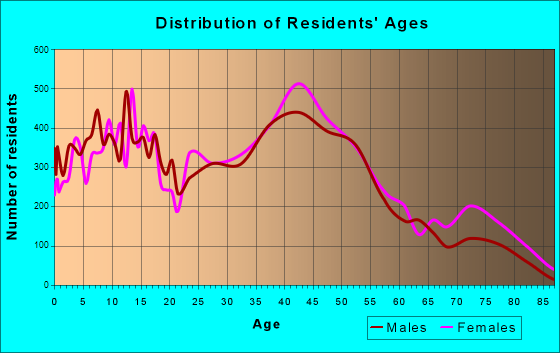
Total population: 57,280 (Urban population: 47,982, Rural population: 345 (7 farm, 338 nonfarm ))
Houses: 22,988 (21,966 occupied: 19,537 owner occupied, 2,803 renter occupied )
% of renters here:
13%State:
33%
Housing density: 1,537 houses/condos per square mile
Median price asked for vacant for-sale houses and condos in 2022: $190,893.
Median contract rent in 2022: $1,289 (lower quartile is $1,050, upper quartile is $1,699)
Median rent asked for vacant for-rent units in 2022: $1,094
Median gross rent in Tinley Park, IL in 2022: $1,392
Housing units in Tinley Park with a mortgage: 12,381 (1,099 second mortgage, 3 home equity loan, 890 both second mortgage and home equity loan )Houses without a mortgage: 535
Median household income for houses/condos with a mortgage: $121,006
Median household income for apartments without a mortgage: $81,216
Median monthly housing costs: $1,551
Data:
Median house or condo value ($)
Median house or condo value ($ change since 2000)
Median house or condo value ($) - White
Median house or condo value ($) - Black or African American
Median house or condo value ($) - Asian
Median house or condo value ($) - Hispanic or Latino
Median house or condo value ($) - American Indian and Alaska Native
Median house or condo value ($) - Multirace
Median house or condo value ($) - Other Race
Median price asked for mobile homes ($)
Household density (households per square mile)
Mean house or condo value by units in structure - 1, detached ($)
Mean house or condo value by units in structure - 1, attached ($)
Mean house or condo value by units in structure - 2 ($)
Mean house or condo value by units in structure by units in structure - 3 or 4 ($)
Mean house or condo value by units in structure - 5 or more ($)
Mean house or condo value by units in structure - Boat, RV, van, etc. ($)
Mean house or condo value by units in structure - Mobile home ($)
Median contract rent ($)
Median contract rent - Lower quartile ($)
Median contract rent - Upper quartile ($)
Median gross rent ($)
Urban houses (%)
Rural houses (%)
Houses occupied (%)
Houses occupied (% change since 2000)
Houses owner occupied (%)
Houses owner occupied (% change since 2000)
Houses renter occupied (%)
Houses renter occupied (% change since 2000)
Vacant housing units - For rent (%)
Vacant housing units - For rent (% change since 2000)
Vacant housing units - For sale only (%)
Vacant housing units - For sale only (% change since 2000)
Vacant housing units - Rented or sold, not occupied (%)
Vacant housing units - Rented or sold, not occupied (% change since 2000)
Vacant housing units - For seasonal, recreational, or occasional use (%)
Vacant housing units - For seasonal, recreational, or occasional use (% change since 2000)
Vacant housing units - For migrant workers (%)
Vacant housing units - For migrant workers (% change since 2000)
Vacant housing units - Other vacant (%)
Vacant housing units - Other vacant (% change since 2000)
Median monthly housing costs ($)
Median household income for houses/condos with a mortgage ($)
Median household income for houses/condos without a mortgage ($)
Median household income ($)
Median household income ($) - White
Median household income ($) - Black or African American
Median household income ($) - Asian
Median household income ($) - Hispanic or Latino
Median household income ($) - American Indian and Alaska Native
Median household income ($) - Multirace
Median household income ($) - Other Race
Mortgage status - with mortgage (%)
Mortgage status - with second mortgage (%)
Mortgage status - with home equity loan (%)
Mortgage status - with both second mortgage and home equity loan (%)
Mortgage status - without a mortgage (%)
Median year house/condo built
Median year apartment built
Household type by relationship - Male householder living alone (%)
Household type by relationship - Male householder not living alone (%)
Household type by relationship - Female householder living alone (%)
Household type by relationship - Female householder not living alone (%)
Household type by relationship - Opposite-Sex spouse (%)
Household type by relationship - Same-Sex spouse (%)
Household type by relationship - Opposite-Sex unmarried partner (%)
Household type by relationship - Same-Sex unmarried partner (%)
Household type by relationship - In group quarters (%)
Size of family households - 2-person household (%)
Size of family households - 3-person household (%)
Size of family households - 4-person household (%)
Size of family households - 5-person household (%)
Size of family households - 6-person household (%)
Size of family households - 7-or-more-person household (%)
Size of nonfamily households - 1-person household (%)
Size of nonfamily households - 2-person household (%)
Size of nonfamily households - 3-person household (%)
Size of nonfamily households - 4-person household (%)
Size of nonfamily households - 5-person household (%)
Size of nonfamily households - 6-person household (%)
Size of nonfamily households - 7-or-moreperson household (%)
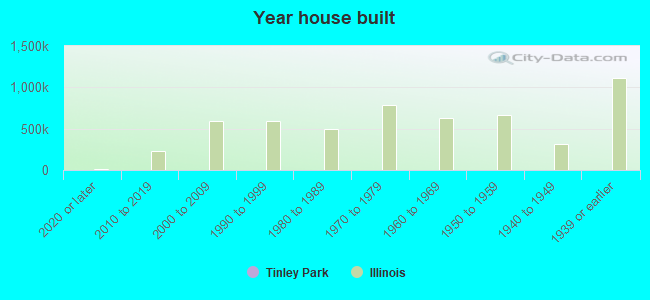
Year house built - Built 2010 or later (%)
Year house built - Built 2000 to 2009 (%)
Year house built - Built 1990 to 1999 (%)
Year house built - Built 1980 to 1989 (%)
Year house built - Built 1970 to 1979 (%)
Year house built - Built 1960 to 1969 (%)
Year house built - Built 1950 to 1959 (%)
Year house built - Built 1940 to 1949 (%)
Year house built - Built 1939 or earlier (%)
Median number of rooms in houses and condos
Median number of rooms in apartments
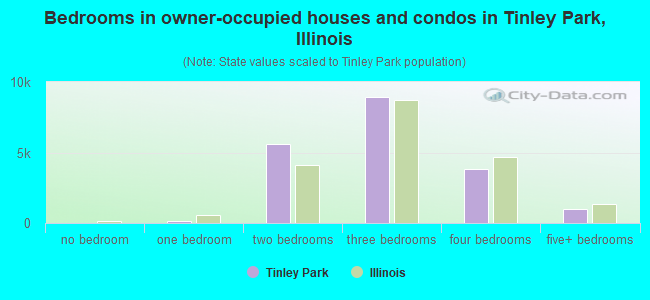
Median number of bedrooms in owner occupied houses
Mean number of bedrooms in owner occupied houses
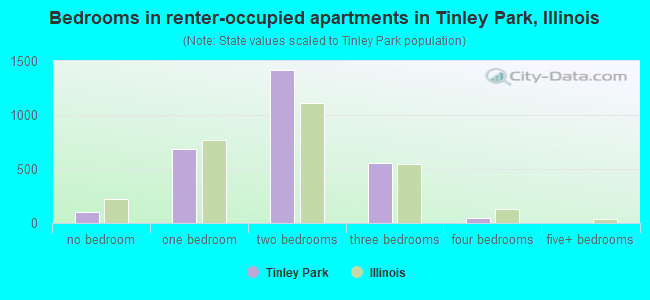
Median number of bedrooms in renter occupied houses
Mean number of bedrooms in renter occupied houses
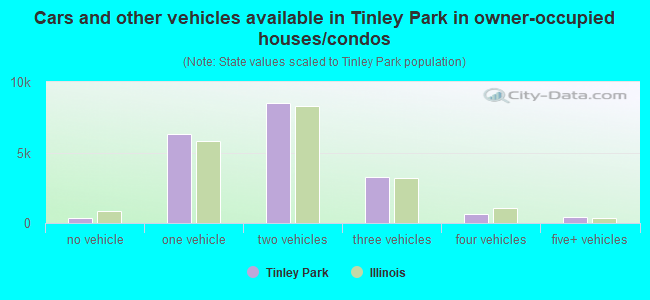
Median number of vehichles in owner occupied houses
Mean number of vehichles in owner occupied houses
Median number of vehichles in renter occupied houses
Mean number of vehichles in renter occupied houses
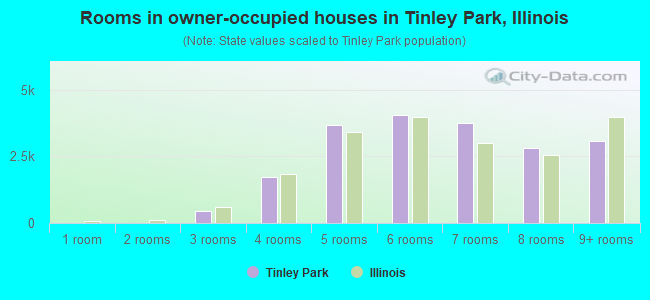
Rooms in owner-occupied houses - 1 room (%)
Rooms in owner-occupied houses - 2 rooms (%)
Rooms in owner-occupied houses - 3 rooms (%)
Rooms in owner-occupied houses - 4 rooms (%)
Rooms in owner-occupied houses - 5 rooms (%)
Rooms in owner-occupied houses - 6 rooms (%)
Rooms in owner-occupied houses - 7 rooms (%)
Rooms in owner-occupied houses - 8 rooms (%)
Rooms in owner-occupied houses - 9+ rooms (%)
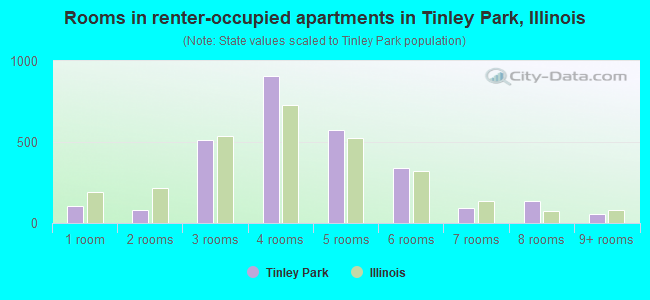
Rooms in renter-occupied houses - 1 room (%)
Rooms in renter-occupied houses - 2 rooms (%)
Rooms in renter-occupied houses - 3 rooms (%)
Rooms in renter-occupied houses - 4 rooms (%)
Rooms in renter-occupied houses - 5 rooms (%)
Rooms in renter-occupied houses - 6 rooms (%)
Rooms in renter-occupied houses - 7 rooms (%)
Rooms in renter-occupied houses - 8 rooms (%)
Rooms in renter-occupied houses - 9+ rooms (%)
Bedrooms in owner-occupied houses - no bedrooms (%)
Bedrooms in owner-occupied houses - 1 bedroom (%)
Bedrooms in owner-occupied houses - 2 bedrooms (%)
Bedrooms in owner-occupied houses - 3 bedrooms (%)
Bedrooms in owner-occupied houses - 4 bedrooms (%)
Bedrooms in owner-occupied houses - 5+ bedrooms (%)
Bedrooms in renter-occupied houses - no bedrooms (%)
Bedrooms in renter-occupied houses - 1 bedroom (%)
Bedrooms in renter-occupied houses - 2 bedrooms (%)
Bedrooms in renter-occupied houses - 3 bedrooms (%)
Bedrooms in renter-occupied houses - 4 bedrooms (%)
Bedrooms in renter-occupied houses - 5+ bedrooms (%)
Vehicles available in owner-occupied houses - no vehicle available (%)
Vehicles available in owner-occupied houses - 1 vehicle available(%)
Vehicles available in owner-occupied houses - 2 Vehicles available (%)
Vehicles available in owner-occupied houses - 3 Vehicles available (%)
Vehicles available in owner-occupied houses - 4 Vehicles available (%)
Vehicles available in owner-occupied houses - 5+ Vehicles available (%)
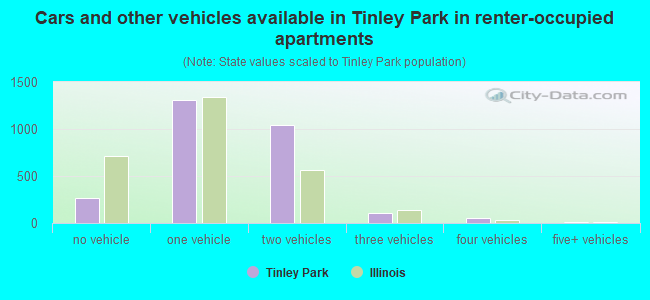
Vehicles available in renter-occupied houses - no vehicle available (%)
Vehicles available in renter-occupied houses - 1 vehicle available (%)
Vehicles available in renter-occupied houses - 2 Vehicles available (%)
Vehicles available in renter-occupied houses - 3 Vehicles available (%)
Vehicles available in renter-occupied houses - 4 Vehicles available (%)
Vehicles available in renter-occupied houses - 5+ Vehicles available (%)
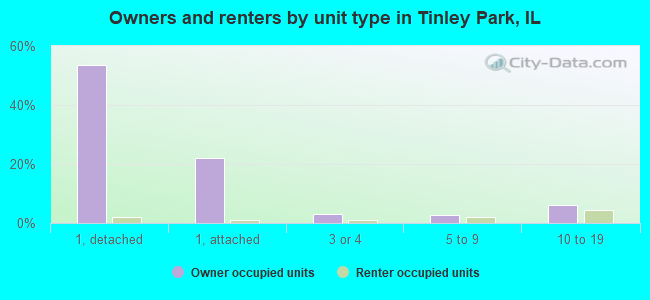
Housing units in structures - 1, detached (%)
Housing units in structures - 1, attached (%)
Housing units in structures - 2 (%)
Housing units in structures - 3 or 4 (%)
Housing units in structures - 5 to 9 (%)
Housing units in structures - 10 to 19 (%)
Housing units in structures - 20 to 49 (%)
Housing units in structures - 50 or more (%)
Housing units in structures - Mobile home (%)
Housing units in structures - Boat, RV, van, etc. (%)
Housing units in structures - Owners - 1, detached (%)
Housing units in structures - Owners - 1, attached (%)
Housing units in structures - Owners - 2 (%)
Housing units in structures - Owners - 3 or 4 (%)
Housing units in structures - Owners - 5 to 9 (%)
Housing units in structures - Owners - 10 to 19 (%)
Housing units in structures - Owners - 20 to 49 (%)
Housing units in structures - Owners - 50 or more (%)
Housing units in structures - Owners - Mobile home (%)
Housing units in structures - Owners - Boat, RV, van, etc. (%)
Housing units in structures - Renters - 1, detached (%)
Housing units in structures - Renters - 1, attached (%)
Housing units in structures - Renters - 2 (%)
Housing units in structures - Renters - 3 or 4 (%)
Housing units in structures - Renters - 5 to 9 (%)
Housing units in structures - Renters - 10 to 19 (%)
Housing units in structures - Renters - 20 to 49 (%)
Housing units in structures - Renters - 50 or more (%)
Housing units in structures - Renters - Mobile home (%)
Housing units in structures - Renters - Boat, RV, van, etc. (%)
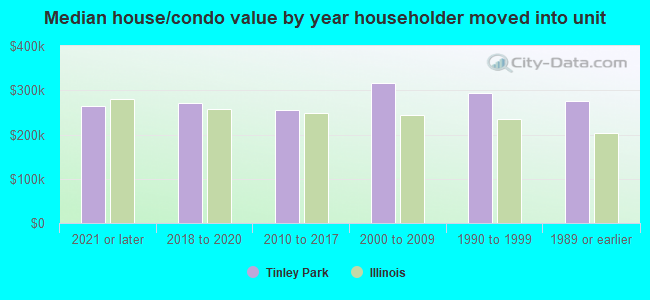
House/condo owner moved in on average (years ago)
Renter moved in on average (years ago)
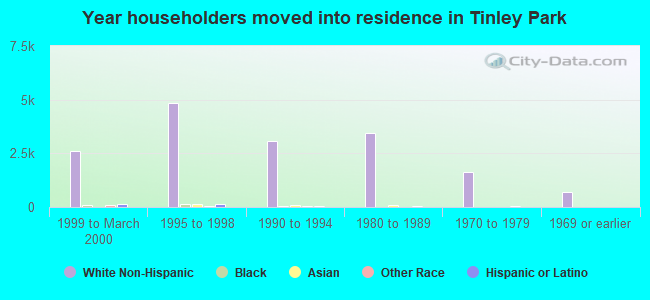
Year householder moved into unit - Moved in 1999 to March 2000 (%)
Year householder moved into unit - Moved in 1999 to March 2000 (%) - White
Year householder moved into unit - Moved in 1999 to March 2000 (%) - Black or African American
Year householder moved into unit - Moved in 1999 to March 2000 (%) - Asian
Year householder moved into unit - Moved in 1999 to March 2000 (%) - Hispanic or Latino
Year householder moved into unit - Moved in 1999 to March 2000 (%) - American Indian and Alaska Native
Year householder moved into unit - Moved in 1999 to March 2000 (%) - Multirace
Year householder moved into unit - Moved in 1999 to March 2000 (%) - Other Race
Year householder moved into unit - Moved in 1995 to 1998 (%)
Year householder moved into unit - Moved in 1995 to 1998 (%) - White
Year householder moved into unit - Moved in 1995 to 1998 (%) - Black or African American
Year householder moved into unit - Moved in 1995 to 1998 (%) - Asian
Year householder moved into unit - Moved in 1995 to 1998 (%) - Hispanic or Latino
Year householder moved into unit - Moved in 1995 to 1998 (%) - American Indian and Alaska Native
Year householder moved into unit - Moved in 1995 to 1998 (%) - Multirace
Year householder moved into unit - Moved in 1995 to 1998 (%) - Other Race
Year householder moved into unit - Moved in 1990 to 1994 (%)
Year householder moved into unit - Moved in 1990 to 1994 (%) - White
Year householder moved into unit - Moved in 1990 to 1994 (%) - Black or African American
Year householder moved into unit - Moved in 1990 to 1994 (%) - Asian
Year householder moved into unit - Moved in 1990 to 1994 (%) - Hispanic or Latino
Year householder moved into unit - Moved in 1990 to 1994 (%) - American Indian and Alaska Native
Year householder moved into unit - Moved in 1990 to 1994 (%) - Multirace
Year householder moved into unit - Moved in 1990 to 1994 (%) - Other Race
Year householder moved into unit - Moved in 1980 to 1989 (%)
Year householder moved into unit - Moved in 1980 to 1989 (%) - White
Year householder moved into unit - Moved in 1980 to 1989 (%) - Black or African American
Year householder moved into unit - Moved in 1980 to 1989 (%) - Asian
Year householder moved into unit - Moved in 1980 to 1989 (%) - Hispanic or Latino
Year householder moved into unit - Moved in 1980 to 1989 (%) - American Indian and Alaska Native
Year householder moved into unit - Moved in 1980 to 1989 (%) - Multirace
Year householder moved into unit - Moved in 1980 to 1989 (%) - Other Race
Year householder moved into unit - Moved in 1970 to 1979 (%)
Year householder moved into unit - Moved in 1970 to 1979 (%) - White
Year householder moved into unit - Moved in 1970 to 1979 (%) - Black or African American
Year householder moved into unit - Moved in 1970 to 1979 (%) - Asian
Year householder moved into unit - Moved in 1970 to 1979 (%) - Hispanic or Latino
Year householder moved into unit - Moved in 1970 to 1979 (%) - American Indian and Alaska Native
Year householder moved into unit - Moved in 1970 to 1979 (%) - Multirace
Year householder moved into unit - Moved in 1970 to 1979 (%) - Other Race
Year householder moved into unit - Moved in 1969 or earlier (%)
Year householder moved into unit - Moved in 1969 or earlier (%) - White
Year householder moved into unit - Moved in 1969 or earlier (%) - Black or African American
Year householder moved into unit - Moved in 1969 or earlier (%) - Asian
Year householder moved into unit - Moved in 1969 or earlier (%) - Hispanic or Latino
Year householder moved into unit - Moved in 1969 or earlier (%) - American Indian and Alaska Native
Year householder moved into unit - Moved in 1969 or earlier (%) - Multirace
Year householder moved into unit - Moved in 1969 or earlier (%) - Other Race
Housing units lacking complete plumbing facilities (%)
Housing units lacking complete kitchen facilities (%)
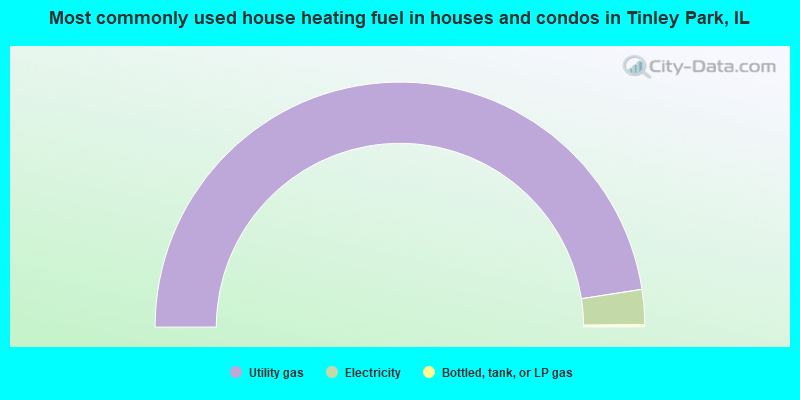
House heating fuel used in houses and condos - Utility gas (%)
House heating fuel used in houses and condos - Bottled, tank, or LP gas (%)
House heating fuel used in houses and condos - Electricity (%)
House heating fuel used in houses and condos - Fuel oil, kerosene, etc. (%)
House heating fuel used in houses and condos - Coal or coke (%)
House heating fuel used in houses and condos - Wood (%)
House heating fuel used in houses and condos - Solar energy (%)
House heating fuel used in houses and condos - Other fuel (%)
House heating fuel used in houses and condos - No fuel used (%)
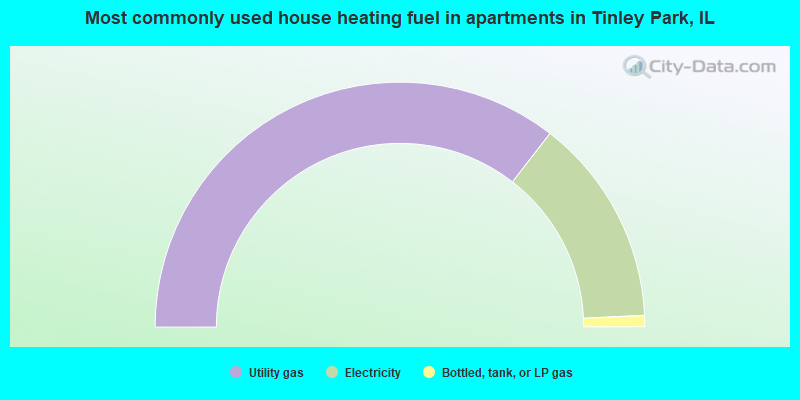
House heating fuel used in apartments - Utility gas (%)
House heating fuel used in apartments - Bottled, tank, or LP gas (%)
House heating fuel used in apartments - Electricity (%)
House heating fuel used in apartments - Fuel oil, kerosene, etc. (%)
House heating fuel used in apartments - Coal or coke (%)
House heating fuel used in apartments - Wood (%)
House heating fuel used in apartments - Solar energy (%)
House heating fuel used in apartments - Other fuel (%)
House heating fuel used in apartments - No fuel used (%)
Median year house/condo built: 1989Median year apartment built: 1978Household type by relationship:
Households: 54,336
Male householders: 11,286 (2,563 living alone ), Female householders: 10,100 (3,496 living alone )11,326 spouses (11,295 opposite-sex spouses ), 1,095 unmarried partners , (1,095 opposite-sex unmarried partners ), 17,175 children (16,479 natural , 213 adopted , 483 stepchildren ), 782 grandchildren , 434 brothers or sisters , 854 parents , 0 foster children , 538 other relatives , 659 non-relatives In group quarters: 83
Size of family households: 5,765 2-persons , 3,681 3-persons , 3,526 4-persons , 1,287 5-persons , 323 6-persons , 169 7-or-more-persons .
Size of nonfamily households: 6,510 1-person , 880 2-persons , 48 3-persons , 46 4-persons .
8,275 married couples with children. single-parent households (387 men , 1,266 women ).
83.4% of residents of Tinley Park speak English at home. of residents speak Spanish at home (64% speak English very well , 27% speak English well , 7% speak English not well , 2% don't speak English at all ).of residents speak other Indo-European language at home (71% speak English very well , 19% speak English well , 9% speak English not well , 1% don't speak English at all ).of residents speak Asian or Pacific Island language at home (74% speak English very well , 21% speak English well , 5% speak English not well ).of residents speak other language at home (75% speak English very well , 11% speak English well , 12% speak English not well , 2% don't speak English at all ).
Foreign born population: 5,292 (9.7%)of them are naturalized citizens )
Median number of rooms in houses and condos:
Median number of rooms in apartments
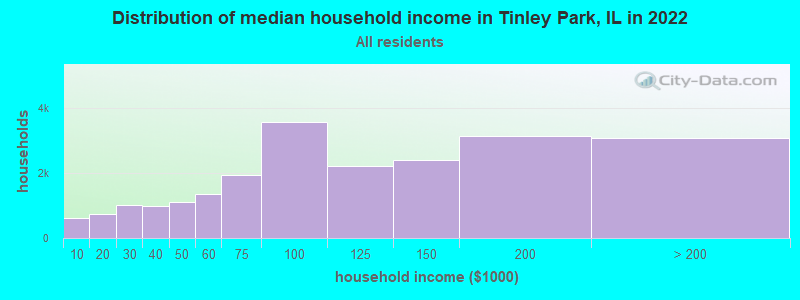
Tinley Park, IL household income distribution 625 Less than $10,000744 $10,000 to $19,9991,003 $20,000 to $29,999993 $30,000 to $39,9991,119 $40,000 to $49,9991,353 $50,000 to $59,9991,947 $60,000 to $74,9993,558 $75,000 to $99,9992,209 $100,000 to $124,9992,401 $125,000 to $149,9993,131 $150,000 to $199,9993,066 $200,000 or more
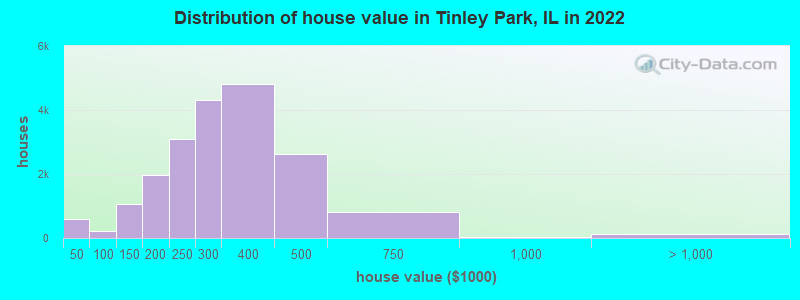
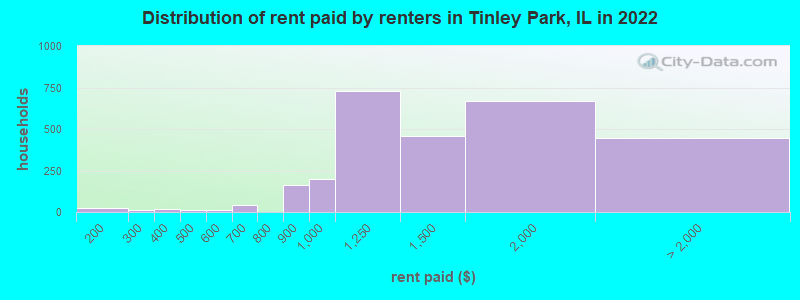
Home value of owner - occupied houses in 2022 in Tinley Park, IL 112 Less than $10,00050 $10,000 to $14,99947 $15,000 to $19,99999 $20,000 to $24,999223 $25,000 to $29,99939 $30,000 to $34,9999 $40,000 to $49,99951 $70,000 to $79,99919 $80,000 to $89,999127 $90,000 to $99,999433 $100,000 to $124,999618 $125,000 to $149,999896 $150,000 to $174,9991,066 $175,000 to $199,9993,108 $200,000 to $249,9994,311 $250,000 to $299,9994,813 $300,000 to $399,9992,626 $400,000 to $499,999807 $500,000 to $749,99932 $750,000 to $999,999124 $1,000,000 to $1,499,99911 $2,000,000 or moreRent paid by renters in 2022 in Tinley Park, IL 7 $100 to $14919 $150 to $19911 $200 to $2498 $300 to $34912 $350 to $39913 $400 to $44912 $550 to $59944 $650 to $699162 $800 to $899199 $900 to $999730 $1,000 to $1,249459 $1,250 to $1,499670 $1,500 to $1,999205 $2,000 to $2,49949 $2,500 to $2,999188 No cash rent
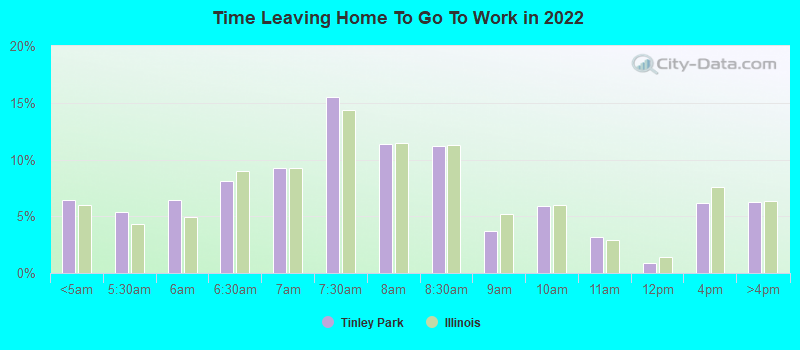
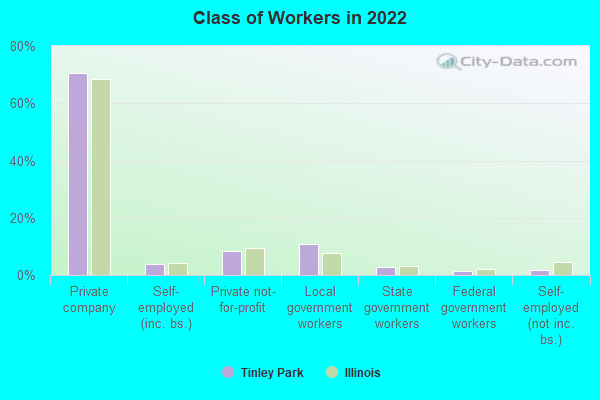
Percentage of workers working in this county: 67.8%Number of people working at home: 3,253 (11.4% of all workers )
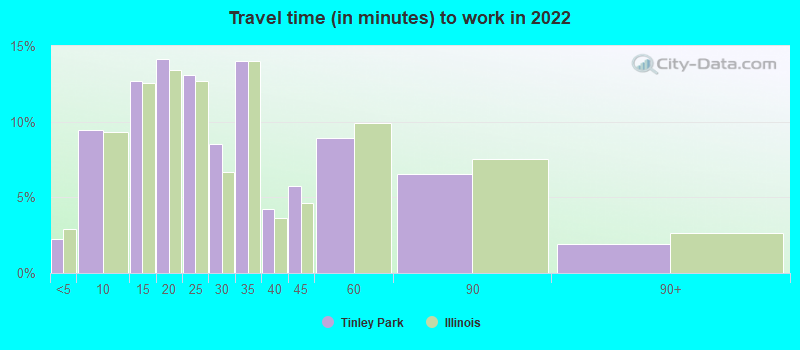
Travel time to work (commute)
Less than 5 minutes: 4745 to 9 minutes: 1,58410 to 14 minutes: 2,31615 to 19 minutes: 2,69220 to 24 minutes: 2,47125 to 29 minutes: 1,44330 to 34 minutes: 3,85235 to 39 minutes: 1,16040 to 44 minutes: 1,46545 to 59 minutes: 2,69760 to 89 minutes: 3,44790 or more minutes: 1,062
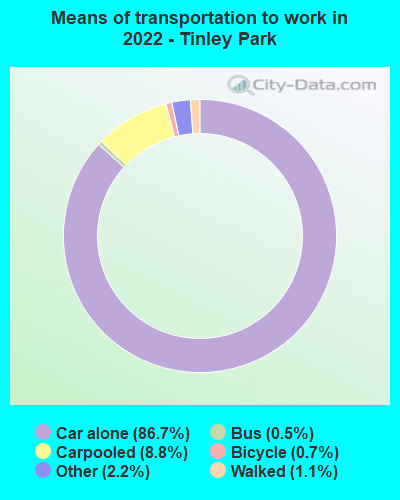
Means of transportation to work:
Drove a car alone: 14,260 (73.6%)Carpooled: 1,547 (8.0%)Bus : 71 (0.4%)Long-distance train or commuter rail : 10 (0.1%)Taxi: 360 (1.9%)Bicycle: 119 (0.6%)Walked: 193 (1.0%)Worked at home: 3,253 (16.8%)
Unemployment by race in 2022
Unemployment rate for White non-Hispanic residents 4.1% Males3.2% FemalesUnemployment rate for Black residents 19.8% Males8.1% FemalesUnemployment rate for Asian residents 3.9% MalesUnemployment rate for other race residents 11.1% MalesUnemployment rate for two or more race residents 3.2% Males1.0% FemalesUnemployment rate for Hispanic or Latino residents 8.8% Males1.9% Females
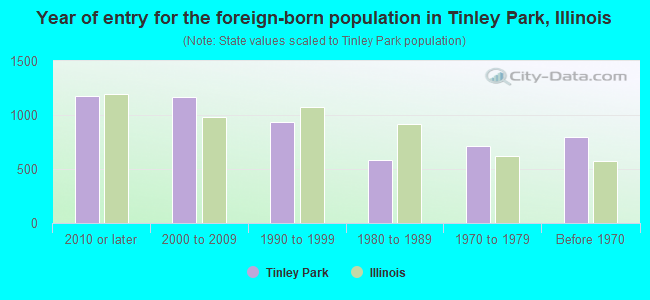
Year of entry for the foreign-born population in Tinley Park, Illinois
1,174 2010 or later 1,169 2000 to 2009 937 1990 to 1999 581 1980 to 1989 710 1970 to 1979 793 Before 1970
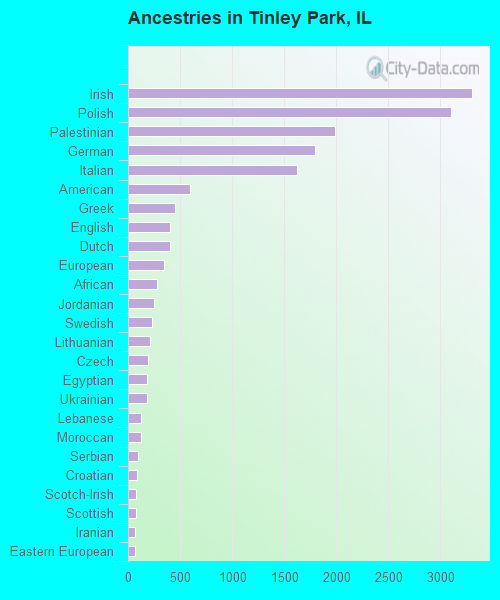
First ancestries reported:
Irish: 3,301 (13.8%)
Polish: 3,103 (13.0%)
Palestinian: 1,988 (8.3%)
German: 1,795 (7.5%)
Italian: 1,627 (6.8%)
American: 600 (2.5%)
Greek: 448 (1.9%)
English: 408 (1.7%)
Dutch: 401 (1.7%)
European: 346 (1.4%)
African: 280 (1.2%)
Jordanian: 250 (1.0%)
Swedish: 226 (0.9%)
Lithuanian: 215 (0.9%)
Czech: 190 (0.8%)
Egyptian: 186 (0.8%)
Ukrainian: 184 (0.8%)
Lebanese: 129 (0.5%)
Moroccan: 126 (0.5%)
Serbian: 94 (0.4%)
Croatian: 88 (0.4%)
Scotch-Irish: 79 (0.3%)
Scottish: 77 (0.3%)
Iranian: 71 (0.3%)
Eastern European: 68 (0.3%)
Austrian: 61 (0.3%)
Arab: 51 (0.2%)
Czechoslovakian: 47 (0.2%)
Norwegian: 47 (0.2%)
French Canadian: 44 (0.2%)
French: 44 (0.2%)
Scandinavian: 41 (0.2%)
Nigerian: 37 (0.2%)
Slovak: 32 (0.1%)
British: 20 (0.08%)
Danish: 20 (0.08%)
Hungarian: 19 (0.08%)
Turkish: 15 (0.06%)
Ethiopian: 14 (0.06%)
Welsh: 13 (0.05%)
Albanian: 12 (0.05%)
Belgian: 11 (0.05%)
Celtic: 5 (0.02%) Most common places of birth for foreign-born residents (%): Mexico Tinley Park:
21.0% (1,111)Illinois:
34.7% (626,958)
Poland Tinley Park:
9.5% (505)Illinois:
6.9% (124,474)
Philippines Tinley Park:
9.2% (485)Illinois:
5.2% (93,003)
Jordan Tinley Park:
5.6% (297)Illinois:
0.5% (8,827)
India Tinley Park:
5.2% (275)Illinois:
9.2% (166,409)
Asia, n.e.c. Tinley Park:
4.9% (259)Illinois:
0.4% (7,117)
Egypt Tinley Park:
3.6% (192)Illinois:
0.3% (5,762)
Pakistan Tinley Park:
3.3% (176)Illinois:
1.6% (29,519)
Italy Tinley Park:
2.9% (155)Illinois:
0.9% (15,679)
China, excluding Hong Kong and Taiwan Tinley Park:
2.8% (146)Illinois:
4.1% (74,364)
Israel Tinley Park:
2.6% (138)Illinois:
0.2% (4,177)
Nigeria Tinley Park:
2.6% (135)Illinois:
1.2% (21,186)
Ukraine Tinley Park:
2.3% (123)Illinois:
1.6% (29,316)
Place of birth for U.S.-born residents:
This state: 43,157Other state: 5,269Northeast: 560Midwest: 2,597South: 1,473West: 653 91.9% of Tinley Park residents lived in the same house 1 years ago.
Out of people who lived in different houses, 43.9% lived in this county.
Out of people who lived in different counties, 52.0% lived in Illinois.
Tinley Park:
91.9%State average:
88.3%
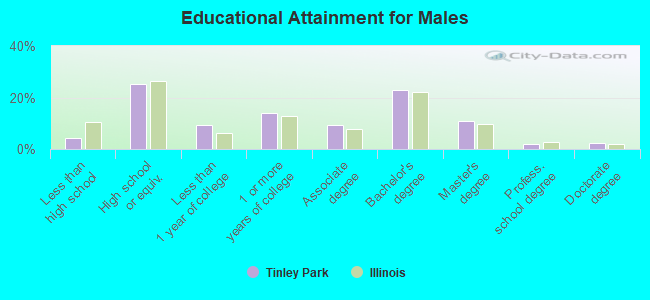
Education attainment for males 25 years and older:
No schooling: 124Nursery to 4th grade: 365th and 6th grade: 877th and 8th grade: 729th grade: 10510th grade: 5511th grade: 7012th grade, no diploma: 219High school graduate (or equivalency): 4,756Less than 1 year of college: 1,771Some college more than 1 year, no degree: 2,622Associate degree: 1,787Bachelor's degree: 4,329Master's degree: 2,017Professional school degree: 376Doctorate degree: 402
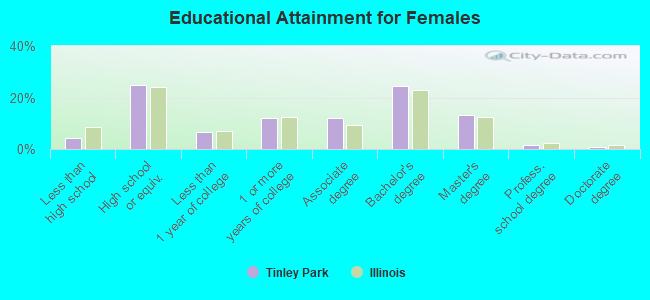
Education attainment for females 25 years and older:
No schooling: 207Nursery to 4th grade: 05th and 6th grade: 807th and 8th grade: 1959th grade: 4910th grade: 7711th grade: 4812th grade, no diploma: 221High school graduate (or equivalency): 5,097Less than 1 year of college: 1,371Some college more than 1 year, no degree: 2,454Associate degree: 2,440Bachelor's degree: 4,994Master's degree: 2,729Professional school degree: 289Doctorate degree: 186
Housing units in structures:
One, detached: 12,874One, attached: 4,884Two: 1543 or 4: 9605 to 9: 1,06510 to 19: 2,26520 to 49: 18450 or more: 598Housing units lacking complete plumbing facilities in 2022: 0.1%Housing units lacking complete kitchen facilities in 2022: 0.7%House/condo owner moved in on average 13 years ago
Renter moved in on average 2 years ago
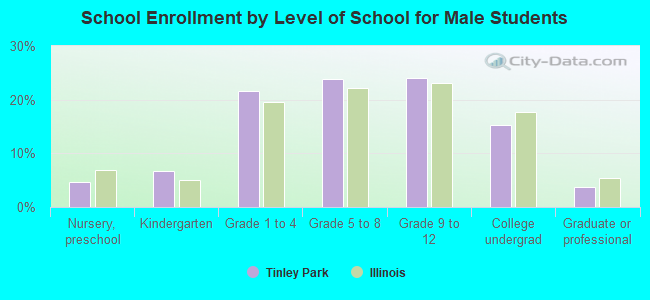
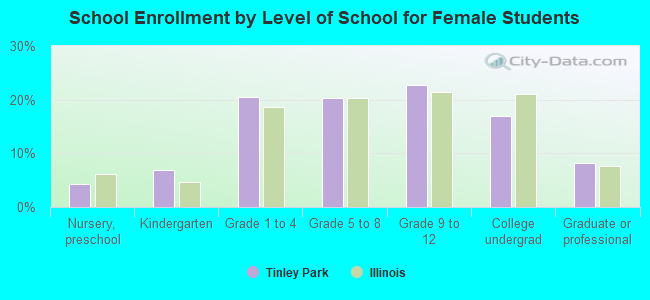
Private vs. public school enrollment:
Students in private schools in grades 1 to 8 (elementary and middle school): 310 Students in private schools in grades 9 to 12 (high school): 206 Students in private undergraduate colleges: 463