Tiskilwa, IL (Illinois) Houses and Residents
| Tiskilwa: | $91,338 |
| Illinois: | $251,600 |
Total population: 796 (Urban population: 0, Rural population: 787 (all nonfarm))
Houses: 353 (312 occupied: 236 owner occupied, 80 renter occupied)
| % of renters here: | 25% |
| State: | 33% |
Housing density: 737 houses/condos per square mile
Median price asked for vacant for-sale houses and condos in 2022: $153,801.
Median contract rent in 2022: $572 (lower quartile is $490, upper quartile is $669)
Median rent asked for vacant for-rent units in 2022: $496
Median gross rent in Tiskilwa, IL in 2022: $754
Housing units in Tiskilwa with a mortgage: 121 (5 second mortgage, 0 home equity loan, 5 both second mortgage and home equity loan)
Houses without a mortgage: 0
Median household income for houses/condos with a mortgage: $68,864
Median household income for apartments without a mortgage: $47,289
Median monthly housing costs: $715
Compare current foreclosures near Tiskilwa, IL:
| Photo | Address | Area | Beds / Baths | Price | Details |
|---|---|---|---|---|---|

|
#1
2150 East St
Tiskilwa, IL 61368
|
1,630 sq. feet
|
2 baths 3 beds |
show details | |

|
#2
E 4th St
Spring Valley, IL 61362
|
- sq. feet
|
1 baths 3 beds |
show details | |

|
#3
Robert St
Henry, IL 61537
|
- sq. feet
|
- baths - beds |
$29,900
|
show details |

|
#4
E Main St
Granville, IL 61326
|
2,691 sq. feet
|
3 baths 5 beds |
show details | |

|
#5
Lincoln St
Seatonville, IL 61359
|
2,308 sq. feet
|
3 baths 4 beds |
show details | |

|
#6
E Marion St
Princeton, IL 61356
|
1,268 sq. feet
|
1 baths 2 beds |
show details | |

|
#7
N 6th St
Neponset, IL 61345
|
1,240 sq. feet
|
1 baths 3 beds |
show details | |

|
#8
E 6th St
Spring Valley, IL 61362
|
- sq. feet
|
- baths - beds |
show details | |

|
#9
County Road 950 N
Sparland, IL 61565
|
1,143 sq. feet
|
- baths - beds |
show details | |

|
#10
E Erie St
Spring Valley, IL 61362
|
- sq. feet
|
- baths - beds |
show details |
| Photo | Address | Area | Beds / Baths | Price | Details |
|---|---|---|---|---|---|

|
#11
N 4th St
Neponset, IL 61345
|
- sq. feet
|
- baths - beds |
show details | |

|
#12
N Park Ave
Dover, IL 61323
|
- sq. feet
|
- baths - beds |
show details | |

|
#13
Bryan St
Henry, IL 61537
|
1,155 sq. feet
|
- baths - beds |
show details | |

|
#14
Market St
Henry, IL 61537
|
1,065 sq. feet
|
- baths - beds |
show details | |

|
#15
Carroll St
Henry, IL 61537
|
- sq. feet
|
- baths - beds |
show details | |

|
#16
School St
Henry, IL 61537
|
1,540 sq. feet
|
- baths - beds |
show details | |

|
#17
N Main St
Manlius, IL 61338
|
- sq. feet
|
- baths - beds |
show details | |

|
#18
E 1st St
Spring Valley, IL 61362
|
- sq. feet
|
- baths - beds |
show details | |

|
#19
Western Rd
Henry, IL 61537
|
- sq. feet
|
- baths - beds |
show details | |

|
#20
2nd St
Mark, IL 61340
|
- sq. feet
|
- baths - beds |
show details |
| Photo | Address | Area | Beds / Baths | Price | Details |
|---|---|---|---|---|---|

|
#21
Monroe St
Henry, IL 61537
|
886 sq. feet
|
- baths - beds |
show details | |

|
#22
300 East St
Sheffield, IL 61361
|
- sq. feet
|
- baths - beds |
show details | |

|
#23
E 4th St
Depue, IL 61322
|
- sq. feet
|
- baths - beds |
show details | |

|
#24
E High St
Hennepin, IL 61327
|
- sq. feet
|
- baths - beds |
show details | |

|
#25
N Mercer St
Princeton, IL 61356
|
- sq. feet
|
- baths - beds |
show details | |

|
#26
E Main St
Wyanet, IL 61379
|
- sq. feet
|
- baths - beds |
show details | |

|
#27
W Clark St
Princeton, IL 61356
|
- sq. feet
|
- baths - beds |
show details | |

|
#28
1/2 W Marquette St
Princeton, IL 61356
|
- sq. feet
|
- baths - beds |
show details | |

|
#29
N Chestnut St
Princeton, IL 61356
|
- sq. feet
|
- baths - beds |
show details | |

|
#30
E 4th St
Depue, IL 61322
|
- sq. feet
|
- baths - beds |
show details |
| Photo | Address | Area | Beds / Baths | Price | Details |
|---|---|---|---|---|---|

|
#31
E Mulberry St
Hennepin, IL 61327
|
- sq. feet
|
- baths - beds |
show details | |

|
#32
W Iowa St
Spring Valley, IL 61362
|
- sq. feet
|
- baths - beds |
show details | |

|
#33
W Central Ave
Princeton, IL 61356
|
- sq. feet
|
- baths - beds |
show details | |

|
#34
S Church St
Princeton, IL 61356
|
- sq. feet
|
- baths - beds |
show details | |

|
#35
S King St
Wyanet, IL 61379
|
- sq. feet
|
- baths - beds |
show details | |

|
#36
S King St
Wyanet, IL 61379
|
- sq. feet
|
- baths - beds |
show details | |

|
#37
W Minnesota St
Spring Valley, IL 61362
|
- sq. feet
|
- baths - beds |
show details | |

|
#38
Wyanet Walnut Rd
Princeton, IL 61356
|
- sq. feet
|
- baths - beds |
show details | |

|
#39
E High St
Hennepin, IL 61327
|
- sq. feet
|
- baths - beds |
show details | |

|
#40
Dalzell St
Spring Valley, IL 61362
|
- sq. feet
|
- baths - beds |
show details |
| Photo | Address | Area | Beds / Baths | Price | Details |
|---|---|---|---|---|---|

|
#41
Rock Island St
Spring Valley, IL 61362
|
- sq. feet
|
- baths - beds |
show details | |

|
#42
Pombrook Dr
Princeton, IL 61356
|
- sq. feet
|
- baths - beds |
show details | |

|
#43
1500 North Ave
Princeton, IL 61356
|
- sq. feet
|
- baths - beds |
show details | |

|
#44
N Chestnut St
Princeton, IL 61356
|
- sq. feet
|
- baths - beds |
show details | |

|
#45
E Mulberry St
Hennepin, IL 61327
|
- sq. feet
|
- baths - beds |
show details | |

|
#46
Malibu Dr
Putnam, IL 61560
|
- sq. feet
|
- baths - beds |
show details | |

|
#47
S Mason St
Sheffield, IL 61361
|
- sq. feet
|
- baths - beds |
show details | |

|
Check over 1 million property listings on Foreclosure.com!
|
browse all offers | |||

Latest news about housing in Tiskilwa, IL collected exclusively by city-data.com from local newspapers, TV, and radio stations


Median year apartment built: 1955
Household type by relationship:
Households: 735- Male householders: 150 (33 living alone), Female householders: 155 (58 living alone)
141 spouses (139 opposite-sex spouses), 31 unmarried partners, (31 opposite-sex unmarried partners), 223 children (206 natural, 0 adopted, 17 stepchildren), 24 grandchildren, 0 brothers or sisters, 7 parents, 0 foster children, 0 other relatives, 0 non-relatives
Size of family households: 100 2-persons, 40 3-persons, 32 4-persons, 16 5-persons, 13 6-persons.
Size of nonfamily households: 96 1-person, 16 2-persons.
96 married couples with children.
49 single-parent households (28 men, 21 women).
93.9% of residents of Tiskilwa speak English at home.
0.1% of residents speak Spanish at home (100% speak English very well).
0.3% of residents speak other Indo-European language at home (100% speak English well).
5.3% of residents speak Asian or Pacific Island language at home (84% speak English very well, 16% speak English not well).
Foreign born population: 22 (3.0%)
(31.8% of them are naturalized citizens)
| Here: | 7.3 |
| State: | 6.4 |
| Here: | 5.8 |
| State: | 4.1 |

- Bedrooms in owner-occupied houses and condos in Tiskilwa, Illinois
- 0no bedroom
- 151 bedroom
- 442 bedrooms
- 1083 bedrooms
- 584 bedrooms
- 115+ bedrooms

- Bedrooms in renter-occupied apartments in Tiskilwa, Illinois
- 0no bedroom
- 61 bedroom
- 262 bedrooms
- 443 bedrooms
- 44 bedrooms
- 05+ bedrooms

- Cars and other vehicles available in Tiskilwa in owner-occupied houses/condos
- 15no vehicle
- 631 vehicle
- 932 vehicles
- 263 vehicles
- 274 vehicles
- 115+ vehicles

- Cars and other vehicles available in Tiskilwa in renter-occupied apartments
- 0no vehicle
- 531 vehicle
- 232 vehicles
- 43 vehicles
- 04 vehicles
- 05+ vehicles

- Rooms in owner-occupied houses in Tiskilwa, Illinois
- 01 room
- 02 rooms
- 03 rooms
- 104 rooms
- 425 rooms
- 416 rooms
- 327 rooms
- 588 rooms
- 549+ rooms

- Rooms in renter-occupied apartments in Tiskilwa, Illinois
- 01 room
- 22 rooms
- 03 rooms
- 204 rooms
- 95 rooms
- 196 rooms
- 187 rooms
- 68 rooms
- 59+ rooms


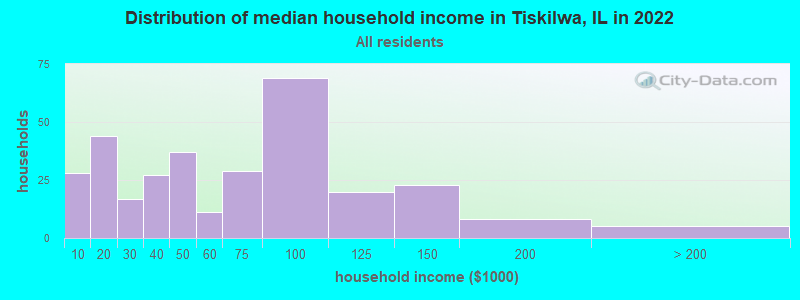
Tiskilwa, IL household income distribution

- 28Less than $10,000
- 44$10,000 to $19,999
- 17$20,000 to $29,999
- 27$30,000 to $39,999
- 37$40,000 to $49,999
- 11$50,000 to $59,999
- 29$60,000 to $74,999
- 69$75,000 to $99,999
- 20$100,000 to $124,999
- 23$125,000 to $149,999
- 8$150,000 to $199,999
- 5$200,000 or more
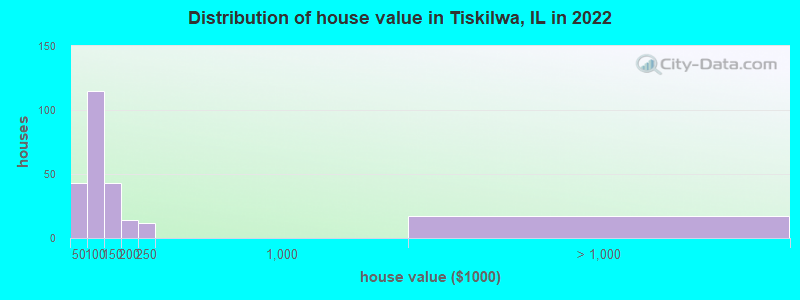
Home value of owner - occupied houses in 2022 in Tiskilwa, IL
-
- 22$10,000 to $14,999
- 1$30,000 to $34,999
- 4$35,000 to $39,999
- 14$40,000 to $49,999
- 19$50,000 to $59,999
- 26$60,000 to $69,999
- 3$70,000 to $79,999
- 39$80,000 to $89,999
- 12$90,000 to $99,999
- 31$100,000 to $124,999
- 11$125,000 to $149,999
- 7$150,000 to $174,999
- 7$175,000 to $199,999
- 11$200,000 to $249,999
- 16$2,000,000 or more
Rent paid by renters in 2022 in Tiskilwa, IL
-
- 4$200 to $249
- 2$400 to $449
- 9$450 to $499
- 2$500 to $549
- 16$550 to $599
- 4$600 to $649
- 5$650 to $699
- 10$700 to $749
- 2$1,000 to $1,249
- 15No cash rent

Percentage of workers working in this county: 70.1%
Number of people working at home: 15 (4.5% of all workers)
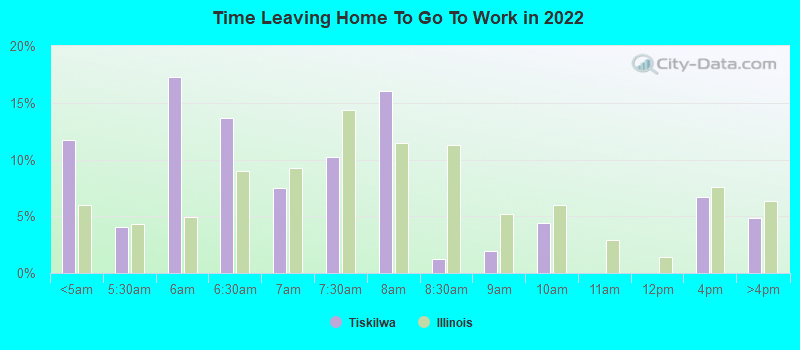
Travel time to work (commute)
- Less than 5 minutes: 8
- 5 to 9 minutes: 4
- 10 to 14 minutes: 22
- 15 to 19 minutes: 102
- 20 to 24 minutes: 59
- 25 to 29 minutes: 13
- 30 to 34 minutes: 58
- 35 to 39 minutes: 0
- 40 to 44 minutes: 9
- 45 to 59 minutes: 15
- 60 to 89 minutes: 15
- 90 or more minutes: 0
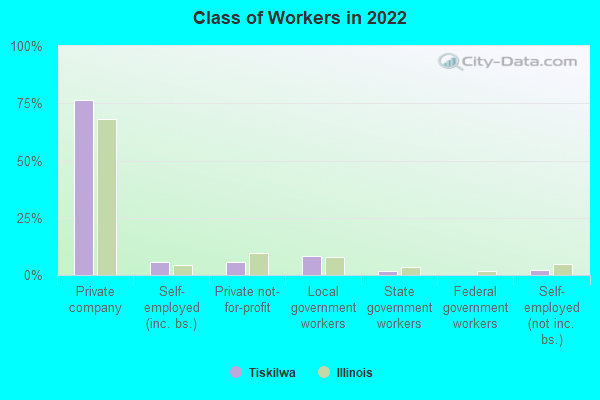
Means of transportation to work:
- Drove a car alone: 326 (87.9%)
- Carpooled: 26 (7.0%)
- Walked: 7 (1.9%)
- Other means: 6 (1.6%)
- Worked at home: 6 (1.6%)
- Unemployment by race in 2022
- Unemployment rate for White non-Hispanic residents
- 4.8%Males
- Unemployment rate for two or more race residents
- 31.0%Females
- Unemployment rate for Hispanic or Latino residents
- 15.4%Females

- Year of entry for the foreign-born population in Tiskilwa, Illinois
- 02010 or later
- 52000 to 2009
- 141990 to 1999
- 01980 to 1989
- 51970 to 1979
- 2Before 1970

First ancestries reported:
- German: 80 (35.4%)
- American: 40 (17.7%)
- English: 17 (7.5%)
- Irish: 15 (6.6%)
- Swedish: 7 (3.1%)
- Scottish: 5 (2.2%)
- Greek: 3 (1.3%)
- Croatian: 2 (0.9%)
- French: 1 (0.4%)
- Pennsylvania German: 1 (0.4%)
Most common places of birth for foreign-born residents (%):
| Tiskilwa: | 40.9% (9) |
| Illinois: | 0.1% (1,780) |
| Tiskilwa: | 27.3% (6) |
| Illinois: | 4.1% (74,364) |
| Tiskilwa: | 22.7% (5) |
| Illinois: | 1.2% (22,269) |
Place of birth for U.S.-born residents:
- This state: 642
- Other state: 67
- Northeast: 21
- Midwest: 26
- South: 9
- West: 11
93.8% of Tiskilwa residents lived in the same house 1 years ago.
Out of people who lived in different houses, 45.1% lived in this county.
Out of people who lived in different counties, 100.0% lived in Illinois.
| Tiskilwa: | 93.8% |
| State average: | 88.3% |
Education attainment for males 25 years and older:
- No schooling: 0
- Nursery to 4th grade: 0
- 5th and 6th grade: 0
- 7th and 8th grade: 7
- 9th grade: 1
- 10th grade: 0
- 11th grade: 3
- 12th grade, no diploma: 0
- High school graduate (or equivalency): 83
- Less than 1 year of college: 29
- Some college more than 1 year, no degree: 40
- Associate degree: 27
- Bachelor's degree: 26
- Master's degree: 7
- Professional school degree: 0
- Doctorate degree: 0

Education attainment for females 25 years and older:
- No schooling: 3
- Nursery to 4th grade: 0
- 5th and 6th grade: 0
- 7th and 8th grade: 5
- 9th grade: 0
- 10th grade: 4
- 11th grade: 1
- 12th grade, no diploma: 8
- High school graduate (or equivalency): 106
- Less than 1 year of college: 23
- Some college more than 1 year, no degree: 18
- Associate degree: 31
- Bachelor's degree: 21
- Master's degree: 22
- Professional school degree: 3
- Doctorate degree: 0


Housing units in structures:
- One, detached: 300
- One, attached: 4
- Two: 21
- 3 or 4: 17
- 10 to 19: 3
- 50 or more: 2
- Mobile homes: 6
House/condo owner moved in on average 16 years ago
Renter moved in on average 6 years ago

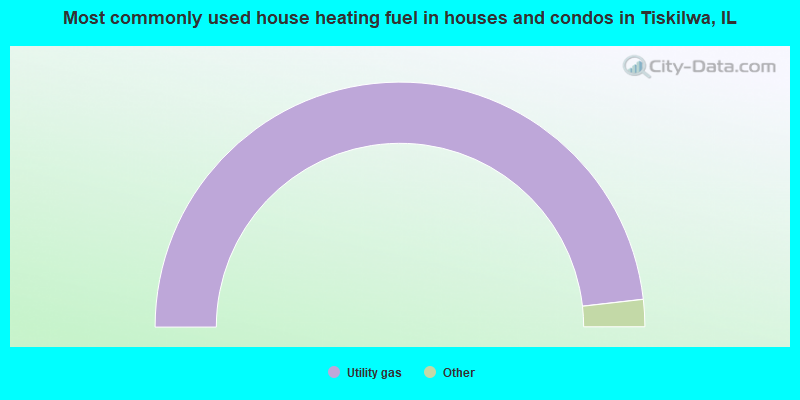
- 96.6%Utility gas
- 2.6%Electricity
- 0.9%Bottled, tank, or LP gas
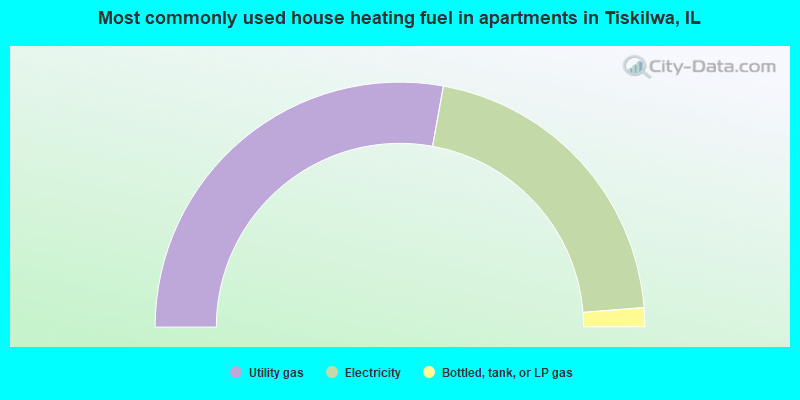
- 55.7%Utility gas
- 41.8%Electricity
- 2.5%Bottled, tank, or LP gas
Private vs. public school enrollment:
| Here: | 3.8% |
| Illinois: | 13.3% |
| Here: | 17.2% |
| Illinois: | 9.9% |
| Here: | 10.7% |
| Illinois: | 27.4% |


