Town 'n' Country, FL (Florida) Houses and Residents
Estimated median house or condo value in 2022: $317,100 (it was $85,400 in 2000 )
Town 'n' Country:
$317,100Florida:
$354,100
Lower value quartile - upper value quartile: $210,600 - $455,500Mean price in 2022: Detached houses: $416,042 Here:
$416,042State:
$500,941
Townhouses or other attached units: $235,114 Here:
$235,114State:
$370,869
In 2-unit structures: $233,449 Here:
$233,449State:
$423,188
In 3-to-4-unit structures: $176,803 Here:
$176,803State:
$309,944
In 5-or-more-unit structures: $212,854 Here:
$212,854State:
$447,145
Mobile homes: $73,647 Here:
$73,647State:
$113,202
Occupied boats, RVs, vans, etc.: $66,793 Here:
$66,793State:
$73,933
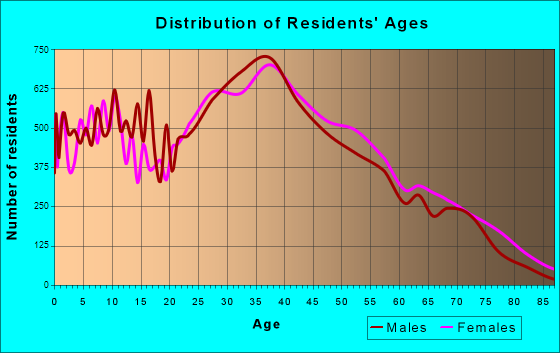
Total population: 78,442 (Urban population: 72,397, Rural population: 0)
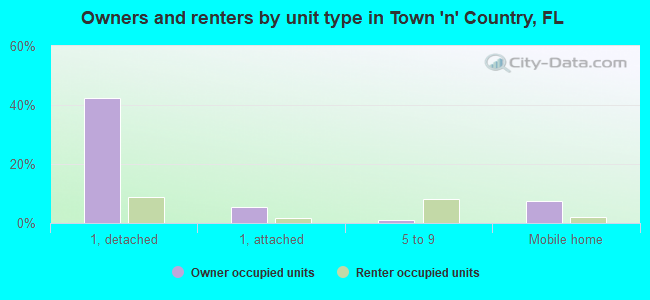
Houses: 34,103 (32,132 occupied: 19,445 owner occupied, 12,687 renter occupied )
% of renters here:
39%State:
33%
Housing density: 1,441 houses/condos per square mile
Median price asked for vacant for-sale houses and condos in 2022: $130,873.
Median contract rent in 2022: $1,466 (lower quartile is $1,157, upper quartile is $1,824)
Median rent asked for vacant for-rent units in 2022: $1,523
Median gross rent in Town 'n' Country, FL in 2022: $1,602
Housing units in Town 'n' Country with a mortgage: 11,582 (1,402 second mortgage, 199 home equity loan, 952 both second mortgage and home equity loan )Houses without a mortgage: 91
Median household income for houses/condos with a mortgage: $77,205
Median household income for apartments without a mortgage: $59,891
Median monthly housing costs: $1,414
Data:
Median house or condo value ($)
Median house or condo value ($ change since 2000)
Median house or condo value ($) - White
Median house or condo value ($) - Black or African American
Median house or condo value ($) - Asian
Median house or condo value ($) - Hispanic or Latino
Median house or condo value ($) - American Indian and Alaska Native
Median house or condo value ($) - Multirace
Median house or condo value ($) - Other Race
Median price asked for mobile homes ($)
Household density (households per square mile)
Mean house or condo value by units in structure - 1, detached ($)
Mean house or condo value by units in structure - 1, attached ($)
Mean house or condo value by units in structure - 2 ($)
Mean house or condo value by units in structure by units in structure - 3 or 4 ($)
Mean house or condo value by units in structure - 5 or more ($)
Mean house or condo value by units in structure - Boat, RV, van, etc. ($)
Mean house or condo value by units in structure - Mobile home ($)
Median contract rent ($)
Median contract rent - Lower quartile ($)
Median contract rent - Upper quartile ($)
Median gross rent ($)
Urban houses (%)
Rural houses (%)
Houses occupied (%)
Houses occupied (% change since 2000)
Houses owner occupied (%)
Houses owner occupied (% change since 2000)
Houses renter occupied (%)
Houses renter occupied (% change since 2000)
Vacant housing units - For rent (%)
Vacant housing units - For rent (% change since 2000)
Vacant housing units - For sale only (%)
Vacant housing units - For sale only (% change since 2000)
Vacant housing units - Rented or sold, not occupied (%)
Vacant housing units - Rented or sold, not occupied (% change since 2000)
Vacant housing units - For seasonal, recreational, or occasional use (%)
Vacant housing units - For seasonal, recreational, or occasional use (% change since 2000)
Vacant housing units - For migrant workers (%)
Vacant housing units - For migrant workers (% change since 2000)
Vacant housing units - Other vacant (%)
Vacant housing units - Other vacant (% change since 2000)
Median monthly housing costs ($)
Median household income for houses/condos with a mortgage ($)
Median household income for houses/condos without a mortgage ($)
Median household income ($)
Median household income ($) - White
Median household income ($) - Black or African American
Median household income ($) - Asian
Median household income ($) - Hispanic or Latino
Median household income ($) - American Indian and Alaska Native
Median household income ($) - Multirace
Median household income ($) - Other Race
Mortgage status - with mortgage (%)
Mortgage status - with second mortgage (%)
Mortgage status - with home equity loan (%)
Mortgage status - with both second mortgage and home equity loan (%)
Mortgage status - without a mortgage (%)
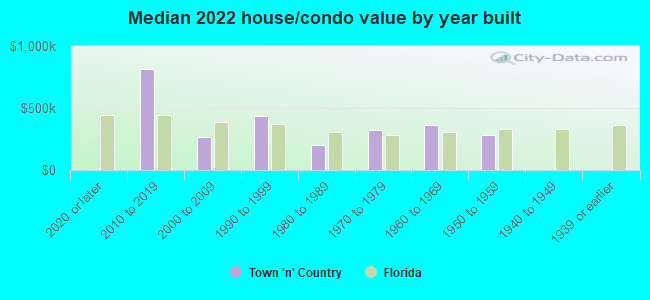
Median year house/condo built
Median year apartment built
Household type by relationship - Male householder living alone (%)
Household type by relationship - Male householder not living alone (%)
Household type by relationship - Female householder living alone (%)
Household type by relationship - Female householder not living alone (%)
Household type by relationship - Opposite-Sex spouse (%)
Household type by relationship - Same-Sex spouse (%)
Household type by relationship - Opposite-Sex unmarried partner (%)
Household type by relationship - Same-Sex unmarried partner (%)
Household type by relationship - In group quarters (%)
Size of family households - 2-person household (%)
Size of family households - 3-person household (%)
Size of family households - 4-person household (%)
Size of family households - 5-person household (%)
Size of family households - 6-person household (%)
Size of family households - 7-or-more-person household (%)
Size of nonfamily households - 1-person household (%)
Size of nonfamily households - 2-person household (%)
Size of nonfamily households - 3-person household (%)
Size of nonfamily households - 4-person household (%)
Size of nonfamily households - 5-person household (%)
Size of nonfamily households - 6-person household (%)
Size of nonfamily households - 7-or-moreperson household (%)
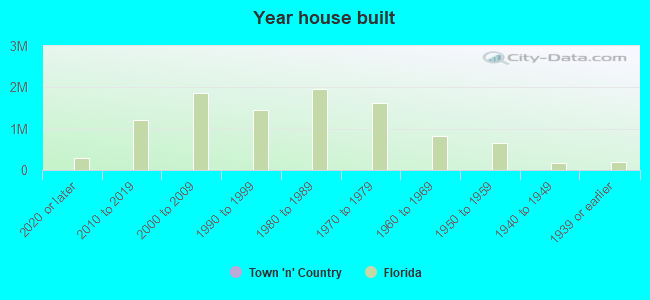
Year house built - Built 2010 or later (%)
Year house built - Built 2000 to 2009 (%)
Year house built - Built 1990 to 1999 (%)
Year house built - Built 1980 to 1989 (%)
Year house built - Built 1970 to 1979 (%)
Year house built - Built 1960 to 1969 (%)
Year house built - Built 1950 to 1959 (%)
Year house built - Built 1940 to 1949 (%)
Year house built - Built 1939 or earlier (%)
Median number of rooms in houses and condos
Median number of rooms in apartments
Median number of bedrooms in owner occupied houses
Mean number of bedrooms in owner occupied houses
Median number of bedrooms in renter occupied houses
Mean number of bedrooms in renter occupied houses
Median number of vehichles in owner occupied houses
Mean number of vehichles in owner occupied houses
Median number of vehichles in renter occupied houses
Mean number of vehichles in renter occupied houses
Rooms in owner-occupied houses - 1 room (%)
Rooms in owner-occupied houses - 2 rooms (%)
Rooms in owner-occupied houses - 3 rooms (%)
Rooms in owner-occupied houses - 4 rooms (%)
Rooms in owner-occupied houses - 5 rooms (%)
Rooms in owner-occupied houses - 6 rooms (%)
Rooms in owner-occupied houses - 7 rooms (%)
Rooms in owner-occupied houses - 8 rooms (%)
Rooms in owner-occupied houses - 9+ rooms (%)
Rooms in renter-occupied houses - 1 room (%)
Rooms in renter-occupied houses - 2 rooms (%)
Rooms in renter-occupied houses - 3 rooms (%)
Rooms in renter-occupied houses - 4 rooms (%)
Rooms in renter-occupied houses - 5 rooms (%)
Rooms in renter-occupied houses - 6 rooms (%)
Rooms in renter-occupied houses - 7 rooms (%)
Rooms in renter-occupied houses - 8 rooms (%)
Rooms in renter-occupied houses - 9+ rooms (%)
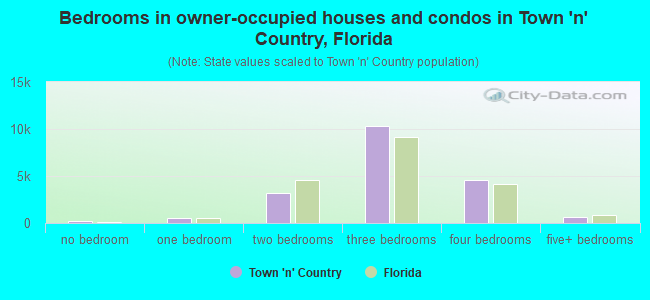
Bedrooms in owner-occupied houses - no bedrooms (%)
Bedrooms in owner-occupied houses - 1 bedroom (%)
Bedrooms in owner-occupied houses - 2 bedrooms (%)
Bedrooms in owner-occupied houses - 3 bedrooms (%)
Bedrooms in owner-occupied houses - 4 bedrooms (%)
Bedrooms in owner-occupied houses - 5+ bedrooms (%)
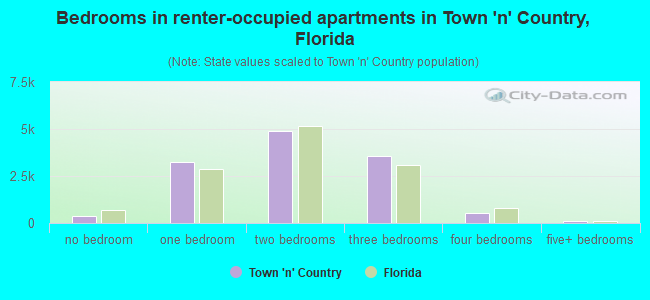
Bedrooms in renter-occupied houses - no bedrooms (%)
Bedrooms in renter-occupied houses - 1 bedroom (%)
Bedrooms in renter-occupied houses - 2 bedrooms (%)
Bedrooms in renter-occupied houses - 3 bedrooms (%)
Bedrooms in renter-occupied houses - 4 bedrooms (%)
Bedrooms in renter-occupied houses - 5+ bedrooms (%)
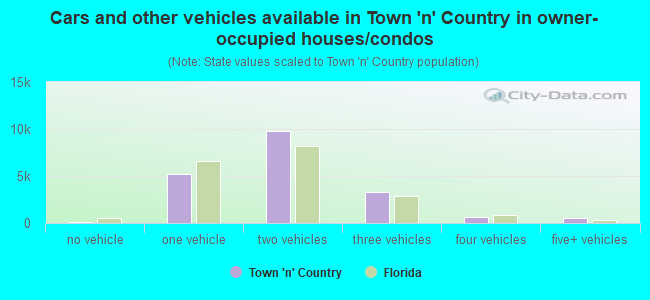
Vehicles available in owner-occupied houses - no vehicle available (%)
Vehicles available in owner-occupied houses - 1 vehicle available(%)
Vehicles available in owner-occupied houses - 2 Vehicles available (%)
Vehicles available in owner-occupied houses - 3 Vehicles available (%)
Vehicles available in owner-occupied houses - 4 Vehicles available (%)
Vehicles available in owner-occupied houses - 5+ Vehicles available (%)
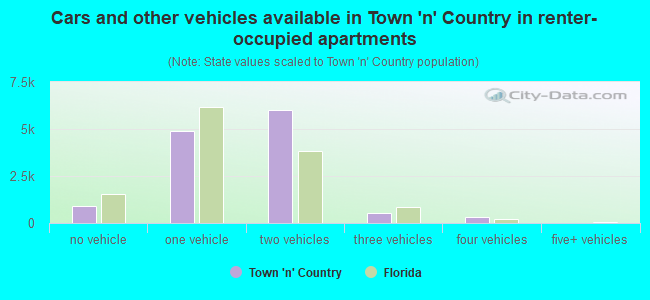
Vehicles available in renter-occupied houses - no vehicle available (%)
Vehicles available in renter-occupied houses - 1 vehicle available (%)
Vehicles available in renter-occupied houses - 2 Vehicles available (%)
Vehicles available in renter-occupied houses - 3 Vehicles available (%)
Vehicles available in renter-occupied houses - 4 Vehicles available (%)
Vehicles available in renter-occupied houses - 5+ Vehicles available (%)
Housing units in structures - 1, detached (%)
Housing units in structures - 1, attached (%)
Housing units in structures - 2 (%)
Housing units in structures - 3 or 4 (%)
Housing units in structures - 5 to 9 (%)
Housing units in structures - 10 to 19 (%)
Housing units in structures - 20 to 49 (%)
Housing units in structures - 50 or more (%)
Housing units in structures - Mobile home (%)
Housing units in structures - Boat, RV, van, etc. (%)
Housing units in structures - Owners - 1, detached (%)
Housing units in structures - Owners - 1, attached (%)
Housing units in structures - Owners - 2 (%)
Housing units in structures - Owners - 3 or 4 (%)
Housing units in structures - Owners - 5 to 9 (%)
Housing units in structures - Owners - 10 to 19 (%)
Housing units in structures - Owners - 20 to 49 (%)
Housing units in structures - Owners - 50 or more (%)
Housing units in structures - Owners - Mobile home (%)
Housing units in structures - Owners - Boat, RV, van, etc. (%)
Housing units in structures - Renters - 1, detached (%)
Housing units in structures - Renters - 1, attached (%)
Housing units in structures - Renters - 2 (%)
Housing units in structures - Renters - 3 or 4 (%)
Housing units in structures - Renters - 5 to 9 (%)
Housing units in structures - Renters - 10 to 19 (%)
Housing units in structures - Renters - 20 to 49 (%)
Housing units in structures - Renters - 50 or more (%)
Housing units in structures - Renters - Mobile home (%)
Housing units in structures - Renters - Boat, RV, van, etc. (%)
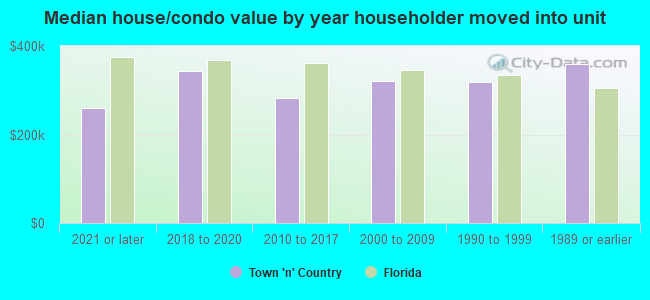
House/condo owner moved in on average (years ago)
Renter moved in on average (years ago)
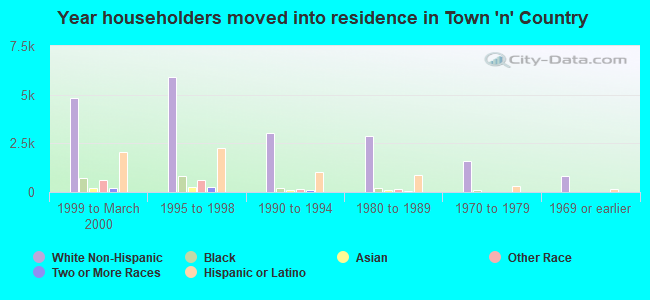
Year householder moved into unit - Moved in 1999 to March 2000 (%)
Year householder moved into unit - Moved in 1999 to March 2000 (%) - White
Year householder moved into unit - Moved in 1999 to March 2000 (%) - Black or African American
Year householder moved into unit - Moved in 1999 to March 2000 (%) - Asian
Year householder moved into unit - Moved in 1999 to March 2000 (%) - Hispanic or Latino
Year householder moved into unit - Moved in 1999 to March 2000 (%) - American Indian and Alaska Native
Year householder moved into unit - Moved in 1999 to March 2000 (%) - Multirace
Year householder moved into unit - Moved in 1999 to March 2000 (%) - Other Race
Year householder moved into unit - Moved in 1995 to 1998 (%)
Year householder moved into unit - Moved in 1995 to 1998 (%) - White
Year householder moved into unit - Moved in 1995 to 1998 (%) - Black or African American
Year householder moved into unit - Moved in 1995 to 1998 (%) - Asian
Year householder moved into unit - Moved in 1995 to 1998 (%) - Hispanic or Latino
Year householder moved into unit - Moved in 1995 to 1998 (%) - American Indian and Alaska Native
Year householder moved into unit - Moved in 1995 to 1998 (%) - Multirace
Year householder moved into unit - Moved in 1995 to 1998 (%) - Other Race
Year householder moved into unit - Moved in 1990 to 1994 (%)
Year householder moved into unit - Moved in 1990 to 1994 (%) - White
Year householder moved into unit - Moved in 1990 to 1994 (%) - Black or African American
Year householder moved into unit - Moved in 1990 to 1994 (%) - Asian
Year householder moved into unit - Moved in 1990 to 1994 (%) - Hispanic or Latino
Year householder moved into unit - Moved in 1990 to 1994 (%) - American Indian and Alaska Native
Year householder moved into unit - Moved in 1990 to 1994 (%) - Multirace
Year householder moved into unit - Moved in 1990 to 1994 (%) - Other Race
Year householder moved into unit - Moved in 1980 to 1989 (%)
Year householder moved into unit - Moved in 1980 to 1989 (%) - White
Year householder moved into unit - Moved in 1980 to 1989 (%) - Black or African American
Year householder moved into unit - Moved in 1980 to 1989 (%) - Asian
Year householder moved into unit - Moved in 1980 to 1989 (%) - Hispanic or Latino
Year householder moved into unit - Moved in 1980 to 1989 (%) - American Indian and Alaska Native
Year householder moved into unit - Moved in 1980 to 1989 (%) - Multirace
Year householder moved into unit - Moved in 1980 to 1989 (%) - Other Race
Year householder moved into unit - Moved in 1970 to 1979 (%)
Year householder moved into unit - Moved in 1970 to 1979 (%) - White
Year householder moved into unit - Moved in 1970 to 1979 (%) - Black or African American
Year householder moved into unit - Moved in 1970 to 1979 (%) - Asian
Year householder moved into unit - Moved in 1970 to 1979 (%) - Hispanic or Latino
Year householder moved into unit - Moved in 1970 to 1979 (%) - American Indian and Alaska Native
Year householder moved into unit - Moved in 1970 to 1979 (%) - Multirace
Year householder moved into unit - Moved in 1970 to 1979 (%) - Other Race
Year householder moved into unit - Moved in 1969 or earlier (%)
Year householder moved into unit - Moved in 1969 or earlier (%) - White
Year householder moved into unit - Moved in 1969 or earlier (%) - Black or African American
Year householder moved into unit - Moved in 1969 or earlier (%) - Asian
Year householder moved into unit - Moved in 1969 or earlier (%) - Hispanic or Latino
Year householder moved into unit - Moved in 1969 or earlier (%) - American Indian and Alaska Native
Year householder moved into unit - Moved in 1969 or earlier (%) - Multirace
Year householder moved into unit - Moved in 1969 or earlier (%) - Other Race
Housing units lacking complete plumbing facilities (%)
Housing units lacking complete kitchen facilities (%)
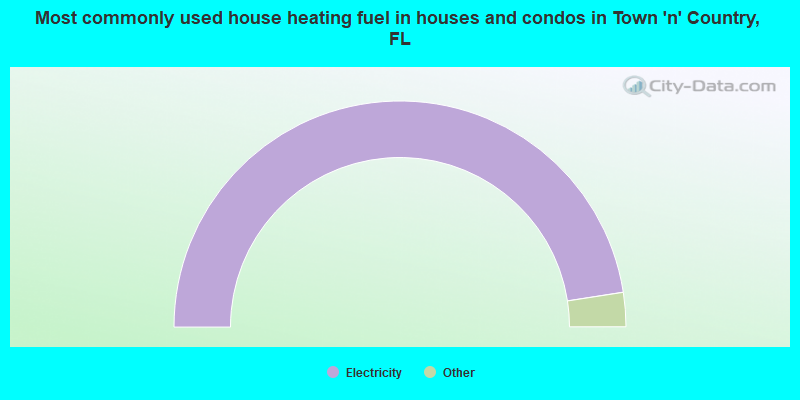
House heating fuel used in houses and condos - Utility gas (%)
House heating fuel used in houses and condos - Bottled, tank, or LP gas (%)
House heating fuel used in houses and condos - Electricity (%)
House heating fuel used in houses and condos - Fuel oil, kerosene, etc. (%)
House heating fuel used in houses and condos - Coal or coke (%)
House heating fuel used in houses and condos - Wood (%)
House heating fuel used in houses and condos - Solar energy (%)
House heating fuel used in houses and condos - Other fuel (%)
House heating fuel used in houses and condos - No fuel used (%)
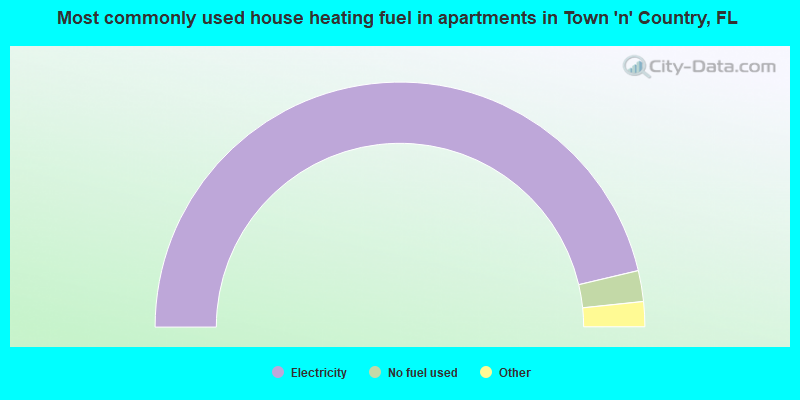
House heating fuel used in apartments - Utility gas (%)
House heating fuel used in apartments - Bottled, tank, or LP gas (%)
House heating fuel used in apartments - Electricity (%)
House heating fuel used in apartments - Fuel oil, kerosene, etc. (%)
House heating fuel used in apartments - Coal or coke (%)
House heating fuel used in apartments - Wood (%)
House heating fuel used in apartments - Solar energy (%)
House heating fuel used in apartments - Other fuel (%)
House heating fuel used in apartments - No fuel used (%)
Median year house/condo built: 1982Median year apartment built: 1983Household type by relationship:
Households: 87,521
Male householders: 17,239 (3,751 living alone ), Female householders: 14,893 (3,282 living alone )13,673 spouses (13,673 opposite-sex spouses ), 4,723 unmarried partners , (4,398 opposite-sex unmarried partners ), 22,468 children (19,398 natural , 578 adopted , 2,492 stepchildren ), 1,661 grandchildren , 2,241 brothers or sisters , 2,615 parents , 0 foster children , 2,735 other relatives , 4,868 non-relatives In group quarters: 405
Size of family households: 7,819 2-persons , 6,151 3-persons , 5,830 4-persons , 1,394 5-persons , 988 6-persons , 154 7-or-more-persons .
Size of nonfamily households: 7,033 1-person , 1,966 2-persons , 307 3-persons , 304 4-persons , 186 5-persons .
10,515 married couples with children. single-parent households (2,009 men , 2,761 women ).
45.8% of residents of Town 'n' Country speak English at home. of residents speak Spanish at home (43% speak English very well , 20% speak English well , 22% speak English not well , 14% don't speak English at all ).of residents speak other Indo-European language at home (70% speak English very well , 16% speak English well , 13% speak English not well , 1% don't speak English at all ).of residents speak Asian or Pacific Island language at home (59% speak English very well , 24% speak English well , 14% speak English not well , 4% don't speak English at all ).of residents speak other language at home (62% speak English very well , 26% speak English well , 8% speak English not well , 4% don't speak English at all ).
Foreign born population: 33,866 (38.7%)of them are naturalized citizens )
Median number of rooms in houses and condos:
Median number of rooms in apartments
Owner-occupied Renter-occupied
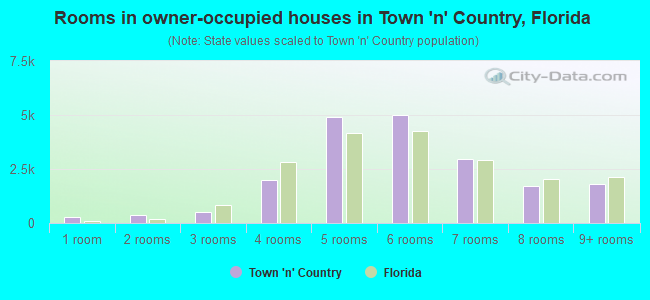
Rooms in owner-occupied houses in Town 'n' Country, Florida
263 1 room 361 2 rooms 512 3 rooms 1,983 4 rooms 4,902 5 rooms 4,983 6 rooms 2,951 7 rooms 1,704 8 rooms 1,786 9+ rooms
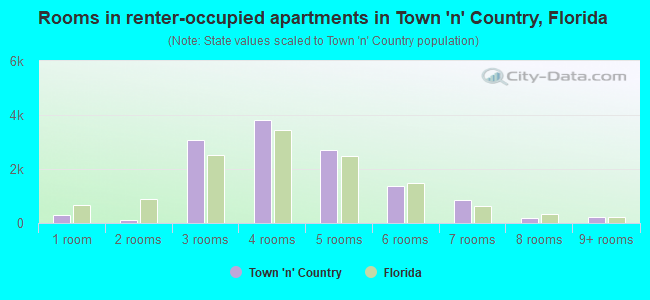
Rooms in renter-occupied apartments in Town 'n' Country, Florida
312 1 room 93 2 rooms 3,084 3 rooms 3,829 4 rooms 2,710 5 rooms 1,366 6 rooms 866 7 rooms 194 8 rooms 233 9+ rooms
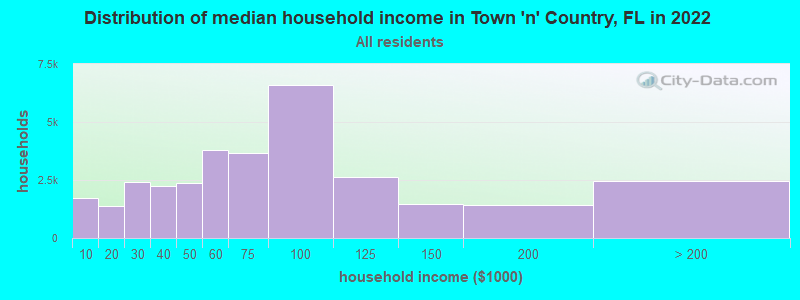
Town 'n' Country, FL household income distribution 1,714 Less than $10,0001,362 $10,000 to $19,9992,419 $20,000 to $29,9992,252 $30,000 to $39,9992,353 $40,000 to $49,9993,813 $50,000 to $59,9993,646 $60,000 to $74,9996,589 $75,000 to $99,9992,610 $100,000 to $124,9991,468 $125,000 to $149,9991,442 $150,000 to $199,9992,464 $200,000 or more
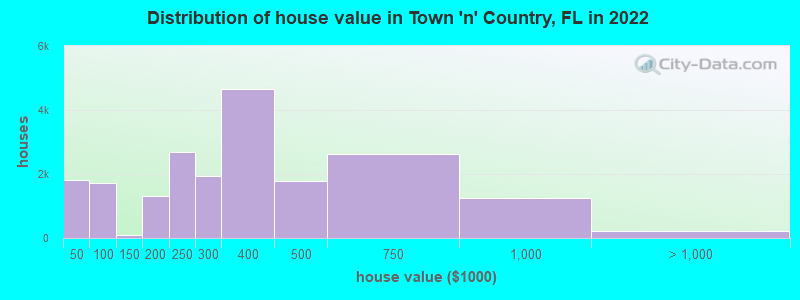
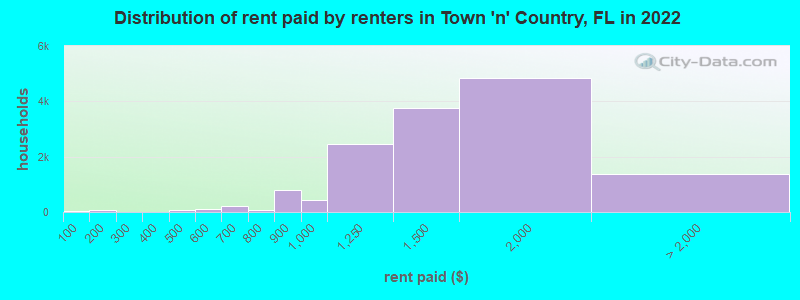
Home value of owner - occupied houses in 2022 in Town 'n' Country, FL 258 Less than $10,00028 $15,000 to $19,999335 $25,000 to $29,999515 $30,000 to $34,999664 $40,000 to $49,99976 $50,000 to $59,999590 $70,000 to $79,99974 $80,000 to $89,999323 $90,000 to $99,999106 $100,000 to $124,999461 $150,000 to $174,999862 $175,000 to $199,9992,688 $200,000 to $249,9991,946 $250,000 to $299,9994,670 $300,000 to $399,9991,781 $400,000 to $499,9992,613 $500,000 to $749,9991,247 $750,000 to $999,999101 $1,000,000 to $1,499,99983 $1,500,000 to $1,999,99924 $2,000,000 or moreRent paid by renters in 2022 in Town 'n' Country, FL 52 Less than $10064 $150 to $19914 $250 to $29984 $400 to $449105 $500 to $54916 $550 to $59950 $600 to $649161 $650 to $69956 $700 to $74933 $750 to $799808 $800 to $899428 $900 to $9992,473 $1,000 to $1,2493,757 $1,250 to $1,4994,835 $1,500 to $1,999701 $2,000 to $2,49981 $2,500 to $2,99914 $3,000 to $3,499114 $3,500 or more458 No cash rent
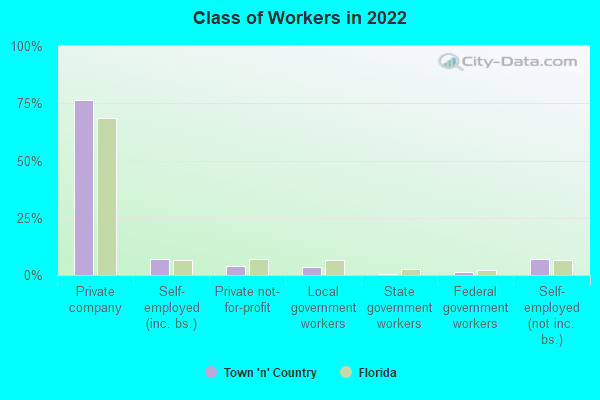
Percentage of workers working in this county: 84.2%Number of people working at home: 9,455 (18.7% of all workers )
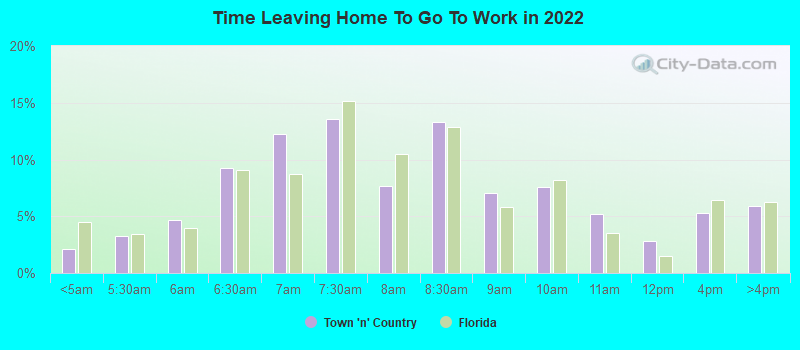
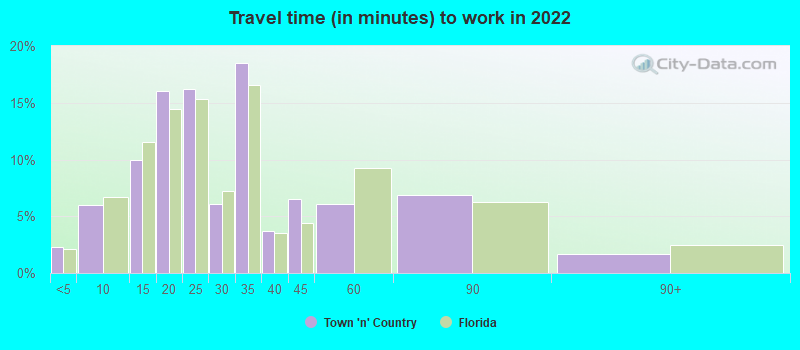
Travel time to work (commute)
Less than 5 minutes: 6545 to 9 minutes: 3,31310 to 14 minutes: 3,80615 to 19 minutes: 6,89320 to 24 minutes: 4,33225 to 29 minutes: 2,14030 to 34 minutes: 8,15535 to 39 minutes: 2,64540 to 44 minutes: 3,09645 to 59 minutes: 2,57760 to 89 minutes: 1,59590 or more minutes: 104
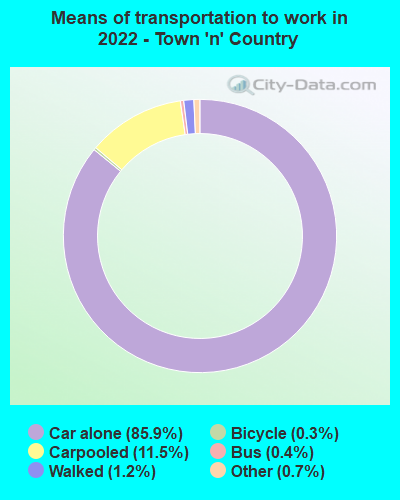
Means of transportation to work:
Drove a car alone: 28,945 (66.8%)Carpooled: 4,400 (10.2%)Bus : 96 (0.2%)Taxi: 261 (0.6%)Bicycle: 115 (0.3%)Walked: 388 (0.9%)Worked at home: 9,455 (21.8%)
Unemployment by race in 2022
Unemployment rate for White non-Hispanic residents 2.8% Males5.0% FemalesUnemployment rate for Black residents 10.1% Males4.7% FemalesUnemployment rate for Asian residents 13.8% Males3.8% FemalesUnemployment rate for other race residents 4.0% Males4.0% FemalesUnemployment rate for two or more race residents 3.6% Males9.2% FemalesUnemployment rate for Hispanic or Latino residents 5.0% Males6.8% Females
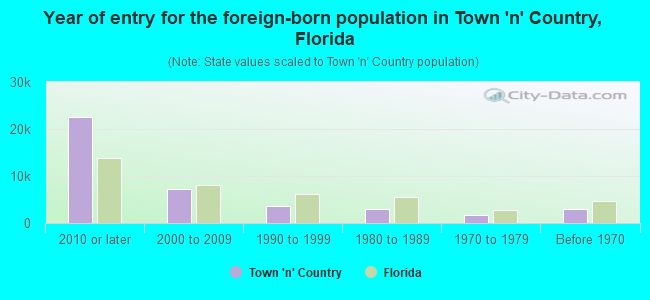
Year of entry for the foreign-born population in Town 'n' Country, Florida
22,556 2010 or later 7,292 2000 to 2009 3,532 1990 to 1999 3,072 1980 to 1989 1,717 1970 to 1979 3,028 Before 1970
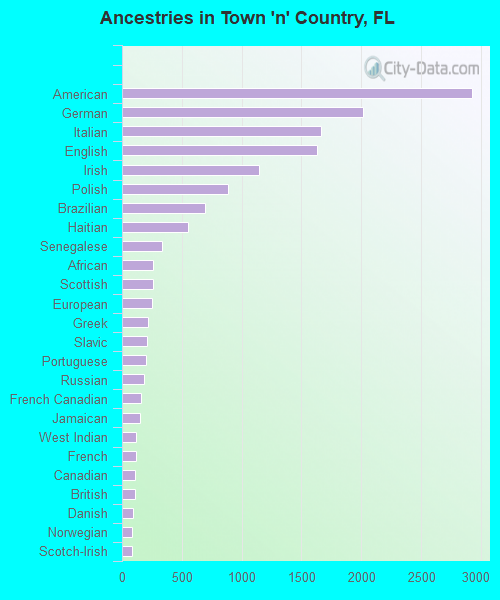
First ancestries reported:
American: 2,921 (5.3%)
German: 2,017 (3.7%)
Italian: 1,661 (3.0%)
English: 1,626 (3.0%)
Irish: 1,143 (2.1%)
Polish: 883 (1.6%)
Brazilian: 693 (1.3%)
Haitian: 553 (1.0%)
Senegalese: 333 (0.6%)
African: 263 (0.5%)
Scottish: 255 (0.5%)
European: 247 (0.4%)
Greek: 215 (0.4%)
Slavic: 213 (0.4%)
Portuguese: 199 (0.4%)
Russian: 188 (0.3%)
French Canadian: 162 (0.3%)
Jamaican: 152 (0.3%)
West Indian: 120 (0.2%)
French: 113 (0.2%)
Canadian: 112 (0.2%)
British: 112 (0.2%)
Danish: 89 (0.2%)
Norwegian: 87 (0.2%)
Scotch-Irish: 80 (0.1%)
Hungarian: 69 (0.1%)
Ukrainian: 67 (0.1%)
Palestinian: 66 (0.1%)
Croatian: 58 (0.1%)
Slovak: 55 (0.10%)
U.S. Virgin Islander: 50 (0.09%)
Cypriot: 46 (0.08%)
Estonian: 36 (0.07%)
Dutch: 35 (0.06%)
Romanian: 35 (0.06%)
Northern European: 31 (0.06%)
Arab: 27 (0.05%)
Lithuanian: 25 (0.05%)
Egyptian: 24 (0.04%)
Pennsylvania German: 24 (0.04%)
Albanian: 24 (0.04%)
Lebanese: 16 (0.03%)
Belgian: 15 (0.03%)
Dutch West Indian: 15 (0.03%)
Eastern European: 12 (0.02%)
Austrian: 11 (0.02%)
Bulgarian: 11 (0.02%)
Guyanese: 10 (0.02%)
Belizean: 9 (0.02%)
Basque: 8 (0.01%)
Welsh: 7 (0.01%)
Swedish: 6 (0.01%)
Most common places of birth for foreign-born residents (%): Cuba Town 'n' Country:
47.1% (16,153)Florida:
22.0% (1,006,576)
Venezuela Town 'n' Country:
9.5% (3,247)Florida:
5.7% (262,042)
Colombia Town 'n' Country:
8.5% (2,922)Florida:
6.5% (298,669)
India Town 'n' Country:
4.4% (1,496)Florida:
2.1% (94,349)
Dominican Republic Town 'n' Country:
4.3% (1,476)Florida:
3.0% (137,727)
Brazil Town 'n' Country:
3.0% (1,019)Florida:
2.7% (122,906)
Honduras Town 'n' Country:
2.0% (670)Florida:
2.3% (107,160)
Vietnam Town 'n' Country:
1.8% (634)Florida:
1.3% (60,604)
Mexico Town 'n' Country:
1.7% (573)Florida:
5.6% (257,152)
Place of birth for U.S.-born residents:
This state: 22,889Other state: 23,777Northeast: 11,079Midwest: 5,239South: 4,835West: 2,624 85.2% of Town 'n' Country residents lived in the same house 1 years ago.
Out of people who lived in different houses, 34.5% lived in this county.
Out of people who lived in different counties, 48.9% lived in Florida.
Town 'n' Country:
85.2%State average:
86.3%
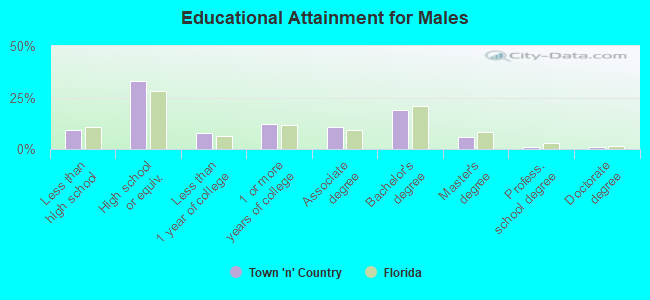
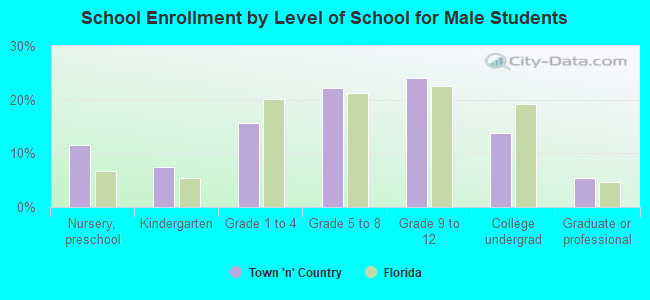
Education attainment for males 25 years and older:
No schooling: 383Nursery to 4th grade: 635th and 6th grade: 707th and 8th grade: 3079th grade: 50510th grade: 5811th grade: 37212th grade, no diploma: 1,019High school graduate (or equivalency): 9,790Less than 1 year of college: 2,339Some college more than 1 year, no degree: 3,538Associate degree: 3,200Bachelor's degree: 5,577Master's degree: 1,780Professional school degree: 248Doctorate degree: 329
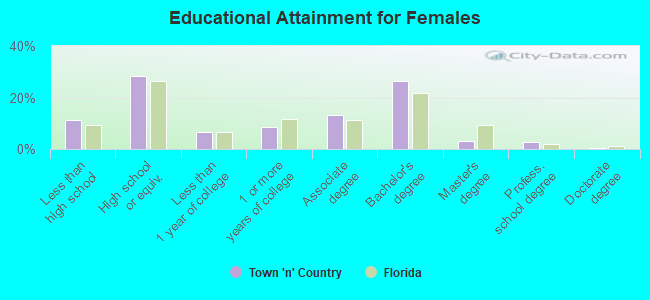
Education attainment for females 25 years and older:
No schooling: 657Nursery to 4th grade: 1805th and 6th grade: 3677th and 8th grade: 1009th grade: 68010th grade: 43911th grade: 012th grade, no diploma: 1,148High school graduate (or equivalency): 9,073Less than 1 year of college: 2,144Some college more than 1 year, no degree: 2,744Associate degree: 4,210Bachelor's degree: 8,453Master's degree: 1,002Professional school degree: 830Doctorate degree: 163
Housing units in structures:
One, detached: 17,092One, attached: 3,694Two: 2523 or 4: 1,6705 to 9: 2,81810 to 19: 2,21120 to 49: 1,40250 or more: 1,691Mobile homes: 3,273Median worth of mobile homes: $48,700
Housing units lacking complete plumbing facilities in 2022: 1.0%Housing units lacking complete kitchen facilities in 2022: 1.4%House/condo owner moved in on average 10 years ago
Renter moved in on average 2 years ago
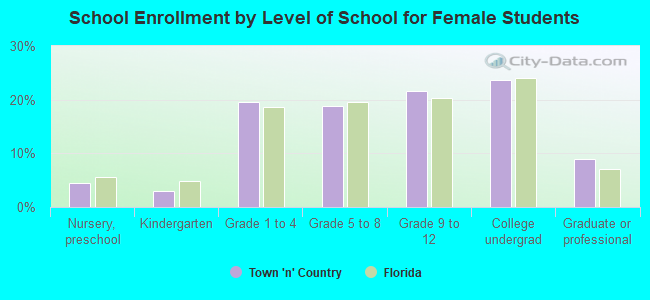
Private vs. public school enrollment:
Students in private schools in grades 1 to 8 (elementary and middle school): 760 Students in private schools in grades 9 to 12 (high school): 238 Students in private undergraduate colleges: 1,137