Towson, MD (Maryland) Houses and Residents
Estimated median house or condo value in 2022: $432,786 (it was $155,800 in 2000 )
Towson:
$432,786Maryland:
$398,100
Lower value quartile - upper value quartile: $311,773 - $637,684Mean price in 2022: Detached houses: $604,132 Here:
$604,132State:
$526,819
Townhouses or other attached units: $365,534 Here:
$365,534State:
$328,305
In 2-unit structures: $376,915 Here:
$376,915State:
$346,599
In 3-to-4-unit structures: $187,596 Here:
$187,596State:
$295,378
In 5-or-more-unit structures: $347,414 Here:
$347,414State:
$350,378
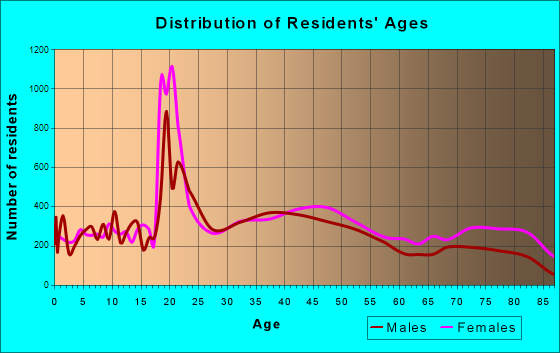
Total population: 55,197 (Urban population: 51,838, Rural population: 0)
Houses: 24,348 (22,536 occupied: 13,245 owner occupied, 9,792 renter occupied )
% of renters here:
43%State:
32%
Housing density: 1,734 houses/condos per square mile
Median price asked for vacant for-sale houses and condos in 2022: $715,986.
Median contract rent in 2022: $1,557 (lower quartile is $1,217, upper quartile is $1,905)
Median rent asked for vacant for-rent units in 2022: $1,365
Median gross rent in Towson, MD in 2022: $1,669
Housing units in Towson with a mortgage: 8,578 (1,189 second mortgage, 26 home equity loan, 1,036 both second mortgage and home equity loan )Houses without a mortgage: 198
Median household income for houses/condos with a mortgage: $159,320
Median household income for apartments without a mortgage: $101,377
Median monthly housing costs: $1,638
Data:
Median house or condo value ($)
Median house or condo value ($ change since 2000)
Median house or condo value ($) - White
Median house or condo value ($) - Black or African American
Median house or condo value ($) - Asian
Median house or condo value ($) - Hispanic or Latino
Median house or condo value ($) - American Indian and Alaska Native
Median house or condo value ($) - Multirace
Median house or condo value ($) - Other Race
Median price asked for mobile homes ($)
Household density (households per square mile)
Mean house or condo value by units in structure - 1, detached ($)
Mean house or condo value by units in structure - 1, attached ($)
Mean house or condo value by units in structure - 2 ($)
Mean house or condo value by units in structure by units in structure - 3 or 4 ($)
Mean house or condo value by units in structure - 5 or more ($)
Mean house or condo value by units in structure - Boat, RV, van, etc. ($)
Mean house or condo value by units in structure - Mobile home ($)
Median contract rent ($)
Median contract rent - Lower quartile ($)
Median contract rent - Upper quartile ($)
Median gross rent ($)
Urban houses (%)
Rural houses (%)
Houses occupied (%)
Houses occupied (% change since 2000)
Houses owner occupied (%)
Houses owner occupied (% change since 2000)
Houses renter occupied (%)
Houses renter occupied (% change since 2000)
Vacant housing units - For rent (%)
Vacant housing units - For rent (% change since 2000)
Vacant housing units - For sale only (%)
Vacant housing units - For sale only (% change since 2000)
Vacant housing units - Rented or sold, not occupied (%)
Vacant housing units - Rented or sold, not occupied (% change since 2000)
Vacant housing units - For seasonal, recreational, or occasional use (%)
Vacant housing units - For seasonal, recreational, or occasional use (% change since 2000)
Vacant housing units - For migrant workers (%)
Vacant housing units - For migrant workers (% change since 2000)
Vacant housing units - Other vacant (%)
Vacant housing units - Other vacant (% change since 2000)
Median monthly housing costs ($)
Median household income for houses/condos with a mortgage ($)
Median household income for houses/condos without a mortgage ($)
Median household income ($)
Median household income ($) - White
Median household income ($) - Black or African American
Median household income ($) - Asian
Median household income ($) - Hispanic or Latino
Median household income ($) - American Indian and Alaska Native
Median household income ($) - Multirace
Median household income ($) - Other Race
Mortgage status - with mortgage (%)
Mortgage status - with second mortgage (%)
Mortgage status - with home equity loan (%)
Mortgage status - with both second mortgage and home equity loan (%)
Mortgage status - without a mortgage (%)
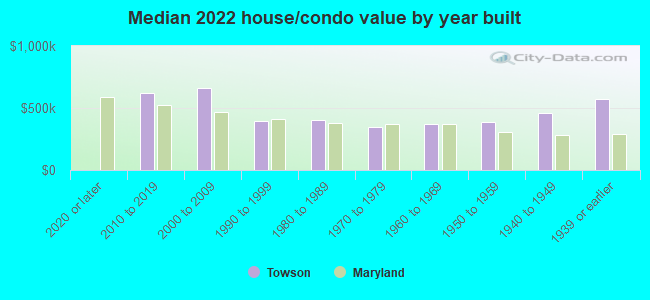
Median year house/condo built
Median year apartment built
Household type by relationship - Male householder living alone (%)
Household type by relationship - Male householder not living alone (%)
Household type by relationship - Female householder living alone (%)
Household type by relationship - Female householder not living alone (%)
Household type by relationship - Opposite-Sex spouse (%)
Household type by relationship - Same-Sex spouse (%)
Household type by relationship - Opposite-Sex unmarried partner (%)
Household type by relationship - Same-Sex unmarried partner (%)
Household type by relationship - In group quarters (%)
Size of family households - 2-person household (%)
Size of family households - 3-person household (%)
Size of family households - 4-person household (%)
Size of family households - 5-person household (%)
Size of family households - 6-person household (%)
Size of family households - 7-or-more-person household (%)
Size of nonfamily households - 1-person household (%)
Size of nonfamily households - 2-person household (%)
Size of nonfamily households - 3-person household (%)
Size of nonfamily households - 4-person household (%)
Size of nonfamily households - 5-person household (%)
Size of nonfamily households - 6-person household (%)
Size of nonfamily households - 7-or-moreperson household (%)
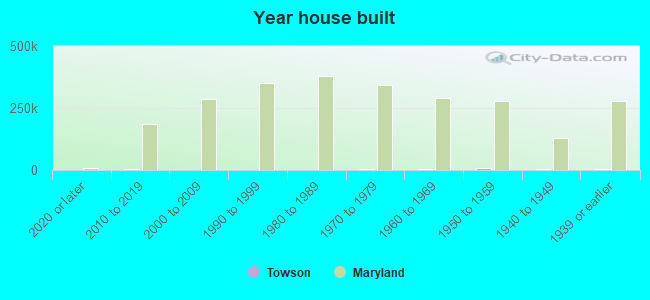
Year house built - Built 2010 or later (%)
Year house built - Built 2000 to 2009 (%)
Year house built - Built 1990 to 1999 (%)
Year house built - Built 1980 to 1989 (%)
Year house built - Built 1970 to 1979 (%)
Year house built - Built 1960 to 1969 (%)
Year house built - Built 1950 to 1959 (%)
Year house built - Built 1940 to 1949 (%)
Year house built - Built 1939 or earlier (%)
Median number of rooms in houses and condos
Median number of rooms in apartments
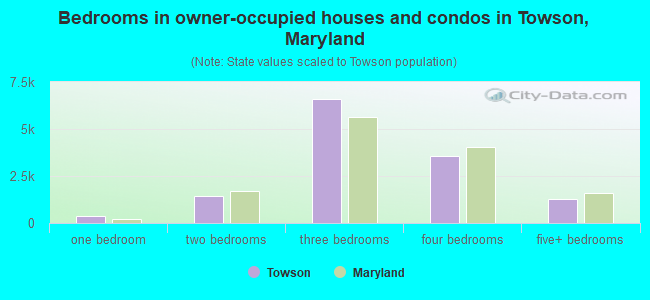
Median number of bedrooms in owner occupied houses
Mean number of bedrooms in owner occupied houses
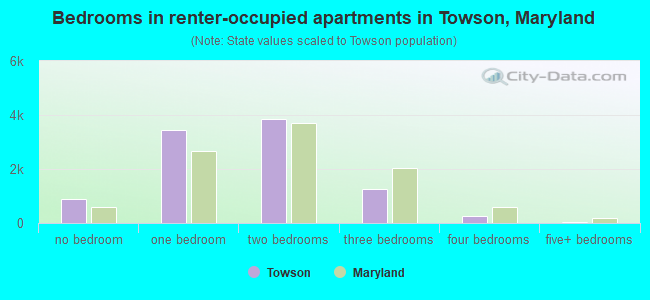
Median number of bedrooms in renter occupied houses
Mean number of bedrooms in renter occupied houses
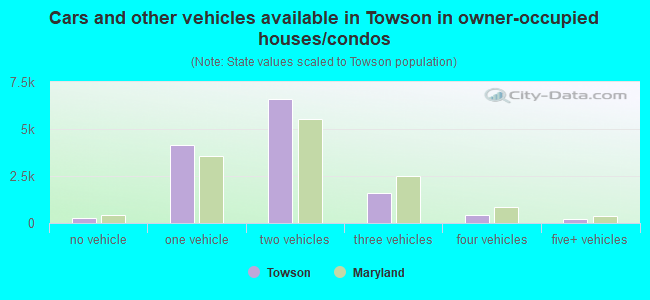
Median number of vehichles in owner occupied houses
Mean number of vehichles in owner occupied houses
Median number of vehichles in renter occupied houses
Mean number of vehichles in renter occupied houses
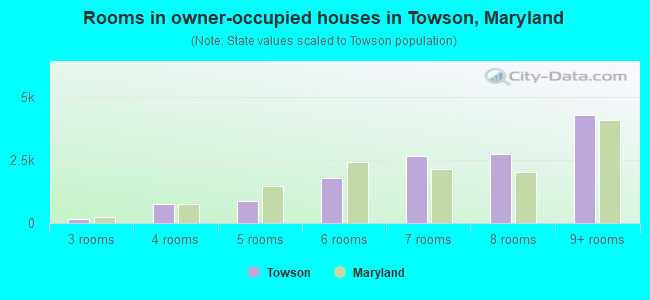
Rooms in owner-occupied houses - 1 room (%)
Rooms in owner-occupied houses - 2 rooms (%)
Rooms in owner-occupied houses - 3 rooms (%)
Rooms in owner-occupied houses - 4 rooms (%)
Rooms in owner-occupied houses - 5 rooms (%)
Rooms in owner-occupied houses - 6 rooms (%)
Rooms in owner-occupied houses - 7 rooms (%)
Rooms in owner-occupied houses - 8 rooms (%)
Rooms in owner-occupied houses - 9+ rooms (%)
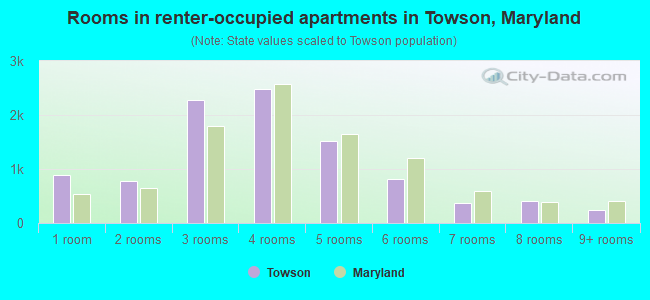
Rooms in renter-occupied houses - 1 room (%)
Rooms in renter-occupied houses - 2 rooms (%)
Rooms in renter-occupied houses - 3 rooms (%)
Rooms in renter-occupied houses - 4 rooms (%)
Rooms in renter-occupied houses - 5 rooms (%)
Rooms in renter-occupied houses - 6 rooms (%)
Rooms in renter-occupied houses - 7 rooms (%)
Rooms in renter-occupied houses - 8 rooms (%)
Rooms in renter-occupied houses - 9+ rooms (%)
Bedrooms in owner-occupied houses - no bedrooms (%)
Bedrooms in owner-occupied houses - 1 bedroom (%)
Bedrooms in owner-occupied houses - 2 bedrooms (%)
Bedrooms in owner-occupied houses - 3 bedrooms (%)
Bedrooms in owner-occupied houses - 4 bedrooms (%)
Bedrooms in owner-occupied houses - 5+ bedrooms (%)
Bedrooms in renter-occupied houses - no bedrooms (%)
Bedrooms in renter-occupied houses - 1 bedroom (%)
Bedrooms in renter-occupied houses - 2 bedrooms (%)
Bedrooms in renter-occupied houses - 3 bedrooms (%)
Bedrooms in renter-occupied houses - 4 bedrooms (%)
Bedrooms in renter-occupied houses - 5+ bedrooms (%)
Vehicles available in owner-occupied houses - no vehicle available (%)
Vehicles available in owner-occupied houses - 1 vehicle available(%)
Vehicles available in owner-occupied houses - 2 Vehicles available (%)
Vehicles available in owner-occupied houses - 3 Vehicles available (%)
Vehicles available in owner-occupied houses - 4 Vehicles available (%)
Vehicles available in owner-occupied houses - 5+ Vehicles available (%)
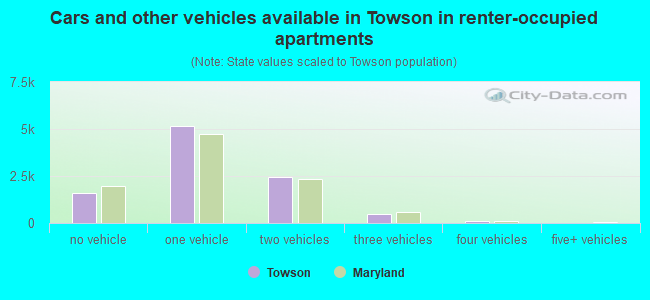
Vehicles available in renter-occupied houses - no vehicle available (%)
Vehicles available in renter-occupied houses - 1 vehicle available (%)
Vehicles available in renter-occupied houses - 2 Vehicles available (%)
Vehicles available in renter-occupied houses - 3 Vehicles available (%)
Vehicles available in renter-occupied houses - 4 Vehicles available (%)
Vehicles available in renter-occupied houses - 5+ Vehicles available (%)
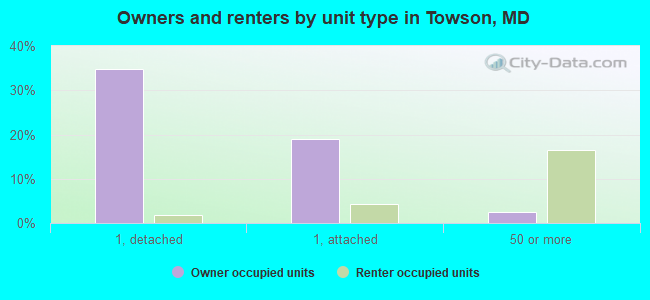
Housing units in structures - 1, detached (%)
Housing units in structures - 1, attached (%)
Housing units in structures - 2 (%)
Housing units in structures - 3 or 4 (%)
Housing units in structures - 5 to 9 (%)
Housing units in structures - 10 to 19 (%)
Housing units in structures - 20 to 49 (%)
Housing units in structures - 50 or more (%)
Housing units in structures - Mobile home (%)
Housing units in structures - Boat, RV, van, etc. (%)
Housing units in structures - Owners - 1, detached (%)
Housing units in structures - Owners - 1, attached (%)
Housing units in structures - Owners - 2 (%)
Housing units in structures - Owners - 3 or 4 (%)
Housing units in structures - Owners - 5 to 9 (%)
Housing units in structures - Owners - 10 to 19 (%)
Housing units in structures - Owners - 20 to 49 (%)
Housing units in structures - Owners - 50 or more (%)
Housing units in structures - Owners - Mobile home (%)
Housing units in structures - Owners - Boat, RV, van, etc. (%)
Housing units in structures - Renters - 1, detached (%)
Housing units in structures - Renters - 1, attached (%)
Housing units in structures - Renters - 2 (%)
Housing units in structures - Renters - 3 or 4 (%)
Housing units in structures - Renters - 5 to 9 (%)
Housing units in structures - Renters - 10 to 19 (%)
Housing units in structures - Renters - 20 to 49 (%)
Housing units in structures - Renters - 50 or more (%)
Housing units in structures - Renters - Mobile home (%)
Housing units in structures - Renters - Boat, RV, van, etc. (%)
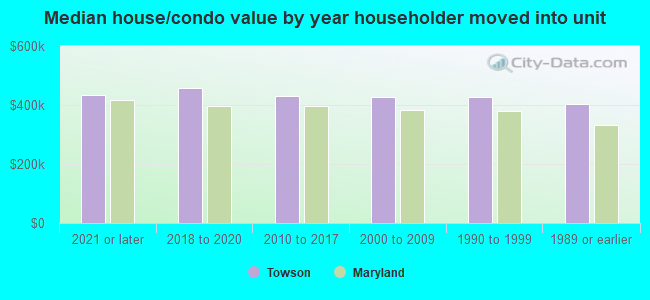
House/condo owner moved in on average (years ago)
Renter moved in on average (years ago)
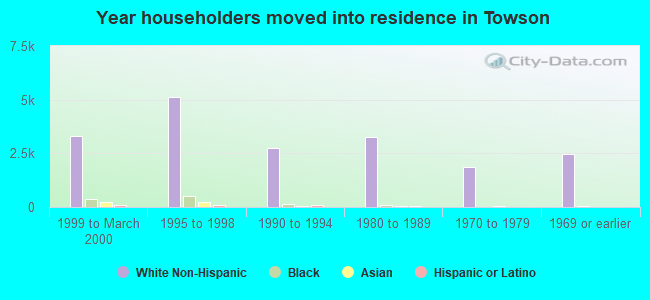
Year householder moved into unit - Moved in 1999 to March 2000 (%)
Year householder moved into unit - Moved in 1999 to March 2000 (%) - White
Year householder moved into unit - Moved in 1999 to March 2000 (%) - Black or African American
Year householder moved into unit - Moved in 1999 to March 2000 (%) - Asian
Year householder moved into unit - Moved in 1999 to March 2000 (%) - Hispanic or Latino
Year householder moved into unit - Moved in 1999 to March 2000 (%) - American Indian and Alaska Native
Year householder moved into unit - Moved in 1999 to March 2000 (%) - Multirace
Year householder moved into unit - Moved in 1999 to March 2000 (%) - Other Race
Year householder moved into unit - Moved in 1995 to 1998 (%)
Year householder moved into unit - Moved in 1995 to 1998 (%) - White
Year householder moved into unit - Moved in 1995 to 1998 (%) - Black or African American
Year householder moved into unit - Moved in 1995 to 1998 (%) - Asian
Year householder moved into unit - Moved in 1995 to 1998 (%) - Hispanic or Latino
Year householder moved into unit - Moved in 1995 to 1998 (%) - American Indian and Alaska Native
Year householder moved into unit - Moved in 1995 to 1998 (%) - Multirace
Year householder moved into unit - Moved in 1995 to 1998 (%) - Other Race
Year householder moved into unit - Moved in 1990 to 1994 (%)
Year householder moved into unit - Moved in 1990 to 1994 (%) - White
Year householder moved into unit - Moved in 1990 to 1994 (%) - Black or African American
Year householder moved into unit - Moved in 1990 to 1994 (%) - Asian
Year householder moved into unit - Moved in 1990 to 1994 (%) - Hispanic or Latino
Year householder moved into unit - Moved in 1990 to 1994 (%) - American Indian and Alaska Native
Year householder moved into unit - Moved in 1990 to 1994 (%) - Multirace
Year householder moved into unit - Moved in 1990 to 1994 (%) - Other Race
Year householder moved into unit - Moved in 1980 to 1989 (%)
Year householder moved into unit - Moved in 1980 to 1989 (%) - White
Year householder moved into unit - Moved in 1980 to 1989 (%) - Black or African American
Year householder moved into unit - Moved in 1980 to 1989 (%) - Asian
Year householder moved into unit - Moved in 1980 to 1989 (%) - Hispanic or Latino
Year householder moved into unit - Moved in 1980 to 1989 (%) - American Indian and Alaska Native
Year householder moved into unit - Moved in 1980 to 1989 (%) - Multirace
Year householder moved into unit - Moved in 1980 to 1989 (%) - Other Race
Year householder moved into unit - Moved in 1970 to 1979 (%)
Year householder moved into unit - Moved in 1970 to 1979 (%) - White
Year householder moved into unit - Moved in 1970 to 1979 (%) - Black or African American
Year householder moved into unit - Moved in 1970 to 1979 (%) - Asian
Year householder moved into unit - Moved in 1970 to 1979 (%) - Hispanic or Latino
Year householder moved into unit - Moved in 1970 to 1979 (%) - American Indian and Alaska Native
Year householder moved into unit - Moved in 1970 to 1979 (%) - Multirace
Year householder moved into unit - Moved in 1970 to 1979 (%) - Other Race
Year householder moved into unit - Moved in 1969 or earlier (%)
Year householder moved into unit - Moved in 1969 or earlier (%) - White
Year householder moved into unit - Moved in 1969 or earlier (%) - Black or African American
Year householder moved into unit - Moved in 1969 or earlier (%) - Asian
Year householder moved into unit - Moved in 1969 or earlier (%) - Hispanic or Latino
Year householder moved into unit - Moved in 1969 or earlier (%) - American Indian and Alaska Native
Year householder moved into unit - Moved in 1969 or earlier (%) - Multirace
Year householder moved into unit - Moved in 1969 or earlier (%) - Other Race
Housing units lacking complete plumbing facilities (%)
Housing units lacking complete kitchen facilities (%)
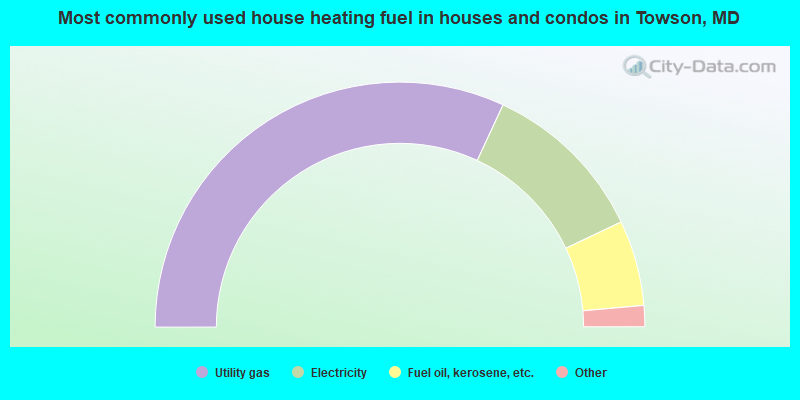
House heating fuel used in houses and condos - Utility gas (%)
House heating fuel used in houses and condos - Bottled, tank, or LP gas (%)
House heating fuel used in houses and condos - Electricity (%)
House heating fuel used in houses and condos - Fuel oil, kerosene, etc. (%)
House heating fuel used in houses and condos - Coal or coke (%)
House heating fuel used in houses and condos - Wood (%)
House heating fuel used in houses and condos - Solar energy (%)
House heating fuel used in houses and condos - Other fuel (%)
House heating fuel used in houses and condos - No fuel used (%)
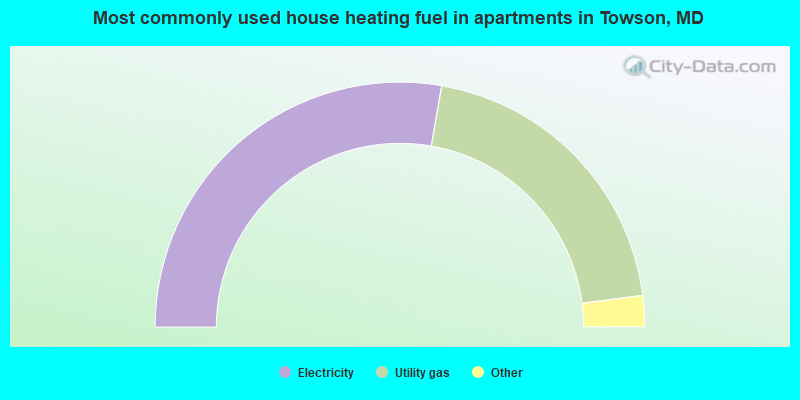
House heating fuel used in apartments - Utility gas (%)
House heating fuel used in apartments - Bottled, tank, or LP gas (%)
House heating fuel used in apartments - Electricity (%)
House heating fuel used in apartments - Fuel oil, kerosene, etc. (%)
House heating fuel used in apartments - Coal or coke (%)
House heating fuel used in apartments - Wood (%)
House heating fuel used in apartments - Solar energy (%)
House heating fuel used in apartments - Other fuel (%)
House heating fuel used in apartments - No fuel used (%)
Latest news about housing in Towson, MD collected exclusively by city-data.com from local newspapers, TV, and radio stations
Median year house/condo built: 1954Median year apartment built: 1982Household type by relationship:
Households: 57,307
Male householders: 9,830 (2,738 living alone ), Female householders: 12,478 (5,316 living alone )9,291 spouses (9,163 opposite-sex spouses ), 1,423 unmarried partners , (1,349 opposite-sex unmarried partners ), 12,842 children (12,243 natural , 338 adopted , 260 stepchildren ), 319 grandchildren , 285 brothers or sisters , 554 parents , 28 foster children , 244 other relatives , 2,821 non-relatives In group quarters: 7,186
Size of family households: 5,359 2-persons , 3,142 3-persons , 2,766 4-persons , 655 5-persons , 169 6-persons , 24 7-or-more-persons .
Size of nonfamily households: 8,388 1-person , 2,283 2-persons , 226 3-persons , 93 4-persons .
7,449 married couples with children. single-parent households (690 men , 1,355 women ).
88.5% of residents of Towson speak English at home. of residents speak Spanish at home (85% speak English very well , 9% speak English well , 6% speak English not well ).of residents speak other Indo-European language at home (75% speak English very well , 18% speak English well , 7% speak English not well ).of residents speak Asian or Pacific Island language at home (70% speak English very well , 22% speak English well , 7% speak English not well , 1% don't speak English at all ).of residents speak other language at home (78% speak English very well , 14% speak English well , 2% speak English not well , 5% don't speak English at all ).
Foreign born population: 6,219 (10.9%)of them are naturalized citizens )
Median number of rooms in houses and condos:
Median number of rooms in apartments
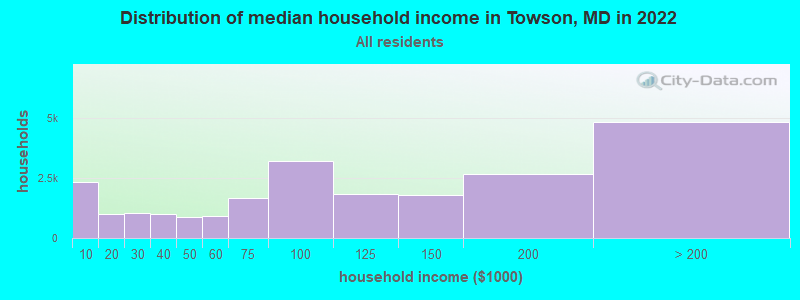
Towson, MD household income distribution 2,331 Less than $10,0001,000 $10,000 to $19,9991,043 $20,000 to $29,9991,006 $30,000 to $39,999854 $40,000 to $49,999905 $50,000 to $59,9991,677 $60,000 to $74,9993,202 $75,000 to $99,9991,846 $100,000 to $124,9991,803 $125,000 to $149,9992,650 $150,000 to $199,9994,826 $200,000 or more
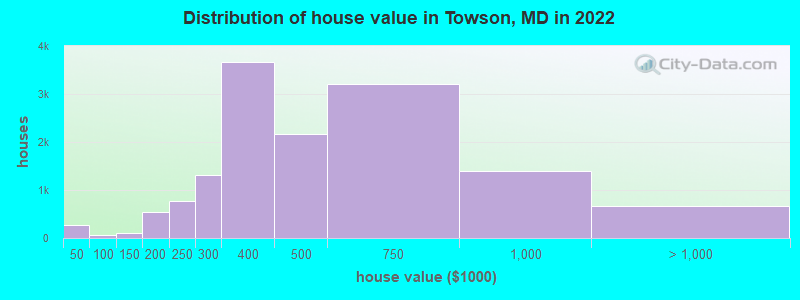
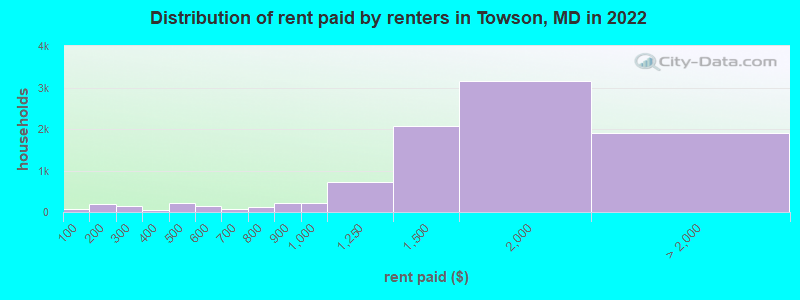
Home value of owner - occupied houses in 2022 in Towson, MD 214 Less than $10,00031 $15,000 to $19,9997 $25,000 to $29,9998 $30,000 to $34,9997 $35,000 to $39,9997 $50,000 to $59,99912 $80,000 to $89,99950 $90,000 to $99,99964 $100,000 to $124,99947 $125,000 to $149,999315 $150,000 to $174,999220 $175,000 to $199,999763 $200,000 to $249,9991,318 $250,000 to $299,9993,663 $300,000 to $399,9992,168 $400,000 to $499,9993,205 $500,000 to $749,9991,405 $750,000 to $999,999296 $1,000,000 to $1,499,999190 $1,500,000 to $1,999,999169 $2,000,000 or moreRent paid by renters in 2022 in Towson, MD 67 Less than $100147 $100 to $14953 $150 to $19917 $200 to $249118 $250 to $29947 $350 to $399134 $400 to $44989 $450 to $49983 $500 to $54951 $550 to $59972 $600 to $6492 $700 to $749129 $750 to $799216 $800 to $899216 $900 to $999719 $1,000 to $1,2492,074 $1,250 to $1,4993,162 $1,500 to $1,9991,263 $2,000 to $2,499144 $2,500 to $2,99945 $3,000 to $3,499273 $3,500 or more165 No cash rent
Percentage of workers working in this county: 61.5%Number of people working at home: 6,318 (22.0% of all workers )
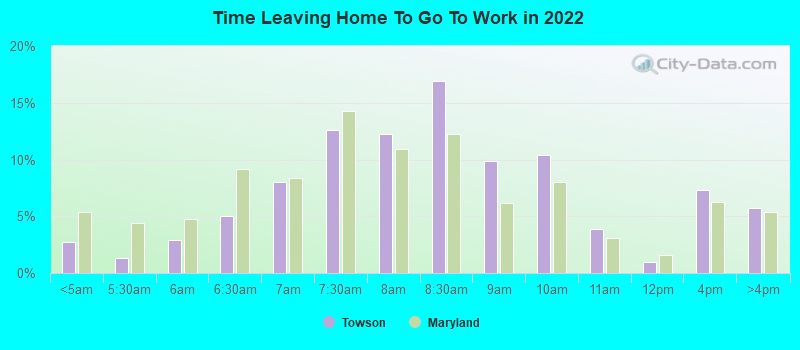
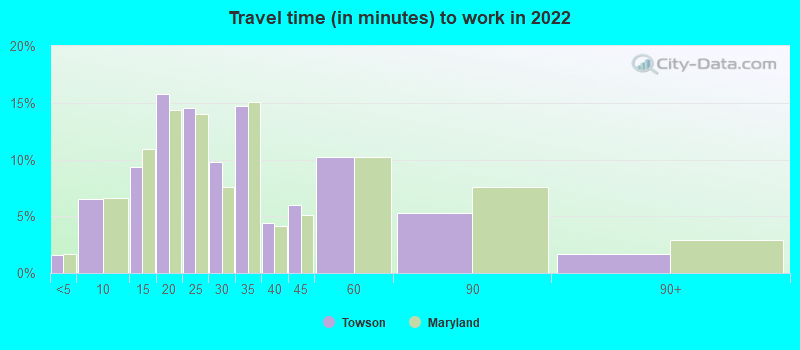
Travel time to work (commute)
Less than 5 minutes: 5565 to 9 minutes: 2,67510 to 14 minutes: 2,88515 to 19 minutes: 3,34520 to 24 minutes: 3,61325 to 29 minutes: 2,20130 to 34 minutes: 3,33635 to 39 minutes: 95240 to 44 minutes: 81445 to 59 minutes: 1,12160 to 89 minutes: 1,06590 or more minutes: 520
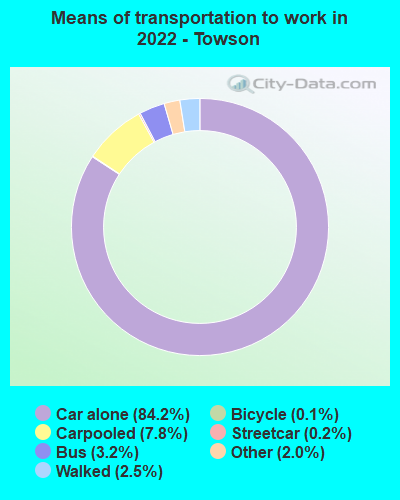
Means of transportation to work:
Drove a car alone: 45,513 (72.9%)Carpooled: 4,823 (7.7%)Bus : 1,060 (1.7%)Subway or elevated rail : 87 (0.1%)Long-distance train or commuter rail : 55 (0.1%)Light rail, streetcar or trolley : 31 (0.0%)Ferryboat: 7 (0.0%)Taxi: 1,266 (2.0%)Bicycle: 53 (0.1%)Walked: 1,498 (2.4%)Worked at home: 6,318 (10.1%)
Unemployment by race in 2022
Unemployment rate for White non-Hispanic residents 3.3% Males3.5% FemalesUnemployment rate for Black residents 6.1% Males3.5% FemalesUnemployment rate for American Indian and Alaska Native residents 26.5% MalesUnemployment rate for Asian residents 1.1% Males4.5% FemalesUnemployment rate for other race residents 21.7% FemalesUnemployment rate for two or more race residents 4.6% Males1.7% FemalesUnemployment rate for Hispanic or Latino residents 3.0% Males4.0% Females
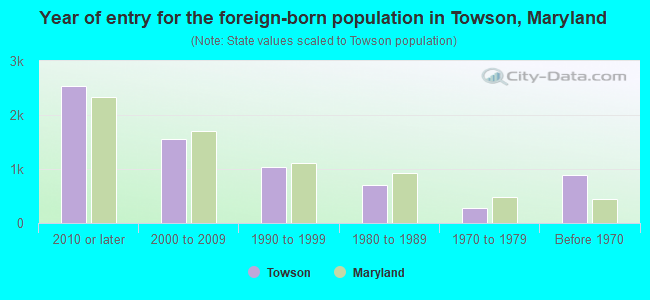
Year of entry for the foreign-born population in Towson, Maryland
2,528 2010 or later 1,560 2000 to 2009 1,036 1990 to 1999 701 1980 to 1989 284 1970 to 1979 887 Before 1970
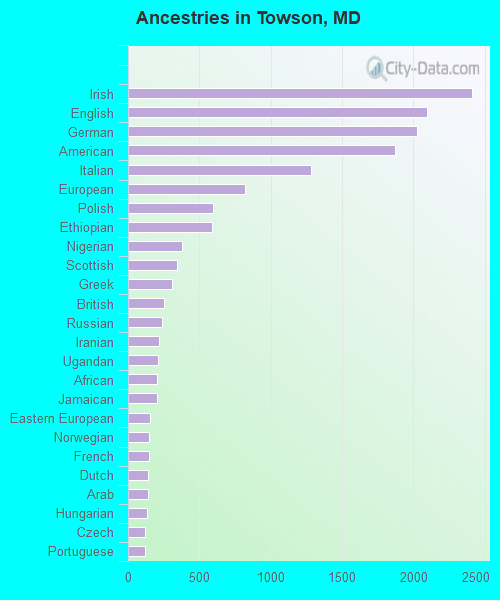
First ancestries reported:
Irish: 2,411 (8.9%)
English: 2,096 (7.7%)
German: 2,024 (7.4%)
American: 1,869 (6.9%)
Italian: 1,280 (4.7%)
European: 823 (3.0%)
Polish: 593 (2.2%)
Ethiopian: 592 (2.2%)
Nigerian: 379 (1.4%)
Scottish: 344 (1.3%)
Greek: 308 (1.1%)
British: 251 (0.9%)
Russian: 241 (0.9%)
Iranian: 215 (0.8%)
Ugandan: 207 (0.8%)
African: 205 (0.8%)
Jamaican: 204 (0.7%)
Eastern European: 154 (0.6%)
Norwegian: 147 (0.5%)
French: 145 (0.5%)
Dutch: 143 (0.5%)
Arab: 137 (0.5%)
Hungarian: 131 (0.5%)
Czech: 122 (0.4%)
Portuguese: 120 (0.4%)
Scotch-Irish: 110 (0.4%)
Swedish: 106 (0.4%)
Syrian: 104 (0.4%)
Northern European: 101 (0.4%)
Trinidadian and Tobagonian: 98 (0.4%)
Ukrainian: 85 (0.3%)
Romanian: 71 (0.3%)
Turkish: 58 (0.2%)
Haitian: 56 (0.2%)
West Indian: 54 (0.2%)
Brazilian: 47 (0.2%)
Kenyan: 43 (0.2%)
Lithuanian: 42 (0.2%)
Welsh: 41 (0.2%)
Israeli: 39 (0.1%)
Armenian: 38 (0.1%)
French Canadian: 38 (0.1%)
Scandinavian: 31 (0.1%)
Swiss: 27 (0.10%)
Danish: 26 (0.10%)
Egyptian: 23 (0.08%)
Austrian: 22 (0.08%)
Slavic: 21 (0.08%)
Ghanaian: 17 (0.06%)
Australian: 16 (0.06%)
Canadian: 15 (0.06%)
Latvian: 14 (0.05%)
Maltese: 12 (0.04%)
Czechoslovakian: 11 (0.04%)
Finnish: 11 (0.04%)
Estonian: 11 (0.04%)
Belizean: 10 (0.04%)
Belgian: 9 (0.03%)
Lebanese: 9 (0.03%)
Sierra Leonean: 9 (0.03%)
Luxembourger: 9 (0.03%)
Slovak: 8 (0.03%)
German Russian: 7 (0.03%)
Bulgarian: 6 (0.02%)
Liberian: 4 (0.01%)
Jordanian: 3 (0.01%)
Most common places of birth for foreign-born residents (%): Nepal Towson:
8.1% (505)Maryland:
1.1% (10,205)
Ethiopia Towson:
7.8% (490)Maryland:
3.2% (30,870)
China, excluding Hong Kong and Taiwan Towson:
6.4% (402)Maryland:
4.6% (44,742)
Nigeria Towson:
6.3% (394)Maryland:
4.6% (44,825)
India Towson:
6.1% (380)Maryland:
6.4% (61,725)
Philippines Towson:
5.5% (346)Maryland:
3.8% (36,698)
Uganda Towson:
3.8% (241)Maryland:
0.2% (1,672)
Iran Towson:
3.6% (227)Maryland:
1.3% (12,074)
Korea Towson:
3.4% (211)Maryland:
3.4% (32,635)
Mexico Towson:
3.0% (185)Maryland:
3.5% (34,065)
Kenya Towson:
2.3% (142)Maryland:
0.8% (7,497)
Liberia Towson:
2.3% (141)Maryland:
0.6% (5,959)
Romania Towson:
2.2% (138)Maryland:
0.3% (2,576)
Italy Towson:
2.1% (134)Maryland:
0.5% (4,596)
Taiwan Towson:
2.0% (124)Maryland:
0.9% (8,520)
Canada Towson:
1.9% (117)Maryland:
0.9% (8,603)
Place of birth for U.S.-born residents:
This state: 33,286Other state: 16,740Northeast: 7,305Midwest: 3,064South: 5,316West: 1,116 81.6% of Towson residents lived in the same house 1 years ago.
Out of people who lived in different houses, 21.8% lived in this county.
Out of people who lived in different counties, 72.0% lived in Maryland.
Towson:
81.6%State average:
88.5%
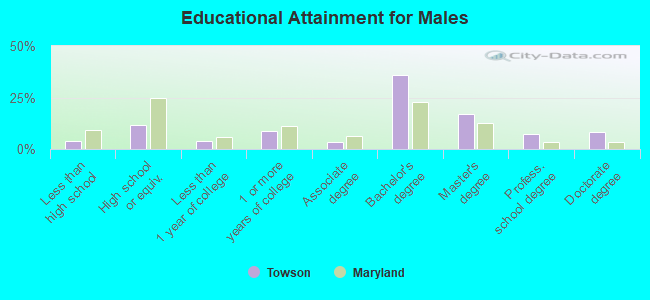
Education attainment for males 25 years and older:
No schooling: 231Nursery to 4th grade: 565th and 6th grade: 07th and 8th grade: 729th grade: 10910th grade: 5611th grade: 5112th grade, no diploma: 118High school graduate (or equivalency): 1,981Less than 1 year of college: 691Some college more than 1 year, no degree: 1,504Associate degree: 594Bachelor's degree: 6,081Master's degree: 2,893Professional school degree: 1,201Doctorate degree: 1,403
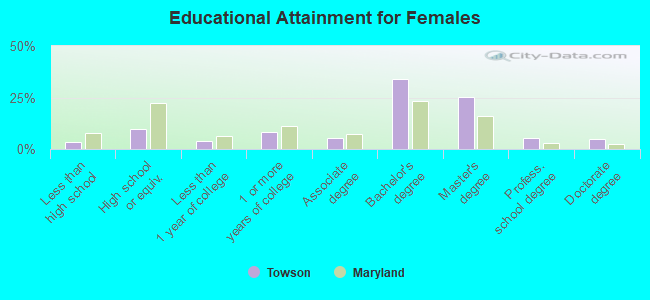
Education attainment for females 25 years and older:
No schooling: 215Nursery to 4th grade: 125th and 6th grade: 537th and 8th grade: 1439th grade: 710th grade: 5311th grade: 10012th grade, no diploma: 119High school graduate (or equivalency): 1,870Less than 1 year of college: 711Some college more than 1 year, no degree: 1,598Associate degree: 1,014Bachelor's degree: 6,589Master's degree: 4,924Professional school degree: 999Doctorate degree: 968
Housing units in structures:
One, detached: 8,337One, attached: 5,426Two: 1153 or 4: 1,1485 to 9: 2,07610 to 19: 1,68920 to 49: 76450 or more: 4,777Mobile homes: 12Housing units lacking complete plumbing facilities in 2022: 0.4%Housing units lacking complete kitchen facilities in 2022: 1.9%House/condo owner moved in on average 12 years ago
Renter moved in on average 2 years ago
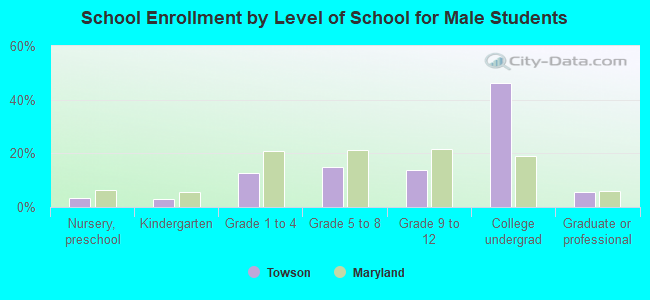
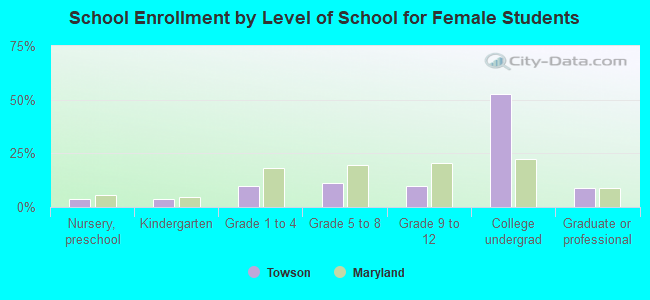
Private vs. public school enrollment:
Students in private schools in grades 1 to 8 (elementary and middle school): 1,182 Students in private schools in grades 9 to 12 (high school): 613 Students in private undergraduate colleges: 1,530