Trenton, MI (Michigan) Houses and Residents
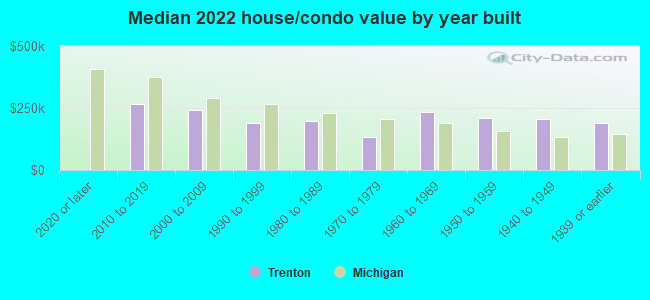
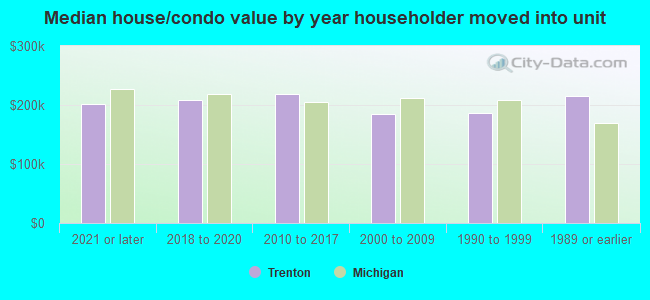
| Trenton: | $205,771 |
| Michigan: | $224,400 |
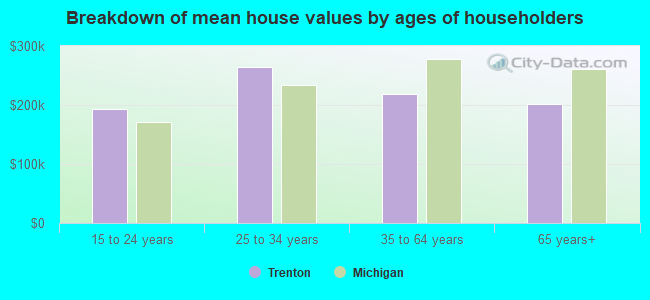
Mean price in 2022:
Detached houses: $232,567
Here: $232,567 State: $280,038 Townhouses or other attached units: $161,326
Here: $161,326 State: $239,520 In 3-to-4-unit structures: $130,139
Here: $130,139 State: $207,067 In 5-or-more-unit structures: $94,212
Here: $94,212 State: $192,733 Mobile homes: $21,610
Here: $21,610 State: $72,868
Total population: 18,427 (All urban)
Houses: 8,410 (8,040 occupied: 6,745 owner occupied, 1,341 renter occupied)
| % of renters here: | 17% |
| State: | 27% |
Housing density: 1,152 houses/condos per square mile
Median price asked for vacant for-sale houses and condos in 2022: $153,011.
Median contract rent in 2022: $721 (lower quartile is $599, upper quartile is $945)
Median rent asked for vacant for-rent units in 2022: $601
Median gross rent in Trenton, MI in 2022: $858
Housing units in Trenton with a mortgage: 3,725 (392 second mortgage, 0 home equity loan, 403 both second mortgage and home equity loan)
Houses without a mortgage: 218
Median household income for houses/condos with a mortgage: $107,496
Median household income for apartments without a mortgage: $61,792
Median monthly housing costs: $979
Compare current foreclosures in Trenton, MI:
| Photo | Address | Area | Beds / Baths | Price | Details |
|---|---|---|---|---|---|

|
#1
Grange Rd
Trenton, MI 48183
|
1,218 sq. feet
|
1 baths 3 beds |
show details | |

|
#2
Stacey Dr
Trenton, MI 48183
|
2,995 sq. feet
|
2 baths 4 beds |
show details | |

|
#3
Ada St
Trenton, MI 48183
|
1,288 sq. feet
|
1 baths 3 beds |
show details | |

|
#4
Busenbark Ln
Trenton, MI 48183
|
1,617 sq. feet
|
2 baths 3 beds |
show details | |

|
#5
Indiana Ave
Trenton, MI 48183
|
1,367 sq. feet
|
1 baths 3 beds |
show details | |

|
#6
Seneca Ave
Trenton, MI 48183
|
2,037 sq. feet
|
2 baths 3 beds |
show details | |

|
#7
Newman Dr
Trenton, MI 48183
|
1,600 sq. feet
|
1 baths 3 beds |
show details | |

|
#8
Reading Ct
Trenton, MI 48183
|
1,108 sq. feet
|
1 baths 2 beds |
show details | |

|
#9
Wilson Dr
Trenton, MI 48183
|
2,625 sq. feet
|
2 baths 4 beds |
show details | |

|
#10
Mahoney Ct
Trenton, MI 48183
|
1,108 sq. feet
|
1 baths 2 beds |
show details |
| Photo | Address | Area | Beds / Baths | Price | Details |
|---|---|---|---|---|---|

|
#11
Dovetail Dr
Trenton, MI 48183
|
2,751 sq. feet
|
2 baths 4 beds |
show details | |

|
#12
Bunte Ct
Trenton, MI 48183
|
1,108 sq. feet
|
1 baths 2 beds |
show details | |

|
#13
Cornell Ave
Trenton, MI 48183
|
2,010 sq. feet
|
2 baths 3 beds |
show details | |

|
#14
Majestic Dr
Trenton, MI 48183
|
1,526 sq. feet
|
2 baths 2 beds |
show details | |

|
#15
Mayfair Ave
Trenton, MI 48183
|
2,002 sq. feet
|
1 baths 3 beds |
show details | |

|
#16
Busenbark Ln
Trenton, MI 48183
|
1,617 sq. feet
|
2 baths 3 beds |
show details | |

|
#17
Curt Dr
Trenton, MI 48183
|
2,533 sq. feet
|
2 baths 4 beds |
show details | |

|
#18
Cora St
Trenton, MI 48183
|
1,001 sq. feet
|
1 baths 3 beds |
show details | |

|
#19
Hidden Oaks Dr
Trenton, MI 48183
|
1,167 sq. feet
|
2 baths 2 beds |
show details | |

|
#20
W Lake Cir
Trenton, MI 48183
|
1,257 sq. feet
|
2 baths 2 beds |
show details |
| Photo | Address | Area | Beds / Baths | Price | Details |
|---|---|---|---|---|---|

|
#21
Newman Dr
Trenton, MI 48183
|
989 sq. feet
|
1 baths 3 beds |
show details | |

|
#22
Wyatt Ave
Trenton, MI 48183
|
1,704 sq. feet
|
2 baths 4 beds |
show details | |

|
#23
Wyatt Ave
Trenton, MI 48183
|
1,872 sq. feet
|
2 baths 4 beds |
show details | |

|
#24
Anmarie Ct
Trenton, MI 48183
|
2,278 sq. feet
|
2 baths 4 beds |
show details | |

|
#25
Indiana Ave
Trenton, MI 48183
|
1,367 sq. feet
|
2 baths 3 beds |
show details | |

|
#26
Kingston Ct
Trenton, MI 48183
|
1,312 sq. feet
|
1 baths - beds |
show details | |

|
#27
Nelson St
Trenton, MI 48183
|
1,336 sq. feet
|
1 baths - beds |
show details | |

|
#28
Canterbury St
Trenton, MI 48183
|
1,514 sq. feet
|
2 baths - beds |
show details | |

|
#29
Fairgrove St
Trenton, MI 48183
|
1,020 sq. feet
|
1 baths - beds |
show details | |

|
#30
Lancaster Dr
Trenton, MI 48183
|
1,552 sq. feet
|
1 baths - beds |
show details |
| Photo | Address | Area | Beds / Baths | Price | Details |
|---|---|---|---|---|---|

|
#31
Charlton Rd Apt 218
Trenton, MI 48183
|
- sq. feet
|
- baths - beds |
show details | |

|
#32
Cleveland St
Trenton, MI 48183
|
- sq. feet
|
- baths - beds |
show details | |

|
#33
Telegraph Rd, Trlr 102
Trenton, MI 48183
|
- sq. feet
|
- baths - beds |
show details | |

|
#34
Sherwood Ln Apt 101
Trenton, MI 48183
|
- sq. feet
|
- baths - beds |
show details | |

|
#35
Van Horn Rd Apt 101
Trenton, MI 48183
|
- sq. feet
|
- baths - beds |
show details | |

|
#36
West Rd Apt 210
Trenton, MI 48183
|
- sq. feet
|
- baths - beds |
show details | |

|
#37
Marie St Apt 8
Trenton, MI 48183
|
- sq. feet
|
- baths - beds |
show details | |

|
#38
Kings Pointe Blvd Apt 306
Trenton, MI 48183
|
- sq. feet
|
- baths - beds |
show details | |

|
#39
Heritage Dr Apt 101
Trenton, MI 48183
|
- sq. feet
|
- baths - beds |
show details | |

|
#40
W Jefferson Ave, Trlr 7
Trenton, MI 48183
|
- sq. feet
|
- baths - beds |
show details |
| Photo | Address | Area | Beds / Baths | Price | Details |
|---|---|---|---|---|---|

|
#41
Blakely Dr
Trenton, MI 48183
|
- sq. feet
|
- baths - beds |
show details | |

|
#42
Balfour St
Trenton, MI 48183
|
- sq. feet
|
- baths - beds |
show details | |

|
#43
Van Horn Rd Apt 101
Trenton, MI 48183
|
- sq. feet
|
- baths - beds |
show details | |

|
#44
Oriole Dr
Trenton, MI 48183
|
- sq. feet
|
- baths - beds |
show details | |

|
#45
Bernice Ct
Trenton, MI 48183
|
- sq. feet
|
- baths - beds |
show details | |

|
#46
Oxford St
Trenton, MI 48183
|
- sq. feet
|
- baths - beds |
show details | |

|
#47
Marsh Creek Blvd Apt 201
Trenton, MI 48183
|
- sq. feet
|
- baths - beds |
show details | |

|
#48
Carmel St
Trenton, MI 48183
|
- sq. feet
|
- baths - beds |
show details | |

|
#49
Hidden Oaks Dr
Trenton, MI 48183
|
- sq. feet
|
- baths - beds |
show details | |

|
Check over 1 million property listings on Foreclosure.com!
|
browse all offers | |||

Latest news about housing in Trenton, MI collected exclusively by city-data.com from local newspapers, TV, and radio stations

 | Renting a house vs. apartment in Downriver area (8 replies) |
| Will work in Trenton, where should I live? (10 replies) |
| Senior homesick for Downriver Michigan (19 replies) |
| TRENTON, MI - please help with info! (7 replies) |
| Wyandotte/Trenton, Michigan Questions (5 replies) |
| Where to live near Troy, Michigan :) (19 replies) |

Median year apartment built: 1971
Household type by relationship:
Households: 18,165- Male householders: 3,505 (917 living alone), Female householders: 4,435 (1,893 living alone)
3,662 spouses (3,637 opposite-sex spouses), 295 unmarried partners, (277 opposite-sex unmarried partners), 5,268 children (4,793 natural, 221 adopted, 252 stepchildren), 234 grandchildren, 34 brothers or sisters, 42 parents, 9 foster children, 242 other relatives, 233 non-relatives
- In group quarters: 199
Size of family households: 2,529 2-persons, 1,254 3-persons, 721 4-persons, 307 5-persons, 54 6-persons, 41 7-or-more-persons.
Size of nonfamily households: 2,912 1-person, 223 2-persons, 46 4-persons.
2,464 married couples with children.
924 single-parent households (269 men, 655 women).
95.9% of residents of Trenton speak English at home.
1.4% of residents speak Spanish at home (90% speak English very well, 7% speak English well, 3% speak English not well).
2.5% of residents speak other Indo-European language at home (61% speak English very well, 30% speak English well, 9% speak English not well).
0.1% of residents speak Asian or Pacific Island language at home (100% speak English well).
0.2% of residents speak other language at home (100% speak English very well).
Foreign born population: 704 (3.9%)
(59.5% of them are naturalized citizens)
| Here: | 6.0 |
| State: | 6.5 |
| Here: | 4.2 |
| State: | 4.3 |
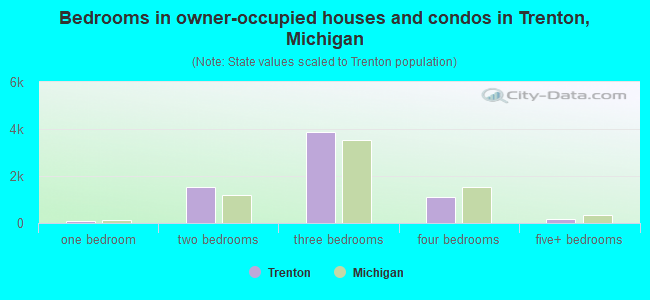
- Bedrooms in owner-occupied houses and condos in Trenton, Michigan
- 10no bedroom
- 791 bedroom
- 1,5172 bedrooms
- 3,8743 bedrooms
- 1,1014 bedrooms
- 1645+ bedrooms
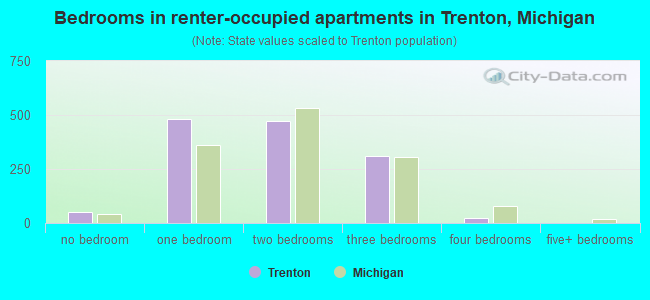
- Bedrooms in renter-occupied apartments in Trenton, Michigan
- 49no bedroom
- 4831 bedroom
- 4742 bedrooms
- 3103 bedrooms
- 254 bedrooms
- 05+ bedrooms
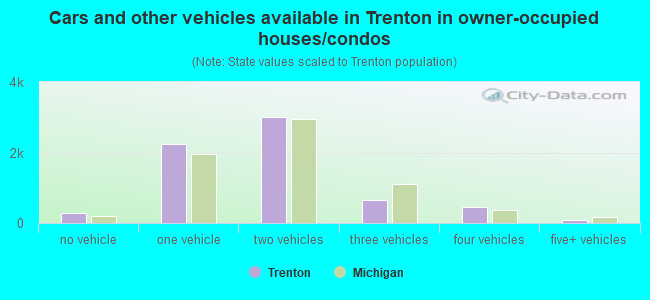
- Cars and other vehicles available in Trenton in owner-occupied houses/condos
- 291no vehicle
- 2,2491 vehicle
- 3,0192 vehicles
- 6433 vehicles
- 4644 vehicles
- 805+ vehicles
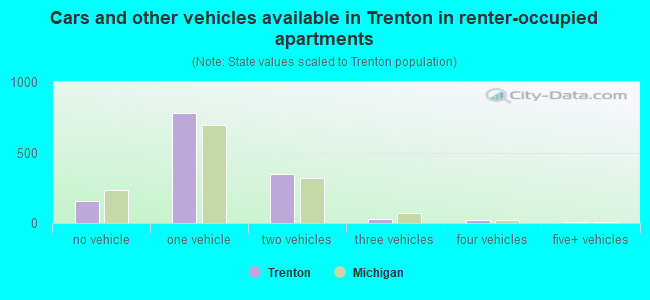
- Cars and other vehicles available in Trenton in renter-occupied apartments
- 154no vehicle
- 7821 vehicle
- 3472 vehicles
- 293 vehicles
- 214 vehicles
- 85+ vehicles
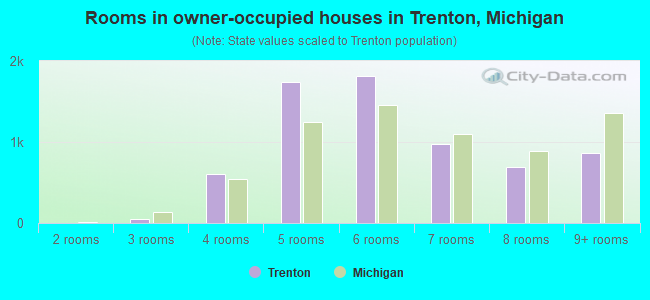
- Rooms in owner-occupied houses in Trenton, Michigan
- 81 room
- 22 rooms
- 453 rooms
- 6024 rooms
- 1,7425 rooms
- 1,8136 rooms
- 9777 rooms
- 6888 rooms
- 8699+ rooms
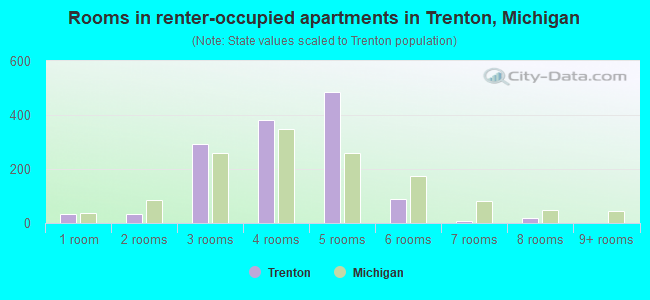
- Rooms in renter-occupied apartments in Trenton, Michigan
- 321 room
- 322 rooms
- 2923 rooms
- 3834 rooms
- 4865 rooms
- 906 rooms
- 67 rooms
- 208 rooms
- 09+ rooms
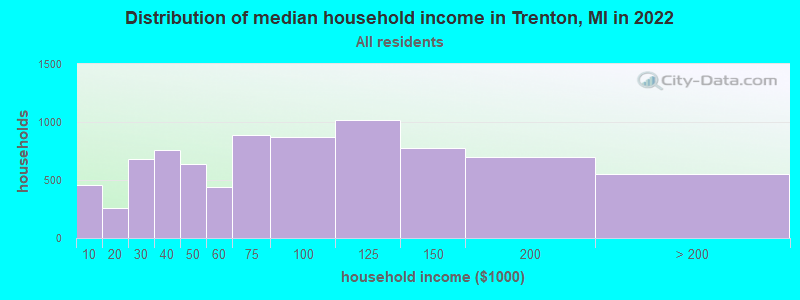
Trenton, MI household income distribution

- 453Less than $10,000
- 260$10,000 to $19,999
- 681$20,000 to $29,999
- 758$30,000 to $39,999
- 641$40,000 to $49,999
- 439$50,000 to $59,999
- 885$60,000 to $74,999
- 868$75,000 to $99,999
- 1,018$100,000 to $124,999
- 776$125,000 to $149,999
- 696$150,000 to $199,999
- 552$200,000 or more
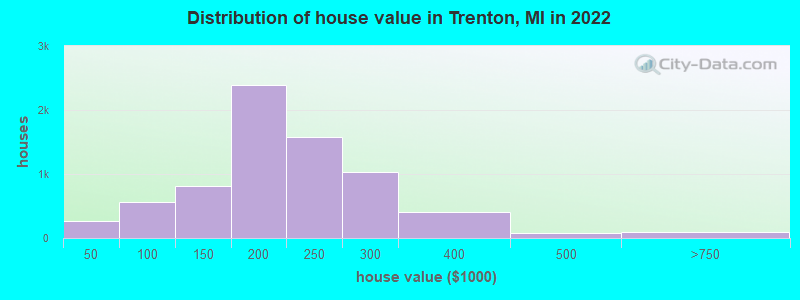
Home value of owner - occupied houses in 2022 in Trenton, MI
-
- 81Less than $10,000
- 49$10,000 to $14,999
- 46$15,000 to $19,999
- 26$20,000 to $24,999
- 5$25,000 to $29,999
- 28$30,000 to $34,999
- 27$40,000 to $49,999
- 27$50,000 to $59,999
- 54$60,000 to $69,999
- 134$70,000 to $79,999
- 145$80,000 to $89,999
- 175$90,000 to $99,999
- 521$100,000 to $124,999
- 285$125,000 to $149,999
- 1,194$150,000 to $174,999
- 1,195$175,000 to $199,999
- 1,581$200,000 to $249,999
- 1,028$250,000 to $299,999
- 405$300,000 to $399,999
- 85$400,000 to $499,999
- 70$500,000 to $749,999
- 15$750,000 to $999,999
- 0$1,000,000 to $1,499,999
- 13$2,000,000 or more
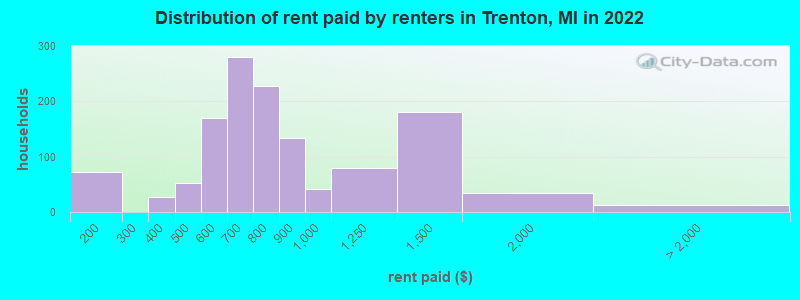
Rent paid by renters in 2022 in Trenton, MI
-
- 58$100 to $149
- 12$150 to $199
- 22$300 to $349
- 5$350 to $399
- 25$400 to $449
- 28$450 to $499
- 82$500 to $549
- 87$550 to $599
- 133$600 to $649
- 147$650 to $699
- 128$700 to $749
- 100$750 to $799
- 133$800 to $899
- 40$900 to $999
- 79$1,000 to $1,249
- 180$1,250 to $1,499
- 34$1,500 to $1,999
- 13No cash rent
Percentage of workers working in this county: 90.7%
Number of people working at home: 1,162 (13.7% of all workers)
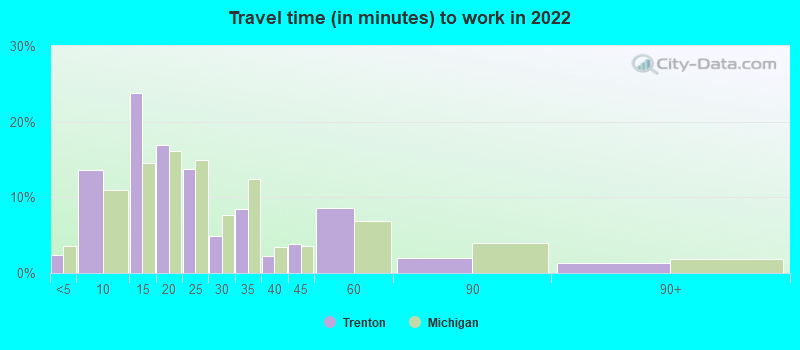
Travel time to work (commute)
- Less than 5 minutes: 258
- 5 to 9 minutes: 1,140
- 10 to 14 minutes: 885
- 15 to 19 minutes: 782
- 20 to 24 minutes: 962
- 25 to 29 minutes: 621
- 30 to 34 minutes: 934
- 35 to 39 minutes: 332
- 40 to 44 minutes: 263
- 45 to 59 minutes: 580
- 60 to 89 minutes: 436
- 90 or more minutes: 118
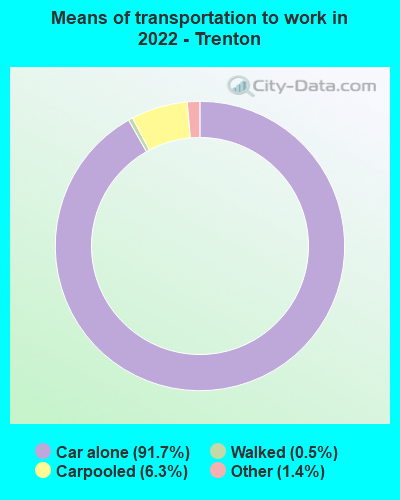
Means of transportation to work:
- Drove a car alone: 6,574 (79.2%)
- Carpooled: 449 (5.4%)
- Taxi: 111 (1.3%)
- Walked: 35 (0.4%)
- Worked at home: 1,162 (14.0%)
- Unemployment by race in 2022
- Unemployment rate for White non-Hispanic residents
- 2.6%Males
- 2.3%Females
- Unemployment rate for Black residents
- 12.0%Females
- Unemployment rate for two or more race residents
- 6.5%Males
- 4.5%Females
- Unemployment rate for Hispanic or Latino residents
- 3.6%Males
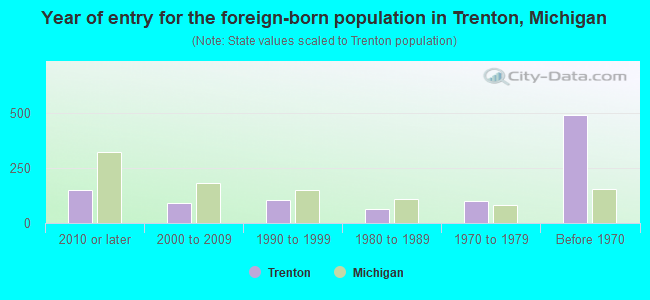
- Year of entry for the foreign-born population in Trenton, Michigan
- 1502010 or later
- 912000 to 2009
- 1061990 to 1999
- 651980 to 1989
- 981970 to 1979
- 490Before 1970
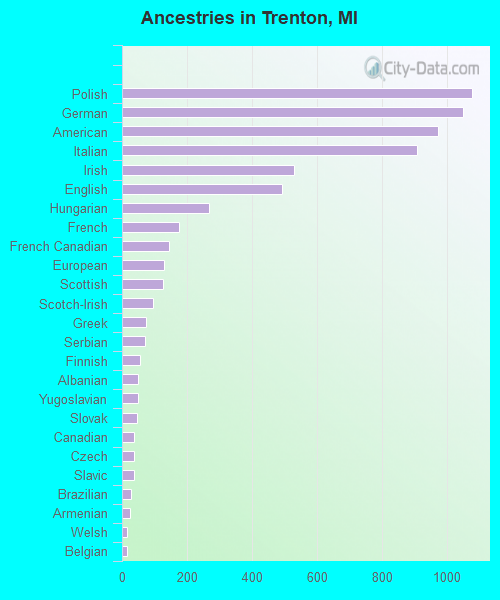
First ancestries reported:
- Polish: 1,077 (13.7%)
- German: 1,050 (13.3%)
- American: 974 (12.4%)
- Italian: 908 (11.5%)
- Irish: 531 (6.7%)
- English: 494 (6.3%)
- Hungarian: 267 (3.4%)
- French: 175 (2.2%)
- French Canadian: 146 (1.9%)
- European: 128 (1.6%)
- Scottish: 125 (1.6%)
- Scotch-Irish: 97 (1.2%)
- Greek: 73 (0.9%)
- Serbian: 71 (0.9%)
- Finnish: 57 (0.7%)
- Albanian: 50 (0.6%)
- Yugoslavian: 49 (0.6%)
- Slovak: 45 (0.6%)
- Canadian: 37 (0.5%)
- Czech: 36 (0.5%)
- Slavic: 36 (0.5%)
- Brazilian: 27 (0.3%)
- Armenian: 25 (0.3%)
- Welsh: 15 (0.2%)
- Belgian: 14 (0.2%)
- Scandinavian: 13 (0.2%)
- Maltese: 10 (0.1%)
- Lithuanian: 9 (0.1%)
- Dutch: 8 (0.1%)
- Russian: 8 (0.1%)
- Ukrainian: 8 (0.1%)
- Northern European: 7 (0.09%)
- Austrian: 6 (0.08%)
- Norwegian: 6 (0.08%)
- Cypriot: 4 (0.05%)
- British: 4 (0.05%)
Most common places of birth for foreign-born residents (%):
| Trenton: | 17.0% (117) |
| Michigan: | 0.6% (4,245) |
| Trenton: | 10.3% (71) |
| Michigan: | 5.0% (35,052) |
| Trenton: | 8.2% (56) |
| Michigan: | 0.9% (6,009) |
| Trenton: | 8.2% (56) |
| Michigan: | 10.9% (75,965) |
| Trenton: | 5.8% (40) |
| Michigan: | 1.1% (7,792) |
| Trenton: | 4.9% (34) |
| Michigan: | 2.8% (19,112) |
| Trenton: | 4.5% (31) |
| Michigan: | 1.9% (12,910) |
| Trenton: | 3.9% (27) |
| Michigan: | 0.1% (873) |
| Trenton: | 3.8% (26) |
| Michigan: | 2.3% (16,126) |
| Trenton: | 3.6% (25) |
| Michigan: | 0.2% (1,346) |
| Trenton: | 2.9% (20) |
| Michigan: | 0.4% (2,721) |
| Trenton: | 2.8% (19) |
| Michigan: | 3.0% (20,884) |
| Trenton: | 2.8% (19) |
| Michigan: | 0.2% (1,597) |
| Trenton: | 2.6% (18) |
| Michigan: | 1.0% (6,730) |
| Trenton: | 2.3% (16) |
| Michigan: | 0.2% (1,685) |
| Trenton: | 2.2% (15) |
| Michigan: | 0.0% (153) |
| Trenton: | 2.0% (14) |
| Michigan: | 0.0% (333) |
| Trenton: | 1.7% (12) |
| Michigan: | 0.1% (406) |
Place of birth for U.S.-born residents:
- This state: 15,394
- Other state: 1,943
- Northeast: 265
- Midwest: 777
- South: 710
- West: 180
91.9% of Trenton residents lived in the same house 1 years ago.
Out of people who lived in different houses, 41.2% lived in this county.
Out of people who lived in different counties, 30.0% lived in Michigan.
| Trenton: | 91.9% |
| State average: | 88.4% |
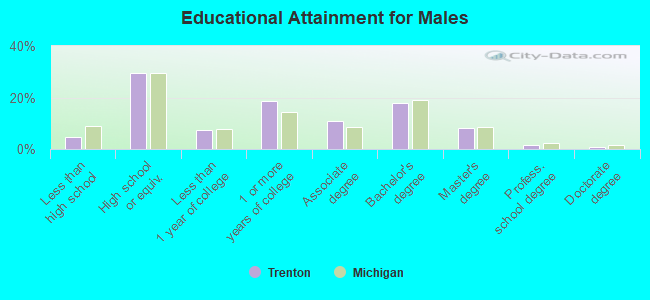
Education attainment for males 25 years and older:
- No schooling: 26
- Nursery to 4th grade: 11
- 5th and 6th grade: 27
- 7th and 8th grade: 24
- 9th grade: 25
- 10th grade: 67
- 11th grade: 23
- 12th grade, no diploma: 93
- High school graduate (or equivalency): 1,850
- Less than 1 year of college: 465
- Some college more than 1 year, no degree: 1,170
- Associate degree: 689
- Bachelor's degree: 1,123
- Master's degree: 505
- Professional school degree: 89
- Doctorate degree: 43
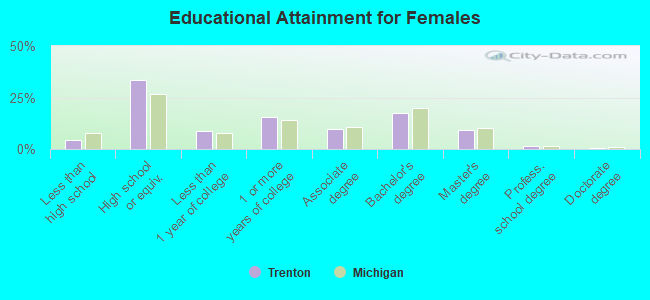
Education attainment for females 25 years and older:
- No schooling: 30
- Nursery to 4th grade: 0
- 5th and 6th grade: 28
- 7th and 8th grade: 17
- 9th grade: 60
- 10th grade: 72
- 11th grade: 10
- 12th grade, no diploma: 84
- High school graduate (or equivalency): 2,441
- Less than 1 year of college: 626
- Some college more than 1 year, no degree: 1,111
- Associate degree: 694
- Bachelor's degree: 1,258
- Master's degree: 670
- Professional school degree: 115
- Doctorate degree: 43


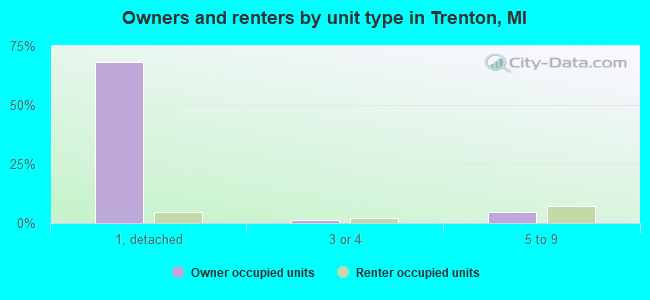
Housing units in structures:
- One, detached: 5,902
- One, attached: 670
- Two: 153
- 3 or 4: 219
- 5 to 9: 907
- 10 to 19: 194
- 20 to 49: 62
- 50 or more: 189
- Mobile homes: 108
Median worth of mobile homes: $10,678
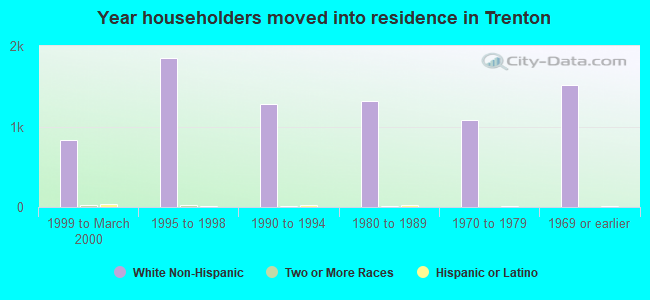
House/condo owner moved in on average 15 years ago
Renter moved in on average 6 years ago
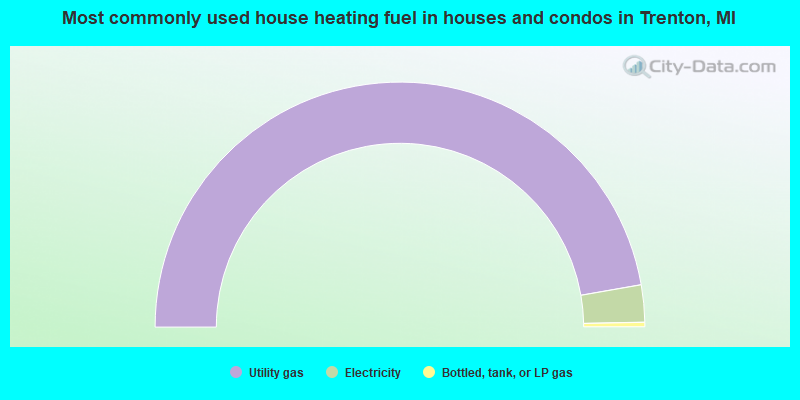
- 94.5%Utility gas
- 4.9%Electricity
- 0.6%Bottled, tank, or LP gas
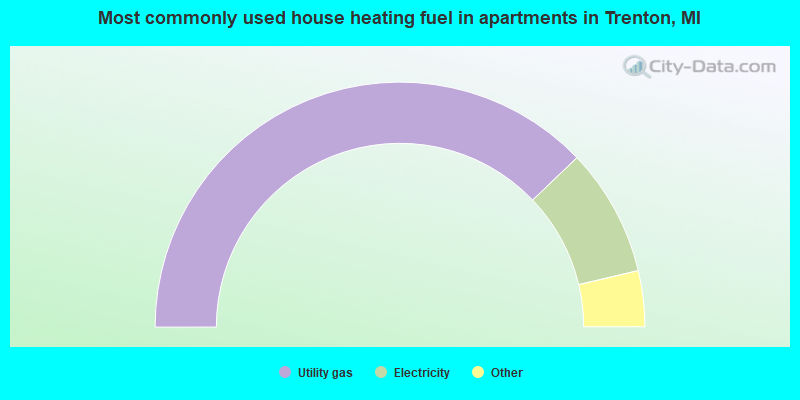
- 75.7%Utility gas
- 16.9%Electricity
- 3.5%No fuel used
- 1.6%Bottled, tank, or LP gas
- 1.5%Other fuel
- 0.7%Fuel oil, kerosene, etc.
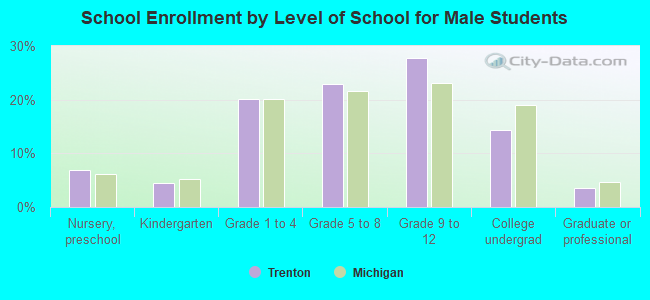
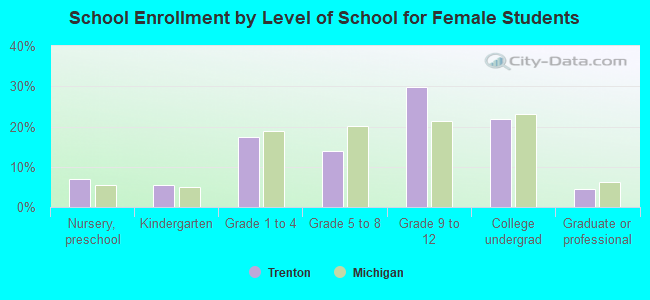
Private vs. public school enrollment:
| Here: | 11.5% |
| Michigan: | 12.4% |
| Here: | 8.2% |
| Michigan: | 9.8% |
| Here: | 14.8% |
| Michigan: | 14.9% |