Troy, IL (Illinois) Houses and Residents
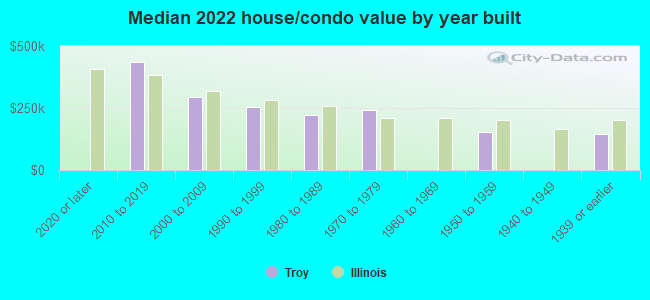
| Troy: | $249,118 |
| Illinois: | $251,600 |
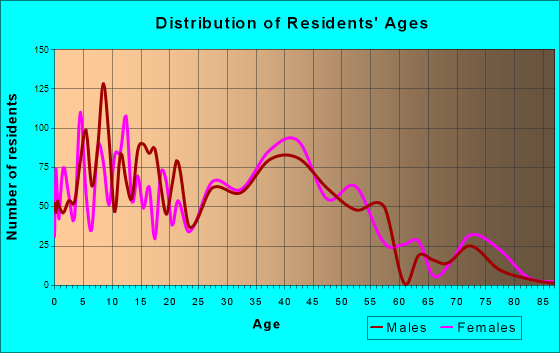
Total population: 9,996 (Urban population: 8,406, Rural population: 0)
Houses: 4,470 (4,261 occupied: 3,139 owner occupied, 1,150 renter occupied)
| % of renters here: | 27% |
| State: | 33% |
Housing density: 1,068 houses/condos per square mile
Median price asked for vacant for-sale houses and condos in 2022: $167,148.
Median contract rent in 2022: $797 (lower quartile is $692, upper quartile is $1,129)
Median rent asked for vacant for-rent units in 2022: $840
Median gross rent in Troy, IL in 2022: $943
Housing units in Troy with a mortgage: 2,078 (110 second mortgage, 0 home equity loan, 96 both second mortgage and home equity loan)
Houses without a mortgage: 30
Median household income for houses/condos with a mortgage: $123,778
Median household income for apartments without a mortgage: $66,784
Median monthly housing costs: $1,248
Compare current foreclosures near Troy, IL:
| Photo | Address | Area | Beds / Baths | Price | Details |
|---|---|---|---|---|---|

|
#1
Elmer St
Troy, IL 62294
|
1,520 sq. feet
|
1 baths 3 beds |
$220,000
|
show details |

|
#2
S Main St
Troy, IL 62294
|
1,620 sq. feet
|
2 baths 3 beds |
show details | |

|
#3
Eagles Way
Troy, IL 62294
|
912 sq. feet
|
1 baths 4 beds |
show details | |

|
#4
Michael Dr
Troy, IL 62294
|
3,032 sq. feet
|
1 baths - beds |
show details | |

|
#5
Olde Farm Rd
Troy, IL 62294
|
2,688 sq. feet
|
1 baths - beds |
show details | |

|
#6
Meadowlark St
Troy, IL 62294
|
2,515 sq. feet
|
2 baths - beds |
show details | |

|
#7
Turtle Crk
Troy, IL 62294
|
1,580 sq. feet
|
1 baths - beds |
show details | |

|
#8
Whip Poor Will St
Troy, IL 62294
|
1,676 sq. feet
|
2 baths - beds |
show details | |

|
#9
Bass Dr
Troy, IL 62294
|
1,734 sq. feet
|
1 baths - beds |
show details | |

|
#10
Fox Creek Dr
Troy, IL 62294
|
1,204 sq. feet
|
1 baths - beds |
show details |
| Photo | Address | Area | Beds / Baths | Price | Details |
|---|---|---|---|---|---|

|
#11
Weston St
Troy, IL 62294
|
864 sq. feet
|
- baths - beds |
show details | |

|
#12
Oakwood Dr
Troy, IL 62294
|
2,063 sq. feet
|
- baths - beds |
show details | |

|
#13
Wheatridge Dr
Troy, IL 62294
|
1,304 sq. feet
|
- baths - beds |
show details | |

|
#14
E Oak St # A
Troy, IL 62294
|
400 sq. feet
|
- baths - beds |
show details | |

|
#15
Lower Marine Rd # 3b
Troy, IL 62294
|
- sq. feet
|
- baths - beds |
show details | |

|
#16
Lake Dr
Troy, IL 62294
|
1,216 sq. feet
|
- baths - beds |
show details | |

|
#17
Collinsville Rd # B
Troy, IL 62294
|
- sq. feet
|
- baths - beds |
show details | |

|
#18
Blackjack Rd
Troy, IL 62294
|
- sq. feet
|
- baths - beds |
show details | |

|
#19
E Charter St # A
Troy, IL 62294
|
- sq. feet
|
- baths - beds |
show details | |

|
#20
Mockingbird St # B
Troy, IL 62294
|
2,808 sq. feet
|
- baths - beds |
show details |
| Photo | Address | Area | Beds / Baths | Price | Details |
|---|---|---|---|---|---|

|
#21
Wood Thrush St
Troy, IL 62294
|
- sq. feet
|
- baths - beds |
show details | |

|
#22
Meadow Dr Apt 46
Troy, IL 62294
|
- sq. feet
|
- baths - beds |
show details | |

|
#23
Sheridan St
Bethalto, IL 62010
|
940 sq. feet
|
1 baths 2 beds |
$139,900
|
show details |

|
#24
Grand Ave
Wood River, IL 62095
|
1,320 sq. feet
|
1 baths 4 beds |
$157,000
|
show details |

|
#25
West Blvd
Belleville, IL 62221
|
1,462 sq. feet
|
2 baths 2 beds |
$195,000
|
show details |

|
#26
Frey Ln
Fairview Heights, IL 62208
|
1,258 sq. feet
|
2 baths 3 beds |
$165,000
|
show details |

|
#27
N 15th St
Belleville, IL 62220
|
1,467 sq. feet
|
1 baths 4 beds |
$154,900
|
show details |

|
#28
Lothian Cir
Saint Louis, MO 63137
|
1,044 sq. feet
|
1 baths 2 beds |
$99,900
|
show details |

|
#29
Walnut Dr
Cottage Hills, IL 62018
|
657 sq. feet
|
1 baths 2 beds |
$35,000
|
show details |

|
#30
Hillcrest Dr
Glen Carbon, IL 62034
|
1,425 sq. feet
|
2 baths 3 beds |
$265,000
|
show details |
| Photo | Address | Area | Beds / Baths | Price | Details |
|---|---|---|---|---|---|

|
#31
Velma Ave
South Roxana, IL 62087
|
1,008 sq. feet
|
1 baths 3 beds |
$29,900
|
show details |

|
#32
W Adams St
O Fallon, IL 62269
|
905 sq. feet
|
1 baths 2 beds |
$172,000
|
show details |

|
#33
Lucinda Dr
Fairview Heights, IL 62208
|
1,040 sq. feet
|
2 baths 2 beds |
$157,900
|
show details |

|
#34
Fort Henry Rd
Belleville, IL 62221
|
1,800 sq. feet
|
2 baths 3 beds |
$229,000
|
show details |

|
#35
Diana St
Troy, IL 62294
|
- sq. feet
|
- baths - beds |
show details | |

|
#36
Parkside Dr
Troy, IL 62294
|
- sq. feet
|
- baths - beds |
show details | |

|
#37
Optimist Dr
Belleville, IL 62220
|
- sq. feet
|
1 baths 3 beds |
$57,200
|
show details |

|
#38
S 18th St
Belleville, IL 62226
|
- sq. feet
|
1 baths 4 beds |
$47,250
|
show details |

|
#39
Edwards St
Granite City, IL 62040
|
828 sq. feet
|
- baths 2 beds |
$39,900
|
show details |

|
#40
Pershing Blvd
Granite City, IL 62040
|
535 sq. feet
|
1 baths 1 beds |
show details |
| Photo | Address | Area | Beds / Baths | Price | Details |
|---|---|---|---|---|---|

|
#41
N 31st St
Belleville, IL 62226
|
- sq. feet
|
2 baths 3 beds |
show details | |

|
#42
S 34th St
Belleville, IL 62226
|
1,182 sq. feet
|
1 baths 2 beds |
show details | |

|
#43
N Park Dr
Belleville, IL 62226
|
1,392 sq. feet
|
1 baths 3 beds |
show details | |

|
#44
Nancy Ave
Granite City, IL 62040
|
1,056 sq. feet
|
1 baths 2 beds |
show details | |

|
#45
Castellano Dr
Belleville, IL 62226
|
1,066 sq. feet
|
1 baths 3 beds |
show details | |

|
#46
Cottage Hill Dr
O Fallon, IL 62269
|
- sq. feet
|
1 baths 3 beds |
show details | |

|
#47
Rusty Wil Dr
Belleville, IL 62220
|
724 sq. feet
|
1 baths 2 beds |
show details | |

|
#48
Moro Ave
Granite City, IL 62040
|
792 sq. feet
|
1 baths 2 beds |
show details | |

|
#49
N 80th St
East Saint Louis, IL 62203
|
952 sq. feet
|
1 baths 3 beds |
show details | |

|
Check over 1 million property listings on Foreclosure.com!
|
browse all offers | |||

Latest news about housing in Troy, IL collected exclusively by city-data.com from local newspapers, TV, and radio stations

 | Are rent prices down? (50 replies) |
| How bad does the ‘Illinois Exodus’ have to get? (260 replies) |
| Peoria, Illinois apartments (6 replies) |
| Chicago life vs Detroit life (116 replies) |
| Enjoyed my stay in Chicago (14 replies) |
| Is Troy, IL A Good Area To Live? (3 replies) |
Median year apartment built: 1988
Household type by relationship:
Households: 10,852- Male householders: 1,845 (443 living alone), Female householders: 2,372 (800 living alone)
2,352 spouses (2,343 opposite-sex spouses), 111 unmarried partners, (89 opposite-sex unmarried partners), 3,700 children (3,384 natural, 172 adopted, 143 stepchildren), 260 grandchildren, 22 brothers or sisters, 96 parents, 0 foster children, 54 other relatives, 35 non-relatives
Size of family households: 1,098 2-persons, 634 3-persons, 719 4-persons, 187 5-persons, 113 6-persons, 41 7-or-more-persons.
Size of nonfamily households: 1,350 1-person, 87 2-persons.
2,347 married couples with children.
476 single-parent households (59 men, 417 women).
95.1% of residents of Troy speak English at home.
3.4% of residents speak Spanish at home (77% speak English very well, 23% speak English well).
0.5% of residents speak other Indo-European language at home (100% speak English very well).
0.3% of residents speak Asian or Pacific Island language at home (32% speak English very well, 68% speak English well).
Foreign born population: 195 (1.8%)
(37.4% of them are naturalized citizens)
| Here: | 7.1 |
| State: | 6.4 |
| Here: | 4.0 |
| State: | 4.1 |
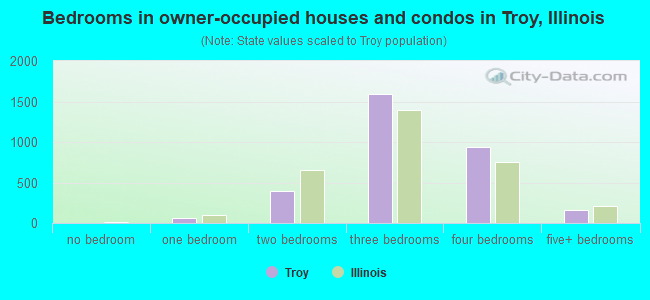
- Bedrooms in owner-occupied houses and condos in Troy, Illinois
- 0no bedroom
- 621 bedroom
- 3942 bedrooms
- 1,5873 bedrooms
- 9414 bedrooms
- 1565+ bedrooms
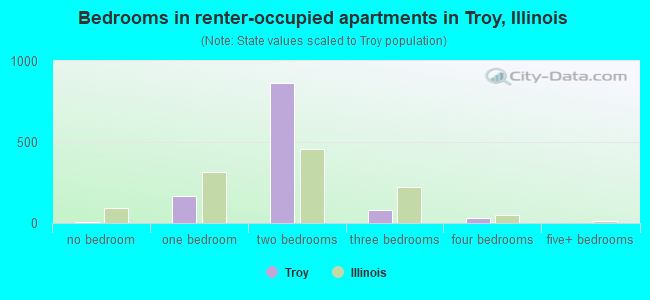
- Bedrooms in renter-occupied apartments in Troy, Illinois
- 9no bedroom
- 1671 bedroom
- 8622 bedrooms
- 813 bedrooms
- 314 bedrooms
- 05+ bedrooms
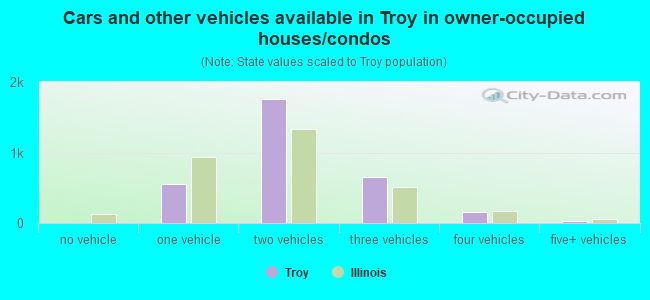
- Cars and other vehicles available in Troy in owner-occupied houses/condos
- 6no vehicle
- 5501 vehicle
- 1,7582 vehicles
- 6463 vehicles
- 1544 vehicles
- 265+ vehicles
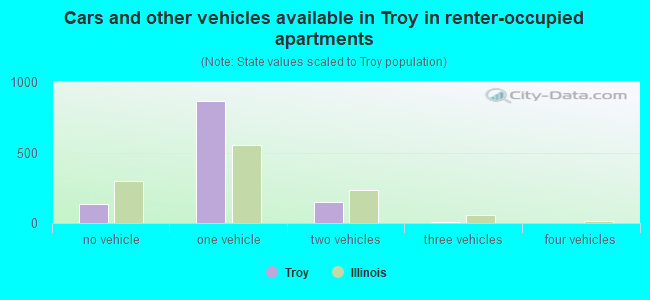
- Cars and other vehicles available in Troy in renter-occupied apartments
- 133no vehicle
- 8631 vehicle
- 1482 vehicles
- 53 vehicles
- 14 vehicles
- 05+ vehicles
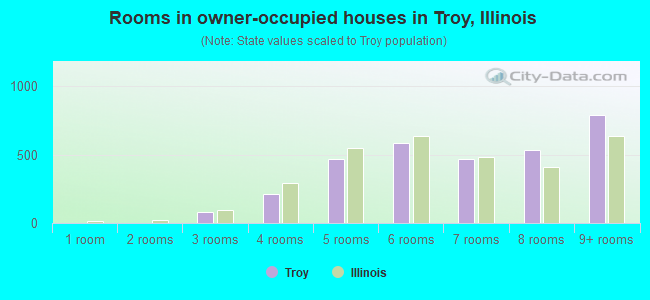
- Rooms in owner-occupied houses in Troy, Illinois
- 01 room
- 02 rooms
- 813 rooms
- 2164 rooms
- 4665 rooms
- 5846 rooms
- 4707 rooms
- 5318 rooms
- 7919+ rooms
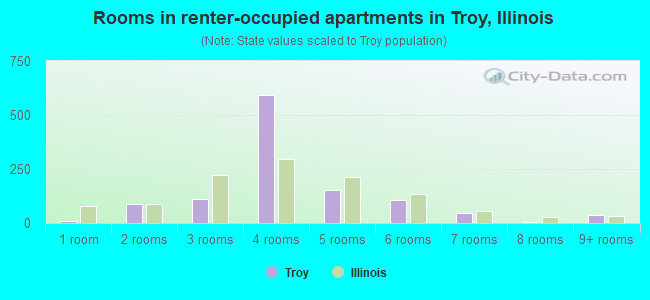
- Rooms in renter-occupied apartments in Troy, Illinois
- 91 room
- 902 rooms
- 1093 rooms
- 5944 rooms
- 1525 rooms
- 1066 rooms
- 467 rooms
- 58 rooms
- 389+ rooms
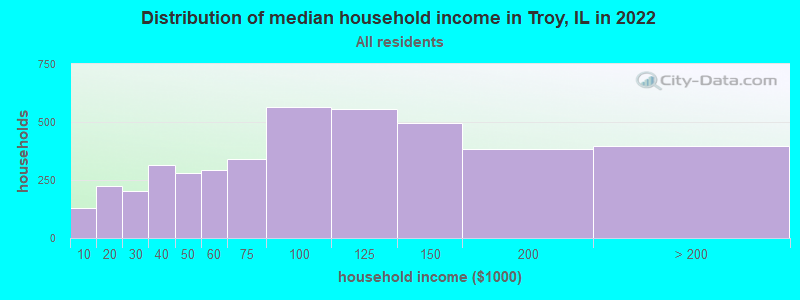
Troy, IL household income distribution

- 128Less than $10,000
- 224$10,000 to $19,999
- 201$20,000 to $29,999
- 315$30,000 to $39,999
- 281$40,000 to $49,999
- 293$50,000 to $59,999
- 341$60,000 to $74,999
- 563$75,000 to $99,999
- 557$100,000 to $124,999
- 497$125,000 to $149,999
- 384$150,000 to $199,999
- 396$200,000 or more
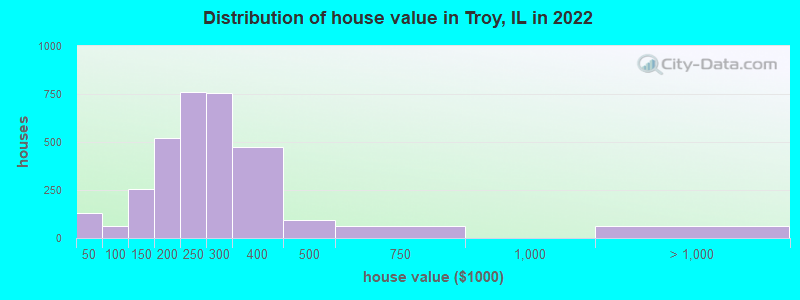
Home value of owner - occupied houses in 2022 in Troy, IL
-
- 11Less than $10,000
- 47$15,000 to $19,999
- 11$20,000 to $24,999
- 51$35,000 to $39,999
- 10$40,000 to $49,999
- 29$60,000 to $69,999
- 19$90,000 to $99,999
- 54$100,000 to $124,999
- 202$125,000 to $149,999
- 252$150,000 to $174,999
- 269$175,000 to $199,999
- 762$200,000 to $249,999
- 755$250,000 to $299,999
- 471$300,000 to $399,999
- 92$400,000 to $499,999
- 62$500,000 to $749,999
- 42$1,000,000 to $1,499,999
- 17$2,000,000 or more
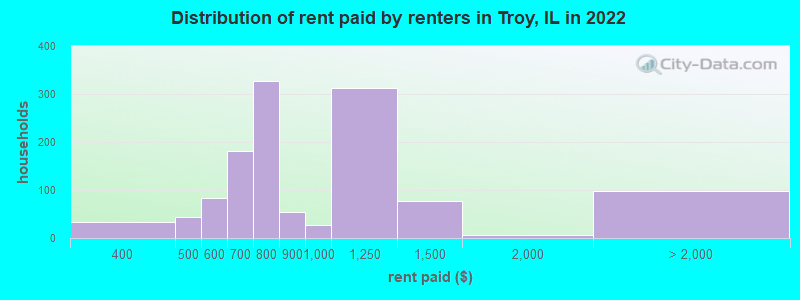
Rent paid by renters in 2022 in Troy, IL
-
- 32$300 to $349
- 42$400 to $449
- 70$500 to $549
- 12$550 to $599
- 70$600 to $649
- 111$650 to $699
- 272$700 to $749
- 55$750 to $799
- 55$800 to $899
- 27$900 to $999
- 311$1,000 to $1,249
- 77$1,250 to $1,499
- 7$1,500 to $1,999
- 51$3,500 or more
- 44No cash rent
Percentage of workers working in this county: 57.7%
Number of people working at home: 568 (10.7% of all workers)
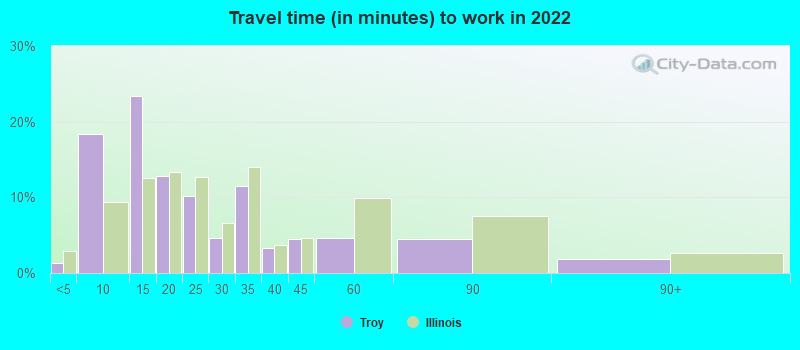
Travel time to work (commute)
- Less than 5 minutes: 19
- 5 to 9 minutes: 749
- 10 to 14 minutes: 577
- 15 to 19 minutes: 471
- 20 to 24 minutes: 705
- 25 to 29 minutes: 318
- 30 to 34 minutes: 949
- 35 to 39 minutes: 149
- 40 to 44 minutes: 299
- 45 to 59 minutes: 181
- 60 to 89 minutes: 127
- 90 or more minutes: 35
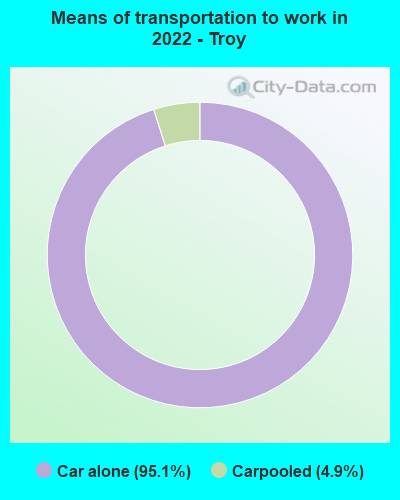
Means of transportation to work:
- Drove a car alone: 2,505 (78.3%)
- Carpooled: 129 (4.0%)
- Worked at home: 568 (17.8%)
- Unemployment by race in 2022
- Unemployment rate for White non-Hispanic residents
- 2.9%Males
- 1.8%Females
- Unemployment rate for other race residents
- 26.1%Males
- Unemployment rate for Hispanic or Latino residents
- 14.8%Males
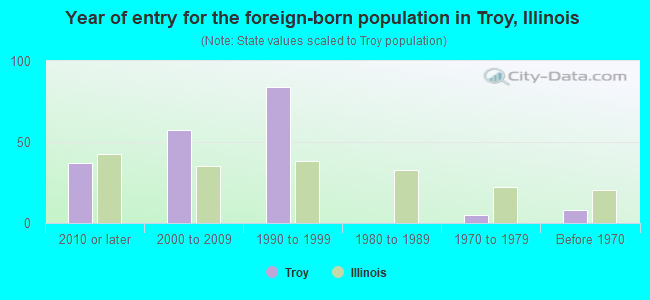
- Year of entry for the foreign-born population in Troy, Illinois
- 372010 or later
- 582000 to 2009
- 841990 to 1999
- 01980 to 1989
- 51970 to 1979
- 8Before 1970
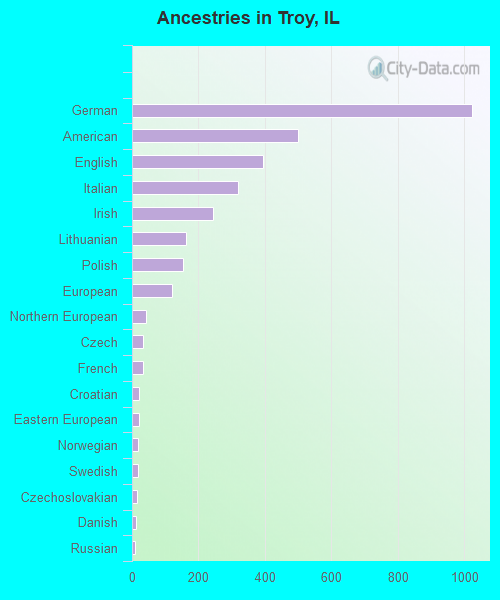
First ancestries reported:
- German: 1,023 (23.8%)
- American: 500 (11.6%)
- English: 395 (9.2%)
- Italian: 319 (7.4%)
- Irish: 245 (5.7%)
- Lithuanian: 161 (3.7%)
- Polish: 153 (3.6%)
- European: 119 (2.8%)
- Northern European: 42 (1.0%)
- Czech: 32 (0.7%)
- French: 32 (0.7%)
- Croatian: 22 (0.5%)
- Eastern European: 22 (0.5%)
- Norwegian: 18 (0.4%)
- Swedish: 18 (0.4%)
- Czechoslovakian: 15 (0.3%)
- Danish: 12 (0.3%)
- Russian: 10 (0.2%)
- Scottish: 9 (0.2%)
- Welsh: 9 (0.2%)
- Scandinavian: 6 (0.1%)
Most common places of birth for foreign-born residents (%):
| Troy: | 30.7% (61) |
| Illinois: | 34.7% (626,958) |
| Troy: | 20.6% (41) |
| Illinois: | 0.1% (1,902) |
| Troy: | 14.6% (29) |
| Illinois: | 2.2% (40,393) |
| Troy: | 14.1% (28) |
| Illinois: | 4.1% (74,364) |
| Troy: | 10.1% (20) |
| Illinois: | 0.5% (8,551) |
| Troy: | 4.5% (9) |
| Illinois: | 0.3% (5,895) |
| Troy: | 3.0% (6) |
| Illinois: | 1.3% (22,793) |
Place of birth for U.S.-born residents:
- This state: 7,847
- Other state: 2,736
- Northeast: 177
- Midwest: 1,848
- South: 409
- West: 314
86.1% of Troy residents lived in the same house 1 years ago.
Out of people who lived in different houses, 36.8% lived in this county.
Out of people who lived in different counties, 46.2% lived in Illinois.
| Troy: | 86.1% |
| State average: | 88.3% |
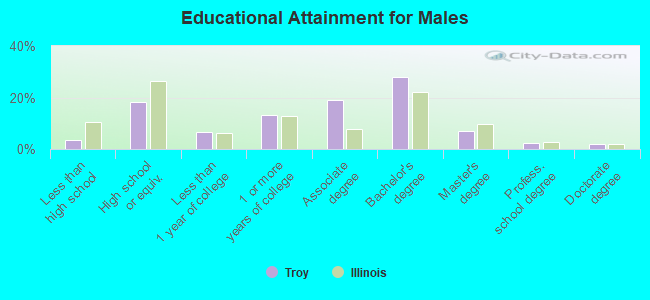
Education attainment for males 25 years and older:
- No schooling: 21
- Nursery to 4th grade: 0
- 5th and 6th grade: 0
- 7th and 8th grade: 0
- 9th grade: 25
- 10th grade: 7
- 11th grade: 62
- 12th grade, no diploma: 0
- High school graduate (or equivalency): 609
- Less than 1 year of college: 226
- Some college more than 1 year, no degree: 446
- Associate degree: 631
- Bachelor's degree: 933
- Master's degree: 240
- Professional school degree: 76
- Doctorate degree: 68
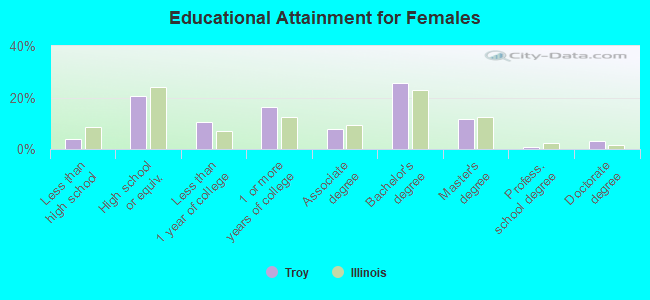
Education attainment for females 25 years and older:
- No schooling: 10
- Nursery to 4th grade: 0
- 5th and 6th grade: 0
- 7th and 8th grade: 50
- 9th grade: 0
- 10th grade: 11
- 11th grade: 18
- 12th grade, no diploma: 68
- High school graduate (or equivalency): 813
- Less than 1 year of college: 406
- Some college more than 1 year, no degree: 642
- Associate degree: 305
- Bachelor's degree: 1,001
- Master's degree: 462
- Professional school degree: 27
- Doctorate degree: 120
Housing units in structures:
- One, detached: 3,251
- One, attached: 280
- Two: 228
- 3 or 4: 313
- 5 to 9: 118
- 10 to 19: 10
- 20 to 49: 158
- 50 or more: 21
- Mobile homes: 89
Housing units lacking complete kitchen facilities in 2022: 3.3%
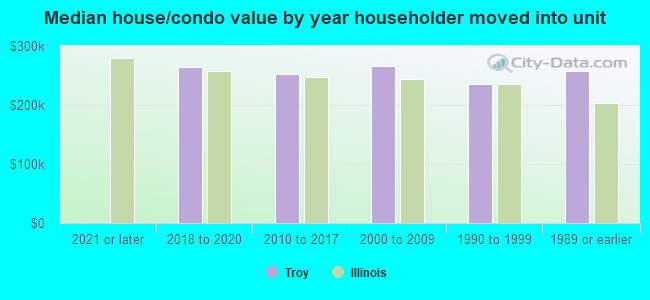
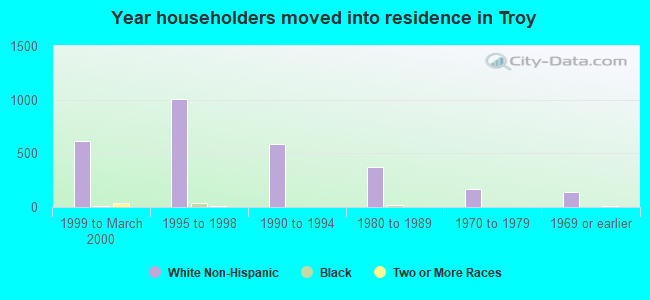
House/condo owner moved in on average 9 years ago
Renter moved in on average 2 years ago
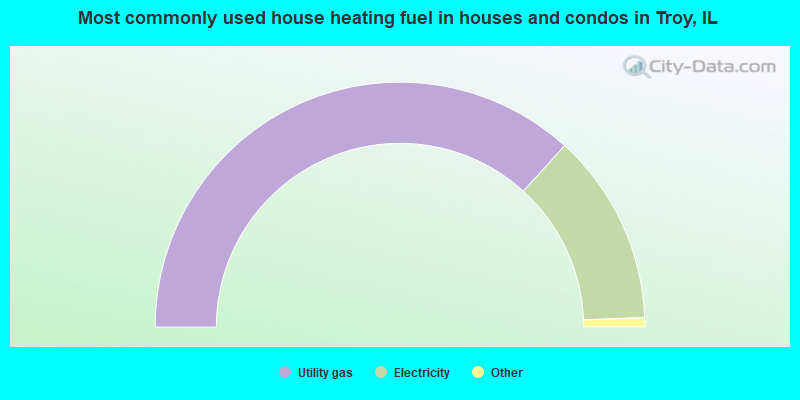
- 73.5%Utility gas
- 25.3%Electricity
- 0.8%No fuel used
- 0.3%Fuel oil, kerosene, etc.
- 0.2%Bottled, tank, or LP gas
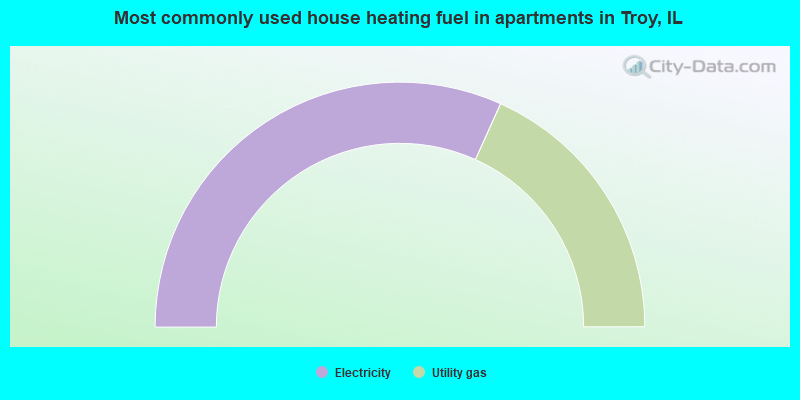
- 63.5%Electricity
- 36.5%Utility gas
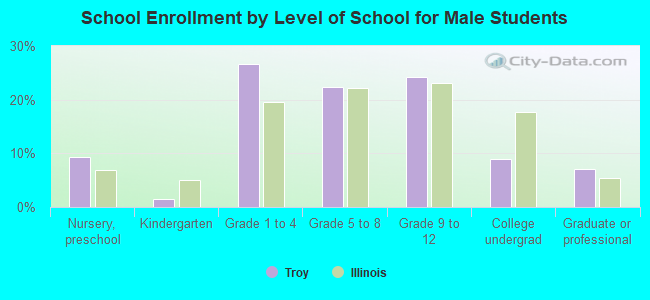
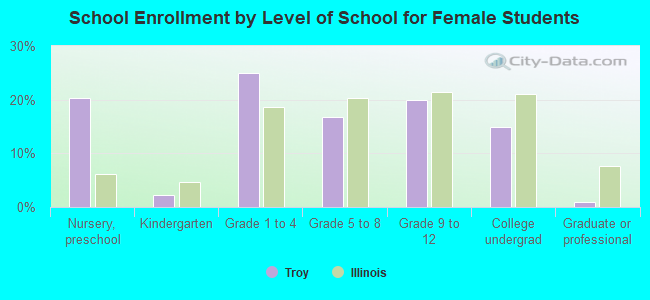
Private vs. public school enrollment:
| Here: | 16.9% |
| Illinois: | 13.3% |
| Here: | 12.1% |
| Illinois: | 9.9% |
| Here: | 4.8% |
| Illinois: | 27.4% |