Troy, PA (Pennsylvania) Houses and Residents
| Troy: | $155,744 |
| Pennsylvania: | $245,500 |
Total population: 1,283 (Urban population: 0, Rural population: 1,508 (all nonfarm))
Houses: 654 (583 occupied: 359 owner occupied, 228 renter occupied)
| % of renters here: | 39% |
| State: | 31% |
Housing density: 834 houses/condos per square mile
Median price asked for vacant for-sale houses and condos in 2022: $97,513.
Median contract rent in 2022: $495 (lower quartile is $350, upper quartile is $605)
Median rent asked for vacant for-rent units in 2022: $2,323
Median gross rent in Troy, PA in 2022: $597
Housing units in Troy with a mortgage: 203 (6 second mortgage, 0 home equity loan, 6 both second mortgage and home equity loan)
Houses without a mortgage: 40
Median household income for houses/condos with a mortgage: $78,537
Median household income for apartments without a mortgage: $58,838
Median monthly housing costs: $685
Compare current foreclosures near Troy, PA:
| Photo | Address | Area | Beds / Baths | Price | Details |
|---|---|---|---|---|---|

|
#1
Woodland Dr
Troy, PA 16947
|
- sq. feet
|
- baths - beds |
$1
|
show details |

|
#2
Sylvania Rd
Troy, PA 16947
|
- sq. feet
|
- baths - beds |
show details | |

|
#3
Route 14
Troy, PA 16947
|
- sq. feet
|
- baths - beds |
show details | |

|
#4
Route 14
Troy, PA 16947
|
- sq. feet
|
- baths - beds |
show details | |

|
#5
Route 154
Shunk, PA 17768
|
768 sq. feet
|
- baths 3 beds |
$190,500
|
show details |

|
#6
N Williamson Rd
Blossburg, PA 16912
|
1,316 sq. feet
|
1 baths 2 beds |
$39,900
|
show details |

|
#7
E South Ave
Canton, PA 17724
|
- sq. feet
|
- baths - beds |
$1
|
show details |

|
#8
Locust Rd
Gillett, PA 16925
|
- sq. feet
|
- baths - beds |
$1
|
show details |

|
#9
N Hill Ter
Mansfield, PA 16933
|
960 sq. feet
|
1 baths 3 beds |
show details | |

|
#10
Golden Ln
Ulster, PA 18850
|
- sq. feet
|
- baths - beds |
$1
|
show details |
| Photo | Address | Area | Beds / Baths | Price | Details |
|---|---|---|---|---|---|

|
#11
E Vanfleet Rd
Canton, PA 17724
|
- sq. feet
|
- baths - beds |
show details | |

|
#12
Little York Rd
Columbia Cross Roads, PA 16914
|
- sq. feet
|
- baths - beds |
show details | |

|
#13
Deery Hill Rd
Gillett, PA 16925
|
- sq. feet
|
- baths - beds |
show details | |

|
#14
Ulster Rd
Ulster, PA 18850
|
- sq. feet
|
- baths - beds |
show details | |

|
#15
S Main St
Mansfield, PA 16933
|
- sq. feet
|
- baths - beds |
show details | |

|
#16
Basket St
Columbia Cross Roads, PA 16914
|
- sq. feet
|
- baths - beds |
show details | |

|
#17
Troy St
Canton, PA 17724
|
- sq. feet
|
- baths - beds |
show details | |

|
#18
Extension St
Mansfield, PA 16933
|
- sq. feet
|
- baths - beds |
show details | |

|
Check over 1 million property listings on Foreclosure.com!
|
browse all offers | |||

Latest news about housing in Troy, PA collected exclusively by city-data.com from local newspapers, TV, and radio stations

 | Current Homes For Sale? (151 replies) |
| ‘Summer is going to be a good period for the housing market’ (57 replies) |
| Pittsburgh Area Development - Request for Info & Updates (932 replies) |
| Pittsburgh's average apartment asking rent now above $900 (101 replies) |
| Houses as cute as a button--and very historic, too! (187 replies) |
| Starter home..... (30 replies) |

Median year apartment built: 1968
Household type by relationship:
Households: 1,429- Male householders: 288 (85 living alone), Female householders: 287 (165 living alone)
264 spouses (256 opposite-sex spouses), 29 unmarried partners, (29 opposite-sex unmarried partners), 265 children (259 natural, 0 adopted, 4 stepchildren), 28 grandchildren, 3 brothers or sisters, 28 parents, 0 foster children, 54 other relatives, 81 non-relatives
- In group quarters: 93
Size of family households: 151 2-persons, 46 3-persons, 86 4-persons, 12 5-persons, 5 6-persons.
Size of nonfamily households: 260 1-person, 26 2-persons.
109 married couples with children.
35 single-parent households (10 men, 25 women).
86.5% of residents of Troy speak English at home.
13.3% of residents speak Spanish at home (18% speak English very well, 24% speak English well, 58% speak English not well).
0.1% of residents speak other Indo-European language at home (100% speak English very well).
1.0% of residents speak Asian or Pacific Island language at home (71% speak English very well, 29% speak English well).
Foreign born population: 174 (12.2%)
(94.3% of them are naturalized citizens)
| Here: | 6.6 |
| State: | 6.8 |
| Here: | 3.2 |
| State: | 4.3 |

- Bedrooms in owner-occupied houses and condos in Troy, Pennsylvania
- 0no bedroom
- 01 bedroom
- 572 bedrooms
- 2483 bedrooms
- 384 bedrooms
- 175+ bedrooms

- Bedrooms in renter-occupied apartments in Troy, Pennsylvania
- 23no bedroom
- 1331 bedroom
- 152 bedrooms
- 233 bedrooms
- 344 bedrooms
- 05+ bedrooms

- Cars and other vehicles available in Troy in owner-occupied houses/condos
- 3no vehicle
- 1291 vehicle
- 1242 vehicles
- 853 vehicles
- 154 vehicles
- 35+ vehicles

- Cars and other vehicles available in Troy in renter-occupied apartments
- 67no vehicle
- 1391 vehicle
- 172 vehicles
- 53 vehicles
- 04 vehicles
- 05+ vehicles

- Rooms in owner-occupied houses in Troy, Pennsylvania
- 01 room
- 02 rooms
- 03 rooms
- 454 rooms
- 385 rooms
- 896 rooms
- 857 rooms
- 328 rooms
- 729+ rooms

- Rooms in renter-occupied apartments in Troy, Pennsylvania
- 231 room
- 252 rooms
- 993 rooms
- 164 rooms
- 105 rooms
- 326 rooms
- 27 rooms
- 88 rooms
- 129+ rooms


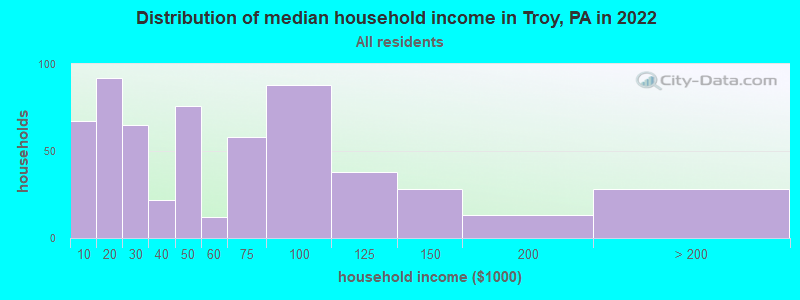
Troy, PA household income distribution

- 67Less than $10,000
- 92$10,000 to $19,999
- 65$20,000 to $29,999
- 22$30,000 to $39,999
- 76$40,000 to $49,999
- 12$50,000 to $59,999
- 58$60,000 to $74,999
- 88$75,000 to $99,999
- 38$100,000 to $124,999
- 28$125,000 to $149,999
- 13$150,000 to $199,999
- 28$200,000 or more
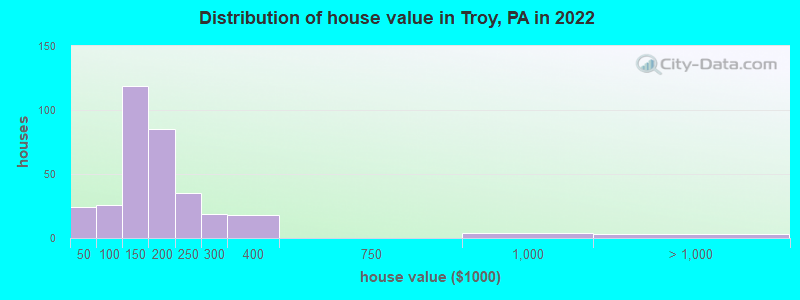
Home value of owner - occupied houses in 2022 in Troy, PA
-
- 20$20,000 to $24,999
- 4$40,000 to $49,999
- 1$50,000 to $59,999
- 5$70,000 to $79,999
- 10$80,000 to $89,999
- 4$90,000 to $99,999
- 76$100,000 to $124,999
- 42$125,000 to $149,999
- 67$150,000 to $174,999
- 17$175,000 to $199,999
- 35$200,000 to $249,999
- 18$250,000 to $299,999
- 18$300,000 to $399,999
- 3$750,000 to $999,999
- 2$2,000,000 or more
Rent paid by renters in 2022 in Troy, PA
-
- 19$150 to $199
- 10$200 to $249
- 11$250 to $299
- 11$300 to $349
- 15$350 to $399
- 17$400 to $449
- 21$450 to $499
- 37$500 to $549
- 15$550 to $599
- 9$600 to $649
- 6$700 to $749
- 6$750 to $799
- 6$800 to $899
- 12$900 to $999
- 5$1,000 to $1,249
- 20No cash rent


Percentage of workers working in this county: 82.0%
Number of people working at home: 37 (5.7% of all workers)
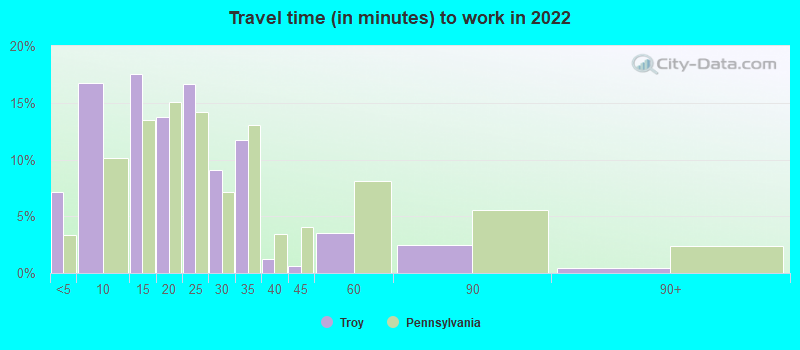
Travel time to work (commute)
- Less than 5 minutes: 77
- 5 to 9 minutes: 216
- 10 to 14 minutes: 47
- 15 to 19 minutes: 28
- 20 to 24 minutes: 39
- 25 to 29 minutes: 30
- 30 to 34 minutes: 73
- 35 to 39 minutes: 8
- 40 to 44 minutes: 5
- 45 to 59 minutes: 37
- 60 to 89 minutes: 23
- 90 or more minutes: 6
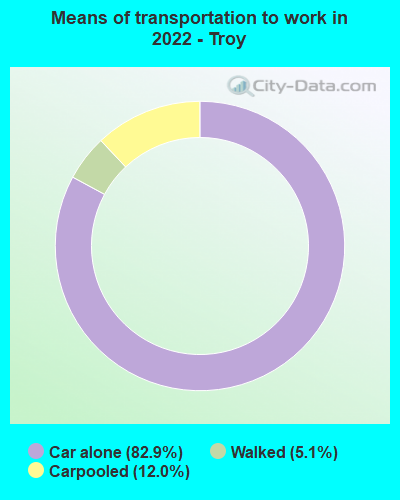
Means of transportation to work:
- Drove a car alone: 1,317 (78.8%)
- Carpooled: 189 (11.3%)
- Walked: 81 (4.8%)
- Worked at home: 37 (2.2%)

- Unemployment by race in 2022
- Unemployment rate for White non-Hispanic residents
- 1.4%Males
- 0.8%Females

- Year of entry for the foreign-born population in Troy, Pennsylvania
- 1062010 or later
- 02000 to 2009
- 601990 to 1999
- 41980 to 1989
- 41970 to 1979
- 17Before 1970

First ancestries reported:
- English: 192 (28.2%)
- American: 54 (7.9%)
- German: 51 (7.5%)
- Irish: 51 (7.5%)
- African: 18 (2.6%)
- Canadian: 15 (2.2%)
- Italian: 14 (2.1%)
- Ukrainian: 13 (1.9%)
- Polish: 11 (1.6%)
- Scottish: 10 (1.5%)
- Northern European: 8 (1.2%)
- European: 6 (0.9%)
- Slovak: 5 (0.7%)
- Welsh: 5 (0.7%)
- Danish: 4 (0.6%)
- French: 3 (0.4%)
- Slovene: 3 (0.4%)
- Swedish: 3 (0.4%)
- British: 2 (0.3%)
- Dutch: 2 (0.3%)
- Pennsylvania German: 1 (0.1%)
Most common places of birth for foreign-born residents (%):
| Troy: | 73.6% (128) |
| Pennsylvania: | 5.8% (54,190) |
| Troy: | 5.7% (10) |
| Pennsylvania: | 0.6% (5,742) |
| Troy: | 5.2% (9) |
| Pennsylvania: | 0.9% (8,463) |
| Troy: | 2.9% (5) |
| Pennsylvania: | 0.5% (4,648) |
| Troy: | 2.3% (4) |
| Pennsylvania: | 2.2% (21,039) |
| Troy: | 2.3% (4) |
| Pennsylvania: | 1.0% (9,205) |
| Troy: | 1.7% (3) |
| Pennsylvania: | 0.5% (4,593) |
| Troy: | 1.7% (3) |
| Pennsylvania: | 1.1% (10,331) |
Place of birth for U.S.-born residents:
- This state: 904
- Other state: 343
- Northeast: 188
- Midwest: 25
- South: 124
- West: 3
78.9% of Troy residents lived in the same house 1 years ago.
Out of people who lived in different houses, 38.2% lived in this county.
Out of people who lived in different counties, 80.7% lived in Pennsylvania.
| Troy: | 78.9% |
| State average: | 89.3% |
Education attainment for males 25 years and older:
- No schooling: 0
- Nursery to 4th grade: 0
- 5th and 6th grade: 7
- 7th and 8th grade: 9
- 9th grade: 0
- 10th grade: 0
- 11th grade: 5
- 12th grade, no diploma: 86
- High school graduate (or equivalency): 180
- Less than 1 year of college: 19
- Some college more than 1 year, no degree: 38
- Associate degree: 47
- Bachelor's degree: 82
- Master's degree: 19
- Professional school degree: 4
- Doctorate degree: 2

Education attainment for females 25 years and older:
- No schooling: 38
- Nursery to 4th grade: 0
- 5th and 6th grade: 0
- 7th and 8th grade: 0
- 9th grade: 0
- 10th grade: 7
- 11th grade: 5
- 12th grade, no diploma: 3
- High school graduate (or equivalency): 328
- Less than 1 year of college: 35
- Some college more than 1 year, no degree: 23
- Associate degree: 52
- Bachelor's degree: 80
- Master's degree: 20
- Professional school degree: 40
- Doctorate degree: 20


Housing units in structures:
- One, detached: 428
- One, attached: 16
- Two: 58
- 3 or 4: 45
- 5 to 9: 20
- 10 to 19: 4
- 20 to 49: 81
House/condo owner moved in on average 13 years ago
Renter moved in on average 3 years ago

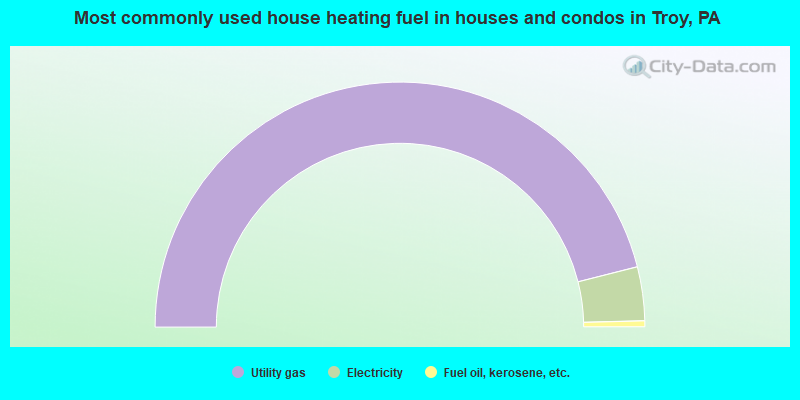
- 92.1%Utility gas
- 7.1%Electricity
- 0.8%Fuel oil, kerosene, etc.
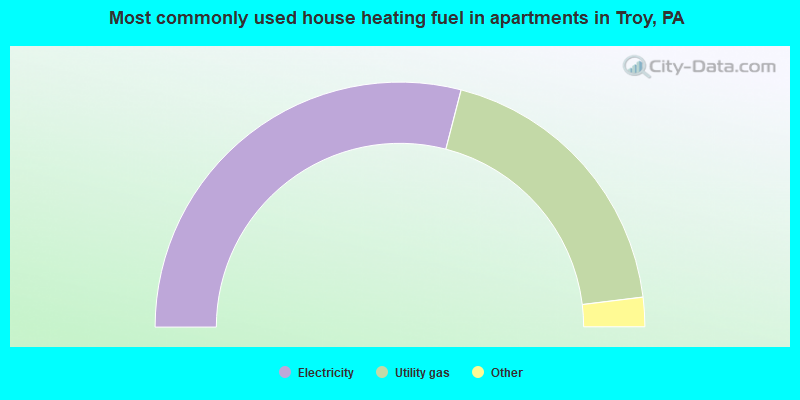
- 58.5%Electricity
- 38.4%Utility gas
- 1.8%No fuel used
- 1.3%Other fuel
Private vs. public school enrollment:
| Here: | 4.4% |
| Pennsylvania: | 15.7% |
| Here: | 8.8% |
| Pennsylvania: | 13.4% |
| Here: | 0.0% |
| Pennsylvania: | 39.8% |


