Tukwila, WA (Washington) Houses and Residents
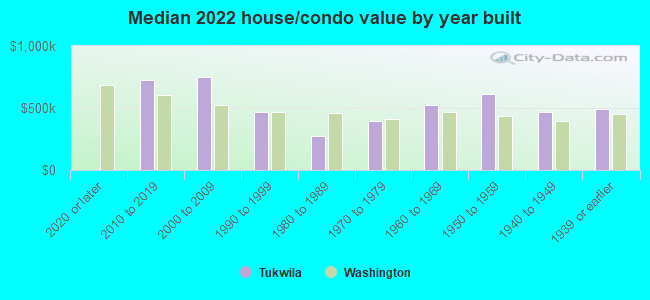
Estimated median house or condo value in 2022: $504,979 (it was $140,700 in 2000 )
Tukwila:
$504,979Washington:
$569,500
Lower value quartile - upper value quartile: $329,548 - $688,505Mean price in 2022: Detached houses: $605,729 Here:
$605,729State:
$734,307
Townhouses or other attached units: $575,145 Here:
$575,145State:
$657,697
In 2-unit structures: $466,128 Here:
$466,128State:
$534,634
In 3-to-4-unit structures: $255,128 Here:
$255,128State:
$510,239
In 5-or-more-unit structures: $221,186 Here:
$221,186State:
$503,183
Mobile homes: $101,370 Here:
$101,370State:
$218,362
Total population: 19,920 (Urban population: 17,154, Rural population: 50 (all nonfarm) )
Houses: 8,936 (8,363 occupied: 3,542 owner occupied, 4,809 renter occupied )
% of renters here:
58%State:
36%
Housing density: 1,002 houses/condos per square mile
Median price asked for vacant for-sale houses and condos in 2022: $459,702.
Median contract rent in 2022: $1,484 (lower quartile is $1,168, upper quartile is $1,854)
Median rent asked for vacant for-rent units in 2022: $1,899
Median gross rent in Tukwila, WA in 2022: $1,668
Housing units in Tukwila with a mortgage: 2,186 (138 second mortgage, 2 home equity loan, 122 both second mortgage and home equity loan )Houses without a mortgage: 0
Median household income for houses/condos with a mortgage: $119,112
Median household income for apartments without a mortgage: $64,543
Median monthly housing costs: $1,641
Data:
Median house or condo value ($)
Median house or condo value ($ change since 2000)
Median house or condo value ($) - White
Median house or condo value ($) - Black or African American
Median house or condo value ($) - Asian
Median house or condo value ($) - Hispanic or Latino
Median house or condo value ($) - American Indian and Alaska Native
Median house or condo value ($) - Multirace
Median house or condo value ($) - Other Race
Median price asked for mobile homes ($)
Household density (households per square mile)
Mean house or condo value by units in structure - 1, detached ($)
Mean house or condo value by units in structure - 1, attached ($)
Mean house or condo value by units in structure - 2 ($)
Mean house or condo value by units in structure by units in structure - 3 or 4 ($)
Mean house or condo value by units in structure - 5 or more ($)
Mean house or condo value by units in structure - Boat, RV, van, etc. ($)
Mean house or condo value by units in structure - Mobile home ($)
Median contract rent ($)
Median contract rent - Lower quartile ($)
Median contract rent - Upper quartile ($)
Median gross rent ($)
Urban houses (%)
Rural houses (%)
Houses occupied (%)
Houses occupied (% change since 2000)
Houses owner occupied (%)
Houses owner occupied (% change since 2000)
Houses renter occupied (%)
Houses renter occupied (% change since 2000)
Vacant housing units - For rent (%)
Vacant housing units - For rent (% change since 2000)
Vacant housing units - For sale only (%)
Vacant housing units - For sale only (% change since 2000)
Vacant housing units - Rented or sold, not occupied (%)
Vacant housing units - Rented or sold, not occupied (% change since 2000)
Vacant housing units - For seasonal, recreational, or occasional use (%)
Vacant housing units - For seasonal, recreational, or occasional use (% change since 2000)
Vacant housing units - For migrant workers (%)
Vacant housing units - For migrant workers (% change since 2000)
Vacant housing units - Other vacant (%)
Vacant housing units - Other vacant (% change since 2000)
Median monthly housing costs ($)
Median household income for houses/condos with a mortgage ($)
Median household income for houses/condos without a mortgage ($)
Median household income ($)
Median household income ($) - White
Median household income ($) - Black or African American
Median household income ($) - Asian
Median household income ($) - Hispanic or Latino
Median household income ($) - American Indian and Alaska Native
Median household income ($) - Multirace
Median household income ($) - Other Race
Mortgage status - with mortgage (%)
Mortgage status - with second mortgage (%)
Mortgage status - with home equity loan (%)
Mortgage status - with both second mortgage and home equity loan (%)
Mortgage status - without a mortgage (%)
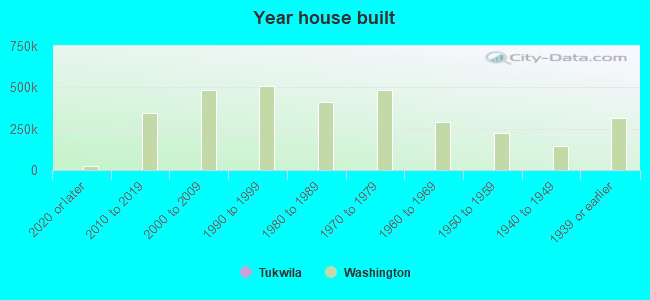
Median year house/condo built
Median year apartment built
Household type by relationship - Male householder living alone (%)
Household type by relationship - Male householder not living alone (%)
Household type by relationship - Female householder living alone (%)
Household type by relationship - Female householder not living alone (%)
Household type by relationship - Opposite-Sex spouse (%)
Household type by relationship - Same-Sex spouse (%)
Household type by relationship - Opposite-Sex unmarried partner (%)
Household type by relationship - Same-Sex unmarried partner (%)
Household type by relationship - In group quarters (%)
Size of family households - 2-person household (%)
Size of family households - 3-person household (%)
Size of family households - 4-person household (%)
Size of family households - 5-person household (%)
Size of family households - 6-person household (%)
Size of family households - 7-or-more-person household (%)
Size of nonfamily households - 1-person household (%)
Size of nonfamily households - 2-person household (%)
Size of nonfamily households - 3-person household (%)
Size of nonfamily households - 4-person household (%)
Size of nonfamily households - 5-person household (%)
Size of nonfamily households - 6-person household (%)
Size of nonfamily households - 7-or-moreperson household (%)
Year house built - Built 2010 or later (%)
Year house built - Built 2000 to 2009 (%)
Year house built - Built 1990 to 1999 (%)
Year house built - Built 1980 to 1989 (%)
Year house built - Built 1970 to 1979 (%)
Year house built - Built 1960 to 1969 (%)
Year house built - Built 1950 to 1959 (%)
Year house built - Built 1940 to 1949 (%)
Year house built - Built 1939 or earlier (%)
Median number of rooms in houses and condos
Median number of rooms in apartments
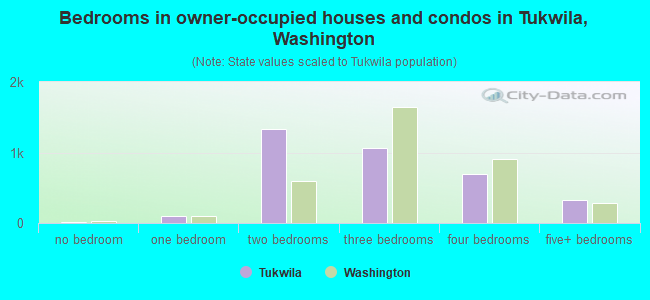
Median number of bedrooms in owner occupied houses
Mean number of bedrooms in owner occupied houses
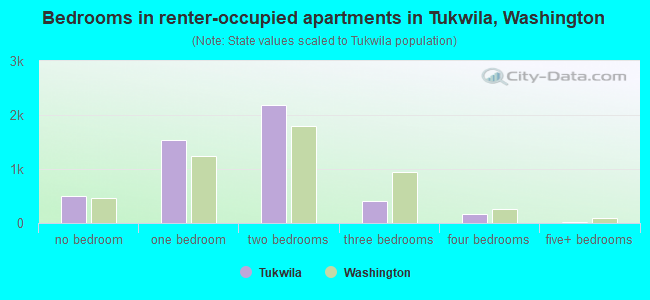
Median number of bedrooms in renter occupied houses
Mean number of bedrooms in renter occupied houses
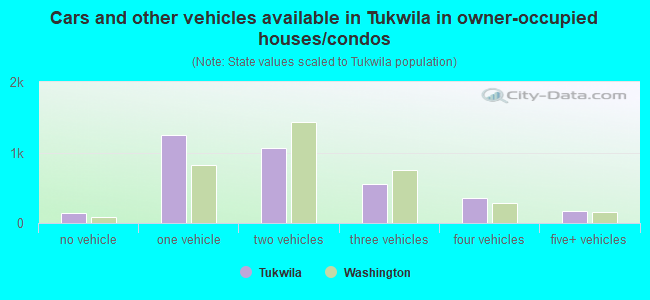
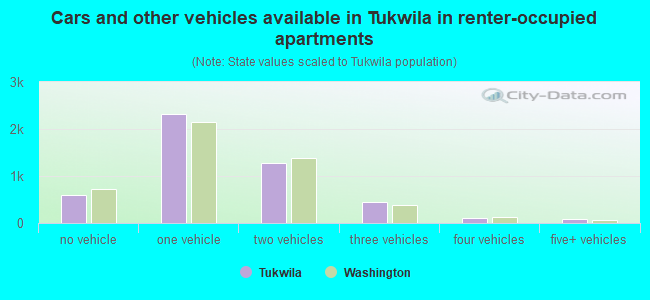
Median number of vehichles in owner occupied houses
Mean number of vehichles in owner occupied houses
Median number of vehichles in renter occupied houses
Mean number of vehichles in renter occupied houses
Rooms in owner-occupied houses - 1 room (%)
Rooms in owner-occupied houses - 2 rooms (%)
Rooms in owner-occupied houses - 3 rooms (%)
Rooms in owner-occupied houses - 4 rooms (%)
Rooms in owner-occupied houses - 5 rooms (%)
Rooms in owner-occupied houses - 6 rooms (%)
Rooms in owner-occupied houses - 7 rooms (%)
Rooms in owner-occupied houses - 8 rooms (%)
Rooms in owner-occupied houses - 9+ rooms (%)
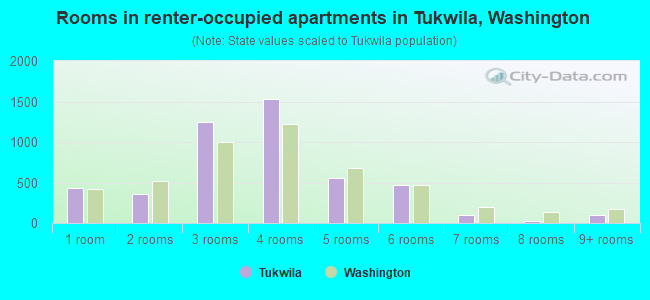
Rooms in renter-occupied houses - 1 room (%)
Rooms in renter-occupied houses - 2 rooms (%)
Rooms in renter-occupied houses - 3 rooms (%)
Rooms in renter-occupied houses - 4 rooms (%)
Rooms in renter-occupied houses - 5 rooms (%)
Rooms in renter-occupied houses - 6 rooms (%)
Rooms in renter-occupied houses - 7 rooms (%)
Rooms in renter-occupied houses - 8 rooms (%)
Rooms in renter-occupied houses - 9+ rooms (%)
Bedrooms in owner-occupied houses - no bedrooms (%)
Bedrooms in owner-occupied houses - 1 bedroom (%)
Bedrooms in owner-occupied houses - 2 bedrooms (%)
Bedrooms in owner-occupied houses - 3 bedrooms (%)
Bedrooms in owner-occupied houses - 4 bedrooms (%)
Bedrooms in owner-occupied houses - 5+ bedrooms (%)
Bedrooms in renter-occupied houses - no bedrooms (%)
Bedrooms in renter-occupied houses - 1 bedroom (%)
Bedrooms in renter-occupied houses - 2 bedrooms (%)
Bedrooms in renter-occupied houses - 3 bedrooms (%)
Bedrooms in renter-occupied houses - 4 bedrooms (%)
Bedrooms in renter-occupied houses - 5+ bedrooms (%)
Vehicles available in owner-occupied houses - no vehicle available (%)
Vehicles available in owner-occupied houses - 1 vehicle available(%)
Vehicles available in owner-occupied houses - 2 Vehicles available (%)
Vehicles available in owner-occupied houses - 3 Vehicles available (%)
Vehicles available in owner-occupied houses - 4 Vehicles available (%)
Vehicles available in owner-occupied houses - 5+ Vehicles available (%)
Vehicles available in renter-occupied houses - no vehicle available (%)
Vehicles available in renter-occupied houses - 1 vehicle available (%)
Vehicles available in renter-occupied houses - 2 Vehicles available (%)
Vehicles available in renter-occupied houses - 3 Vehicles available (%)
Vehicles available in renter-occupied houses - 4 Vehicles available (%)
Vehicles available in renter-occupied houses - 5+ Vehicles available (%)
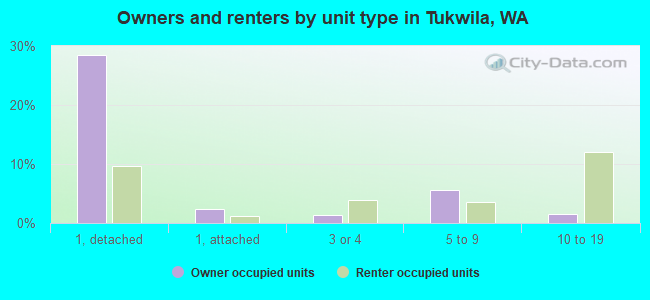
Housing units in structures - 1, detached (%)
Housing units in structures - 1, attached (%)
Housing units in structures - 2 (%)
Housing units in structures - 3 or 4 (%)
Housing units in structures - 5 to 9 (%)
Housing units in structures - 10 to 19 (%)
Housing units in structures - 20 to 49 (%)
Housing units in structures - 50 or more (%)
Housing units in structures - Mobile home (%)
Housing units in structures - Boat, RV, van, etc. (%)
Housing units in structures - Owners - 1, detached (%)
Housing units in structures - Owners - 1, attached (%)
Housing units in structures - Owners - 2 (%)
Housing units in structures - Owners - 3 or 4 (%)
Housing units in structures - Owners - 5 to 9 (%)
Housing units in structures - Owners - 10 to 19 (%)
Housing units in structures - Owners - 20 to 49 (%)
Housing units in structures - Owners - 50 or more (%)
Housing units in structures - Owners - Mobile home (%)
Housing units in structures - Owners - Boat, RV, van, etc. (%)
Housing units in structures - Renters - 1, detached (%)
Housing units in structures - Renters - 1, attached (%)
Housing units in structures - Renters - 2 (%)
Housing units in structures - Renters - 3 or 4 (%)
Housing units in structures - Renters - 5 to 9 (%)
Housing units in structures - Renters - 10 to 19 (%)
Housing units in structures - Renters - 20 to 49 (%)
Housing units in structures - Renters - 50 or more (%)
Housing units in structures - Renters - Mobile home (%)
Housing units in structures - Renters - Boat, RV, van, etc. (%)
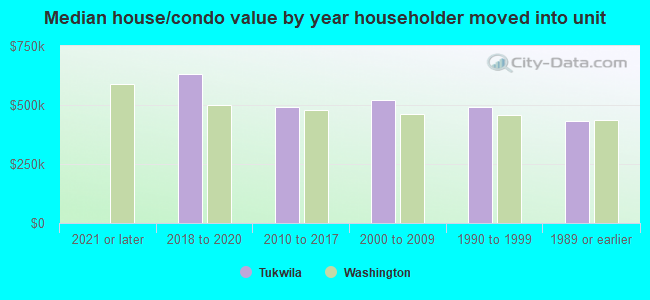
House/condo owner moved in on average (years ago)
Renter moved in on average (years ago)
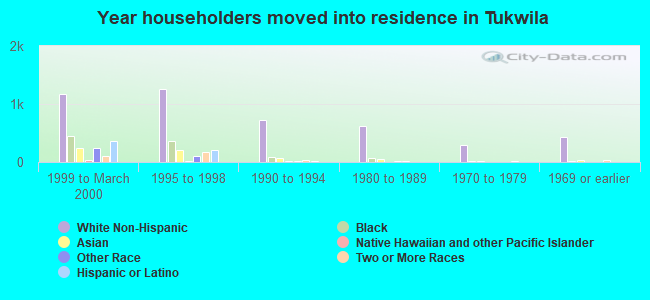
Year householder moved into unit - Moved in 1999 to March 2000 (%)
Year householder moved into unit - Moved in 1999 to March 2000 (%) - White
Year householder moved into unit - Moved in 1999 to March 2000 (%) - Black or African American
Year householder moved into unit - Moved in 1999 to March 2000 (%) - Asian
Year householder moved into unit - Moved in 1999 to March 2000 (%) - Hispanic or Latino
Year householder moved into unit - Moved in 1999 to March 2000 (%) - American Indian and Alaska Native
Year householder moved into unit - Moved in 1999 to March 2000 (%) - Multirace
Year householder moved into unit - Moved in 1999 to March 2000 (%) - Other Race
Year householder moved into unit - Moved in 1995 to 1998 (%)
Year householder moved into unit - Moved in 1995 to 1998 (%) - White
Year householder moved into unit - Moved in 1995 to 1998 (%) - Black or African American
Year householder moved into unit - Moved in 1995 to 1998 (%) - Asian
Year householder moved into unit - Moved in 1995 to 1998 (%) - Hispanic or Latino
Year householder moved into unit - Moved in 1995 to 1998 (%) - American Indian and Alaska Native
Year householder moved into unit - Moved in 1995 to 1998 (%) - Multirace
Year householder moved into unit - Moved in 1995 to 1998 (%) - Other Race
Year householder moved into unit - Moved in 1990 to 1994 (%)
Year householder moved into unit - Moved in 1990 to 1994 (%) - White
Year householder moved into unit - Moved in 1990 to 1994 (%) - Black or African American
Year householder moved into unit - Moved in 1990 to 1994 (%) - Asian
Year householder moved into unit - Moved in 1990 to 1994 (%) - Hispanic or Latino
Year householder moved into unit - Moved in 1990 to 1994 (%) - American Indian and Alaska Native
Year householder moved into unit - Moved in 1990 to 1994 (%) - Multirace
Year householder moved into unit - Moved in 1990 to 1994 (%) - Other Race
Year householder moved into unit - Moved in 1980 to 1989 (%)
Year householder moved into unit - Moved in 1980 to 1989 (%) - White
Year householder moved into unit - Moved in 1980 to 1989 (%) - Black or African American
Year householder moved into unit - Moved in 1980 to 1989 (%) - Asian
Year householder moved into unit - Moved in 1980 to 1989 (%) - Hispanic or Latino
Year householder moved into unit - Moved in 1980 to 1989 (%) - American Indian and Alaska Native
Year householder moved into unit - Moved in 1980 to 1989 (%) - Multirace
Year householder moved into unit - Moved in 1980 to 1989 (%) - Other Race
Year householder moved into unit - Moved in 1970 to 1979 (%)
Year householder moved into unit - Moved in 1970 to 1979 (%) - White
Year householder moved into unit - Moved in 1970 to 1979 (%) - Black or African American
Year householder moved into unit - Moved in 1970 to 1979 (%) - Asian
Year householder moved into unit - Moved in 1970 to 1979 (%) - Hispanic or Latino
Year householder moved into unit - Moved in 1970 to 1979 (%) - American Indian and Alaska Native
Year householder moved into unit - Moved in 1970 to 1979 (%) - Multirace
Year householder moved into unit - Moved in 1970 to 1979 (%) - Other Race
Year householder moved into unit - Moved in 1969 or earlier (%)
Year householder moved into unit - Moved in 1969 or earlier (%) - White
Year householder moved into unit - Moved in 1969 or earlier (%) - Black or African American
Year householder moved into unit - Moved in 1969 or earlier (%) - Asian
Year householder moved into unit - Moved in 1969 or earlier (%) - Hispanic or Latino
Year householder moved into unit - Moved in 1969 or earlier (%) - American Indian and Alaska Native
Year householder moved into unit - Moved in 1969 or earlier (%) - Multirace
Year householder moved into unit - Moved in 1969 or earlier (%) - Other Race
Housing units lacking complete plumbing facilities (%)
Housing units lacking complete kitchen facilities (%)
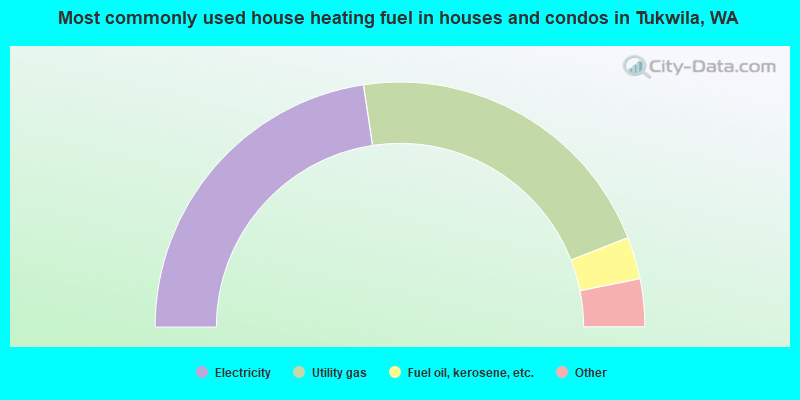
House heating fuel used in houses and condos - Utility gas (%)
House heating fuel used in houses and condos - Bottled, tank, or LP gas (%)
House heating fuel used in houses and condos - Electricity (%)
House heating fuel used in houses and condos - Fuel oil, kerosene, etc. (%)
House heating fuel used in houses and condos - Coal or coke (%)
House heating fuel used in houses and condos - Wood (%)
House heating fuel used in houses and condos - Solar energy (%)
House heating fuel used in houses and condos - Other fuel (%)
House heating fuel used in houses and condos - No fuel used (%)
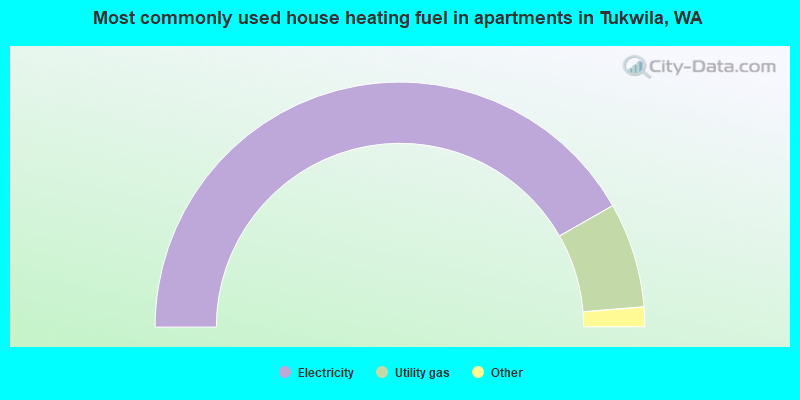
House heating fuel used in apartments - Utility gas (%)
House heating fuel used in apartments - Bottled, tank, or LP gas (%)
House heating fuel used in apartments - Electricity (%)
House heating fuel used in apartments - Fuel oil, kerosene, etc. (%)
House heating fuel used in apartments - Coal or coke (%)
House heating fuel used in apartments - Wood (%)
House heating fuel used in apartments - Solar energy (%)
House heating fuel used in apartments - Other fuel (%)
House heating fuel used in apartments - No fuel used (%)
Latest news about housing in Tukwila, WA collected exclusively by city-data.com from local newspapers, TV, and radio stations
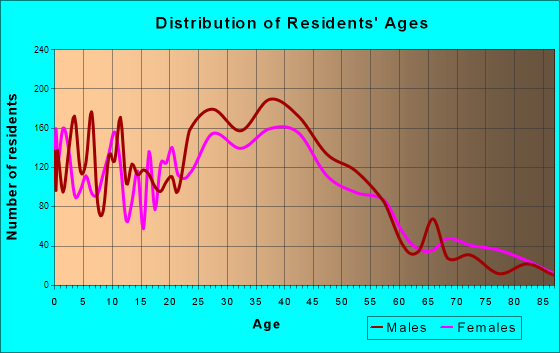
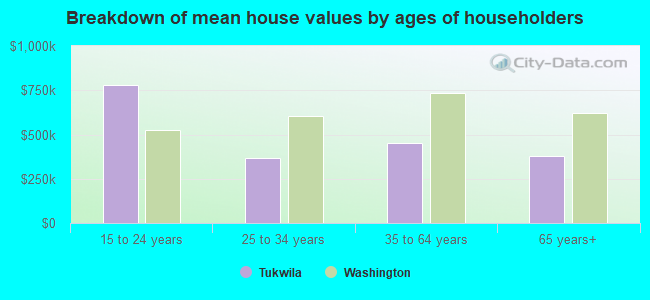
Median year house/condo built: 1966Median year apartment built: 1979Household type by relationship:
Households: 21,687
Male householders: 5,005 (1,476 living alone ), Female householders: 3,137 (958 living alone )3,088 spouses (3,088 opposite-sex spouses ), 925 unmarried partners , (836 opposite-sex unmarried partners ), 5,484 children (5,185 natural , 88 adopted , 210 stepchildren ), 434 grandchildren , 575 brothers or sisters , 854 parents , 0 foster children , 703 other relatives , 1,278 non-relatives In group quarters: 201
Size of family households: 1,828 2-persons , 931 3-persons , 954 4-persons , 516 5-persons , 206 6-persons , 269 7-or-more-persons .
Size of nonfamily households: 2,617 1-person , 720 2-persons , 214 3-persons , 55 4-persons , 8 7-or-more-persons .
1,922 married couples with children. single-parent households (590 men , 686 women ).
51.2% of residents of Tukwila speak English at home. of residents speak Spanish at home (53% speak English very well , 26% speak English well , 18% speak English not well , 3% don't speak English at all ).of residents speak other Indo-European language at home (62% speak English very well , 20% speak English well , 13% speak English not well , 5% don't speak English at all ).of residents speak Asian or Pacific Island language at home (39% speak English very well , 30% speak English well , 25% speak English not well , 6% don't speak English at all ).of residents speak other language at home (60% speak English very well , 25% speak English well , 14% speak English not well , 2% don't speak English at all ).
Foreign born population: 9,049 (41.7%)of them are naturalized citizens )
Median number of rooms in houses and condos:
Median number of rooms in apartments
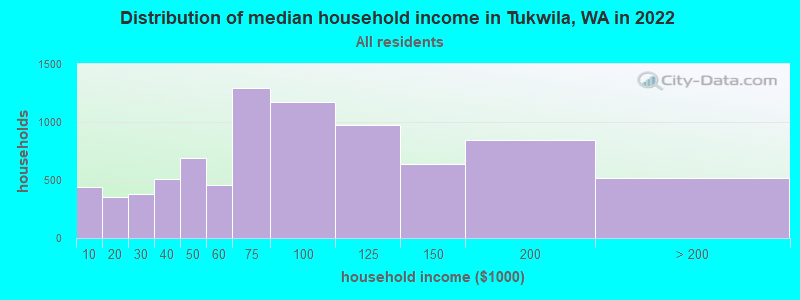
Tukwila, WA household income distribution 437 Less than $10,000357 $10,000 to $19,999381 $20,000 to $29,999505 $30,000 to $39,999687 $40,000 to $49,999453 $50,000 to $59,9991,291 $60,000 to $74,9991,174 $75,000 to $99,999978 $100,000 to $124,999641 $125,000 to $149,999841 $150,000 to $199,999520 $200,000 or more
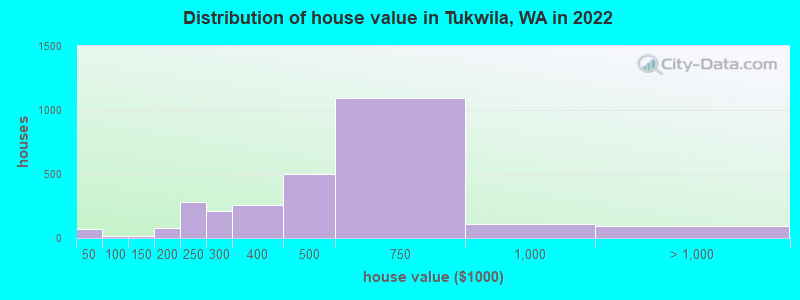
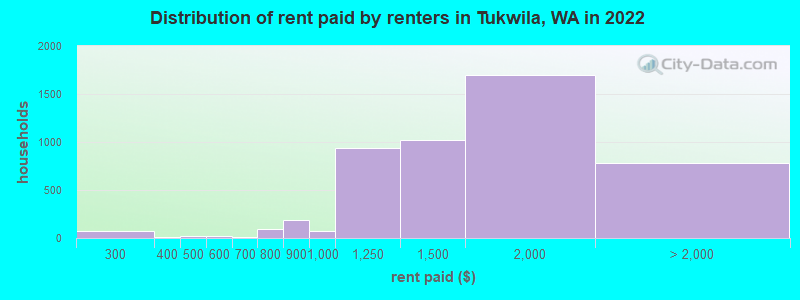
Home value of owner - occupied houses in 2022 in Tukwila, WA 20 Less than $10,0007 $10,000 to $14,99913 $15,000 to $19,99917 $25,000 to $29,9991 $35,000 to $39,9997 $40,000 to $49,9999 $50,000 to $59,99916 $100,000 to $124,99959 $150,000 to $174,99921 $175,000 to $199,999284 $200,000 to $249,999208 $250,000 to $299,999254 $300,000 to $399,999496 $400,000 to $499,9991,097 $500,000 to $749,999112 $750,000 to $999,99976 $1,000,000 to $1,499,99915 $1,500,000 to $1,999,999Rent paid by renters in 2022 in Tukwila, WA 72 $200 to $24910 $300 to $34916 $450 to $49921 $550 to $59915 $600 to $64928 $700 to $74968 $750 to $799184 $800 to $89968 $900 to $999934 $1,000 to $1,2491,015 $1,250 to $1,4991,703 $1,500 to $1,999400 $2,000 to $2,49950 $2,500 to $2,99975 $3,000 to $3,49963 $3,500 or more192 No cash rent
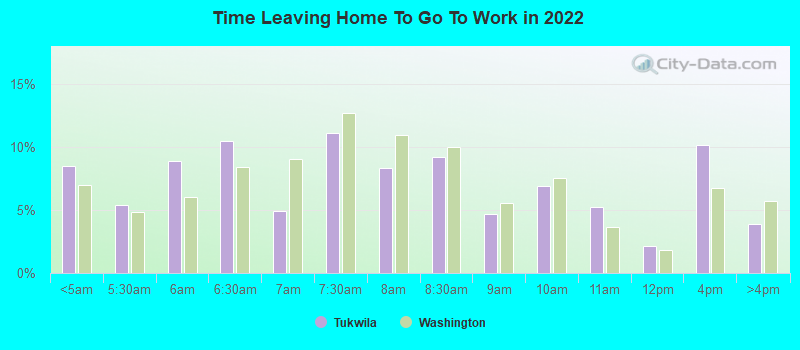
Percentage of workers working in this county: 96.5%Number of people working at home: 1,445 (11.8% of all workers )
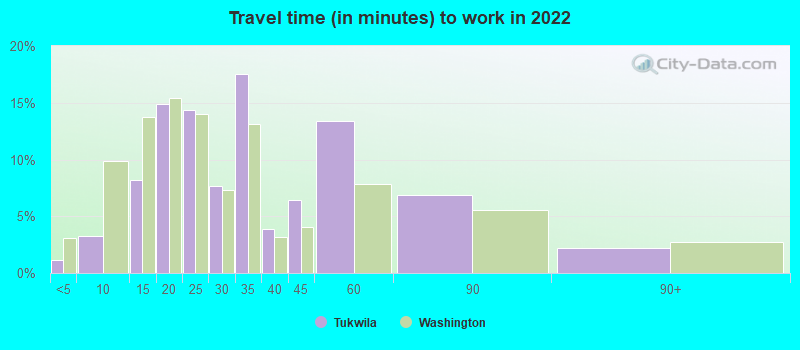
Travel time to work (commute)
Less than 5 minutes: 265 to 9 minutes: 64910 to 14 minutes: 1,65115 to 19 minutes: 2,05120 to 24 minutes: 1,42525 to 29 minutes: 65530 to 34 minutes: 1,54735 to 39 minutes: 29640 to 44 minutes: 57945 to 59 minutes: 66660 to 89 minutes: 43990 or more minutes: 195
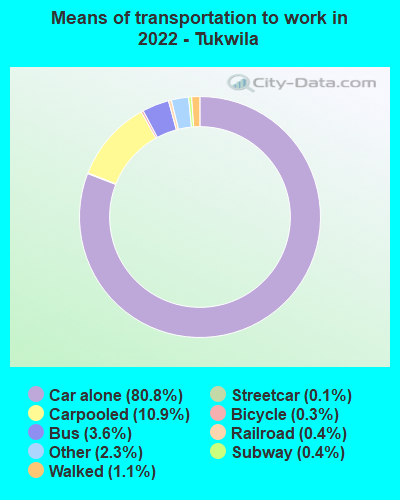
Means of transportation to work:
Drove a car alone: 25,782 (75.2%)Carpooled: 3,339 (9.7%)Bus : 700 (2.0%)Subway or elevated rail : 38 (0.1%)Long-distance train or commuter rail : 71 (0.2%)Light rail, streetcar or trolley : 173 (0.5%)Ferryboat: 17 (0.0%)Taxi: 679 (2.0%)Bicycle: 90 (0.3%)Walked: 305 (0.9%)Worked at home: 1,445 (4.2%)
Unemployment by race in 2022
Unemployment rate for White non-Hispanic residents 8.5% Males1.8% FemalesUnemployment rate for Black residents 5.9% MalesUnemployment rate for American Indian and Alaska Native residents 11.5% MalesUnemployment rate for Asian residents 8.2% Males4.8% FemalesUnemployment rate for other race residents 2.5% Males16.1% FemalesUnemployment rate for two or more race residents 1.3% Males3.3% FemalesUnemployment rate for Hispanic or Latino residents 2.3% Males9.9% Females
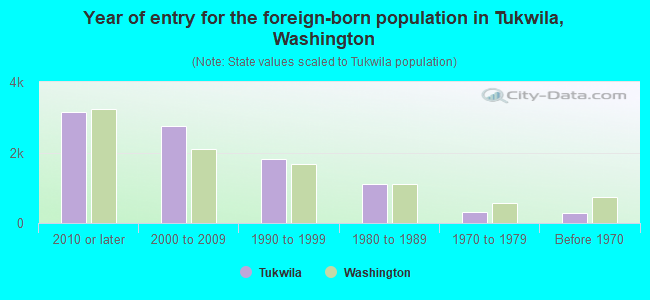
Year of entry for the foreign-born population in Tukwila, Washington
3,137 2010 or later 2,759 2000 to 2009 1,808 1990 to 1999 1,095 1980 to 1989 317 1970 to 1979 289 Before 1970
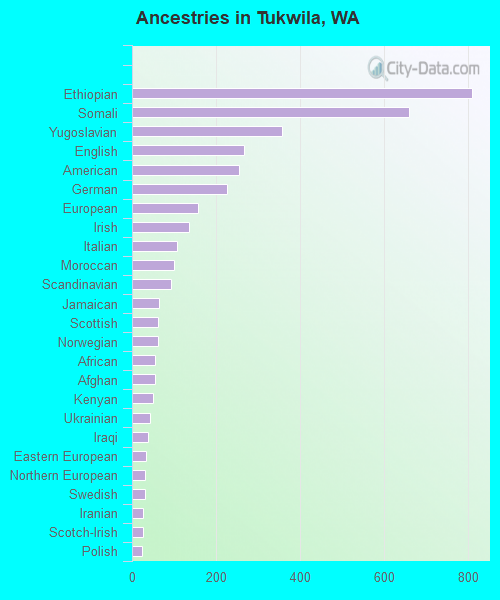
First ancestries reported:
Ethiopian: 809 (6.2%)
Somali: 660 (5.0%)
Yugoslavian: 358 (2.7%)
English: 266 (2.0%)
American: 255 (1.9%)
German: 227 (1.7%)
European: 156 (1.2%)
Irish: 135 (1.0%)
Italian: 108 (0.8%)
Moroccan: 99 (0.8%)
Scandinavian: 92 (0.7%)
Jamaican: 65 (0.5%)
Scottish: 63 (0.5%)
Norwegian: 62 (0.5%)
African: 55 (0.4%)
Afghan: 55 (0.4%)
Kenyan: 49 (0.4%)
Ukrainian: 44 (0.3%)
Iraqi: 38 (0.3%)
Eastern European: 34 (0.3%)
Northern European: 30 (0.2%)
Swedish: 30 (0.2%)
Iranian: 27 (0.2%)
Scotch-Irish: 26 (0.2%)
Polish: 24 (0.2%)
Belgian: 19 (0.1%)
Dutch: 15 (0.1%)
Egyptian: 13 (0.10%)
Finnish: 13 (0.10%)
French: 10 (0.08%)
Slovak: 10 (0.08%)
Russian: 9 (0.07%)
British: 8 (0.06%)
Swiss: 8 (0.06%)
Canadian: 7 (0.05%)
Hungarian: 6 (0.05%)
Danish: 4 (0.03%) Most common places of birth for foreign-born residents (%): Mexico Tukwila:
22.6% (2,044)Washington:
21.1% (241,655)
Vietnam Tukwila:
15.2% (1,376)Washington:
5.4% (62,003)
Philippines Tukwila:
9.8% (888)Washington:
6.3% (71,661)
Somalia Tukwila:
6.1% (549)Washington:
0.7% (8,540)
Ethiopia Tukwila:
5.4% (492)Washington:
1.6% (17,938)
Burma (Myanmar) Tukwila:
5.1% (460)Washington:
0.3% (3,171)
Bosnia and Herzegovina Tukwila:
4.7% (421)Washington:
0.3% (3,825)
Thailand Tukwila:
2.3% (210)Washington:
0.9% (9,937)
India Tukwila:
2.2% (199)Washington:
8.9% (101,353)
Cambodia Tukwila:
2.1% (193)Washington:
1.0% (10,993)
Kenya Tukwila:
1.9% (169)Washington:
1.1% (12,735)
Eritrea Tukwila:
1.8% (159)Washington:
0.4% (4,688)
China, excluding Hong Kong and Taiwan Tukwila:
1.6% (144)Washington:
7.4% (84,470)
Place of birth for U.S.-born residents:
This state: 7,595Other state: 4,711Northeast: 401Midwest: 918South: 923West: 2,452 85.6% of Tukwila residents lived in the same house 1 years ago.
Out of people who lived in different houses, 45.3% lived in this county.
Out of people who lived in different counties, 60.5% lived in Washington.
Tukwila:
85.6%State average:
85.2%
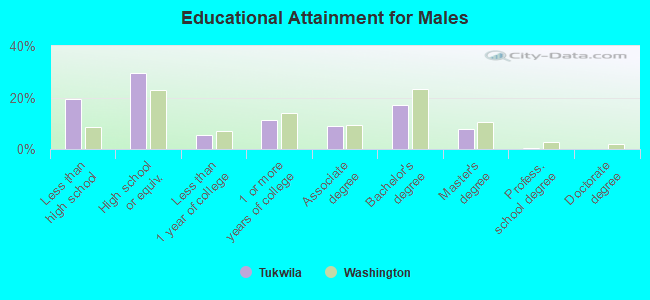
Education attainment for males 25 years and older:
No schooling: 634Nursery to 4th grade: 05th and 6th grade: 1287th and 8th grade: 3589th grade: 16110th grade: 4311th grade: 7512th grade, no diploma: 296High school graduate (or equivalency): 2,553Less than 1 year of college: 469Some college more than 1 year, no degree: 985Associate degree: 792Bachelor's degree: 1,473Master's degree: 680Professional school degree: 43Doctorate degree: 5
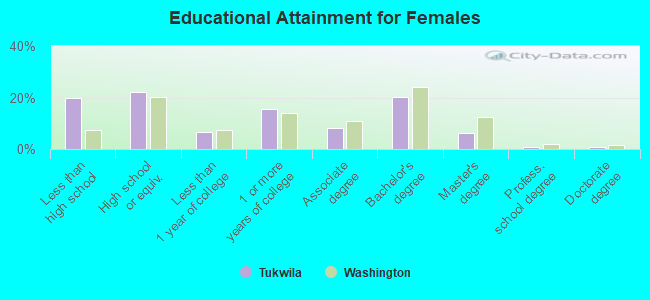
Education attainment for females 25 years and older:
No schooling: 713Nursery to 4th grade: 465th and 6th grade: 1327th and 8th grade: 389th grade: 17410th grade: 2211th grade: 14112th grade, no diploma: 155High school graduate (or equivalency): 1,572Less than 1 year of college: 459Some college more than 1 year, no degree: 1,122Associate degree: 595Bachelor's degree: 1,452Master's degree: 431Professional school degree: 44Doctorate degree: 56
Housing units in structures:
One, detached: 3,558One, attached: 293Two: 2523 or 4: 5165 to 9: 71110 to 19: 1,19320 to 49: 1,23350 or more: 1,002Mobile homes: 155Boats, RVs, vans, etc.: 19Median worth of mobile homes: $10,890
Housing units lacking complete plumbing facilities in 2022: 2.4%Housing units lacking complete kitchen facilities in 2022: 2.5%House/condo owner moved in on average 9 years ago
Renter moved in on average 4 years ago
Private vs. public school enrollment:
Students in private schools in grades 1 to 8 (elementary and middle school): 88 Here:
4.7%Washington:
12.4%
Students in private schools in grades 9 to 12 (high school): 30 Students in private undergraduate colleges: 109 Here:
11.8%Washington:
16.5%