Housing density: 104 houses/condos per square mile
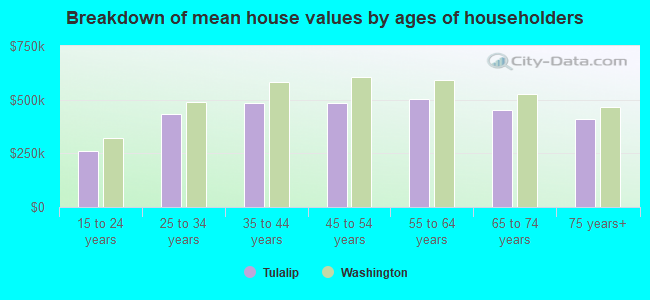
Median price asked for vacant for-sale houses and condos in 2022 in this county: $628,500.
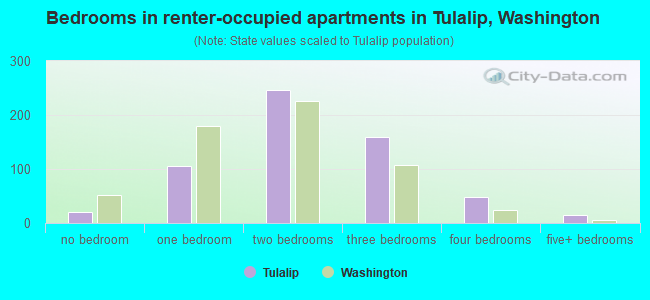
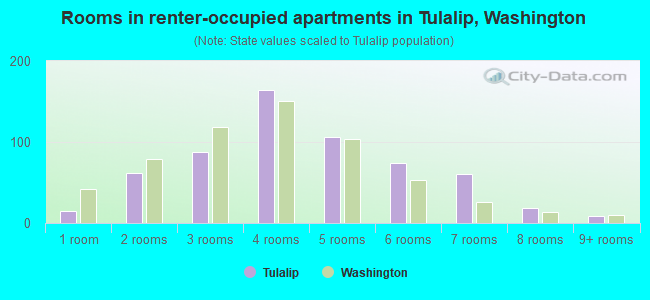
Median contract rent in 2022: $1,519 (lower quartile is $859, upper quartile is $1,913)
Median rent asked for vacant for-rent units in 2022: $1,921
Median gross rent in Tulalip, WA in 2022: $1,684
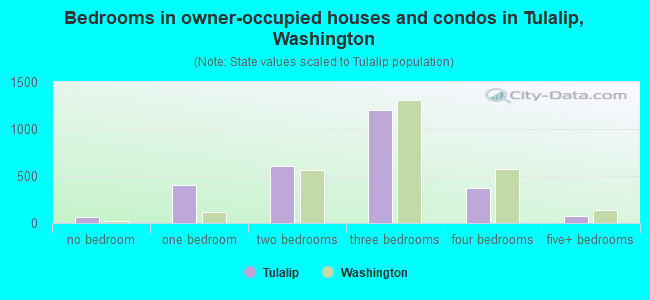
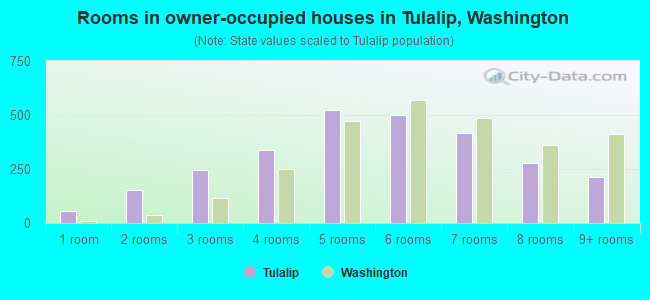
Housing units in Tulalip with a mortgage: 1,233 (138 second mortgage, 102 home equity loan, 3 both second mortgage and home equity loan) Houses without a mortgage: 453
In family households: 589,694 (132,675 male householders, 49,607 female householders)
140,500 spouses, 208,748 children (193,212 natural, 5,027 adopted, 10,509 stepchildren), 9,881 grandchildren, 6,965 brothers or sisters, 6,533 parents, foster children, 9,131 other relatives, 20,713 non-relatives
In nonfamily households: 113,244 (43,016 male householders (30,707 living alone)), 43,027 female householders (34,612 living alone)), 27,201 nonrelatives
In group quarters: 10,397 (5,769 institutionalized population)
121,078 married couples with children.
33,184 single-parent households (9,051 men, 24,133 women).
93.7% of residents of Tulalip speak English at home.
2.3% of residents speak Spanish at home (62% speak English very well, 28% speak English well, 8% speak English not well, 2% don't speak English at all).
1.4% of residents speak other Indo-European language at home (86% speak English very well, 7% speak English well, 6% speak English not well, 2% don't speak English at all).
1.5% of residents speak Asian or Pacific Island language at home (68% speak English very well, 23% speak English well, 9% speak English not well).
1.1% of residents speak other language at home (83% speak English very well, 9% speak English well, 7% speak English not well).
Foreign born population: 974 (7.6%)
(64.8% of them are naturalized citizens)
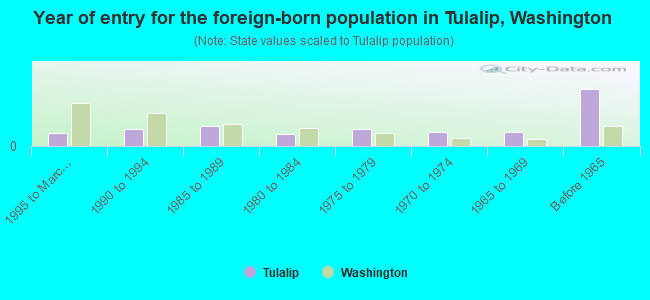
Year of entry for the foreign-born population in Tulalip, Washington
301995 to March 2000
391990 to 1994
451985 to 1989
271980 to 1984
391975 to 1979
321970 to 1974
331965 to 1969
129Before 1965
Most common places of birth for foreign-born residents (%):
Canada
Tulalip:
23.5% (88)
Washington:
7.7% (47,568)
Mexico
Tulalip:
17.1% (64)
Washington:
24.1% (148,115)
United Kingdom
Tulalip:
9.1% (34)
Washington:
3.3% (20,321)
Philippines
Tulalip:
8.3% (31)
Washington:
7.6% (46,733)
Germany
Tulalip:
7.8% (29)
Washington:
3.4% (21,167)
Korea
Tulalip:
7.2% (27)
Washington:
6.2% (38,172)
Japan
Tulalip:
4.5% (17)
Washington:
2.8% (16,936)
Vietnam
Tulalip:
2.9% (11)
Washington:
6.7% (40,879)
Netherlands
Tulalip:
2.4% (9)
Washington:
0.6% (3,795)
Thailand
Tulalip:
1.6% (6)
Washington:
1.0% (6,294)
Place of birth for U.S.-born residents:
This state: 5,746
Other state: 3,047
Northeast: 269
Midwest: 811
South: 463
West: 1,504
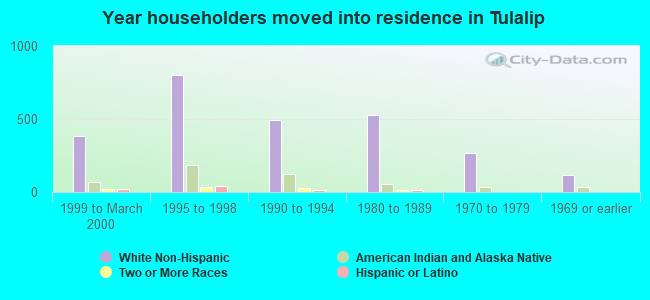
56% of Tulalip residents lived in the same house 5 years ago. Out of people who lived in different houses, 69% lived in this county. Out of people who lived in different counties, 52% lived in Washington.
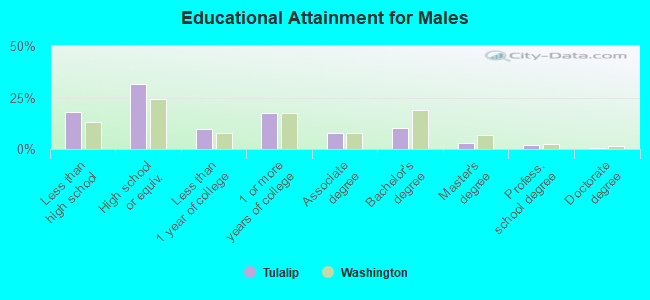
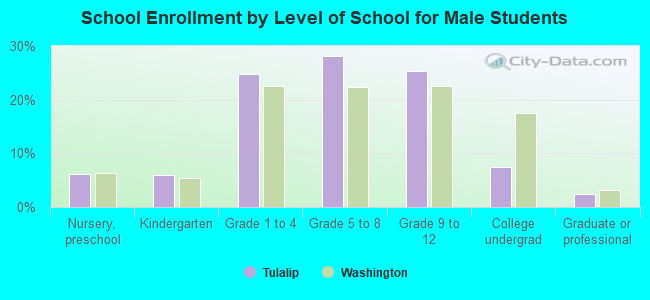
Education attainment for males 25 years and older:
No schooling: 17
Nursery to 4th grade: 9
5th and 6th grade: 23
7th and 8th grade: 113
9th grade: 76
10th grade: 81
11th grade: 102
12th grade, no diploma: 124
High school graduate (or equivalency): 950
Less than 1 year of college: 290
Some college more than 1 year, no degree: 533
Associate degree: 233
Bachelor's degree: 305
Master's degree: 95
Professional school degree: 52
Doctorate degree: 11
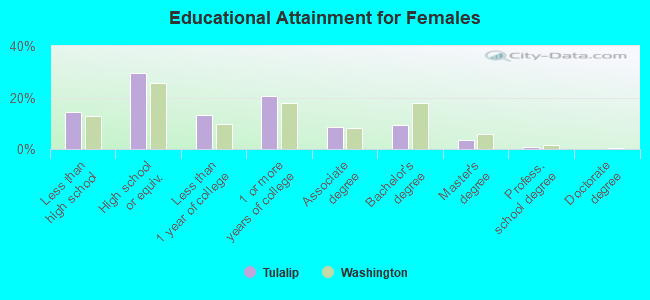
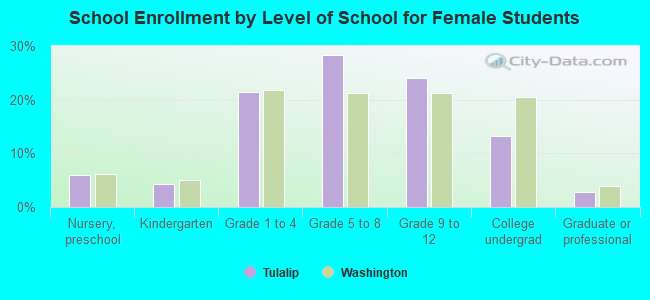
Education attainment for females 25 years and older:
No schooling: 4
Nursery to 4th grade: 5
5th and 6th grade: 10
7th and 8th grade: 63
9th grade: 57
10th grade: 96
11th grade: 113
12th grade, no diploma: 76
High school graduate (or equivalency): 871
Less than 1 year of college: 390
Some college more than 1 year, no degree: 614
Associate degree: 257
Bachelor's degree: 282
Master's degree: 101
Professional school degree: 27
Doctorate degree: 0
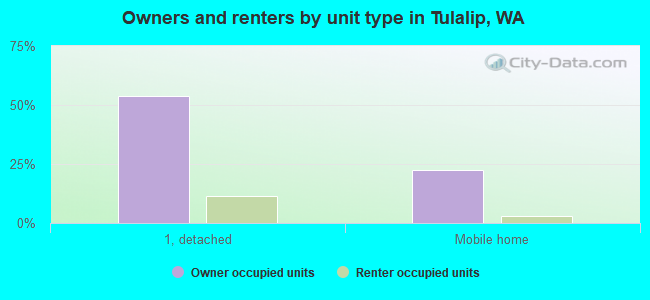
Housing units in structures:
One, detached: 2,410
One, attached: 34
Two: 26
3 or 4: 24
5 to 9: 16
10 to 19: 8
20 to 49: 7
50 or more: 8
Mobile homes: 877
Boats, RVs, vans, etc.: 228
Median worth of mobile homes: $288,407
Housing units lacking complete plumbing facilities: 0.6%
Housing units lacking complete kitchen facilities: 0.5%