Tullahoma, TN (Tennessee) Houses and Residents
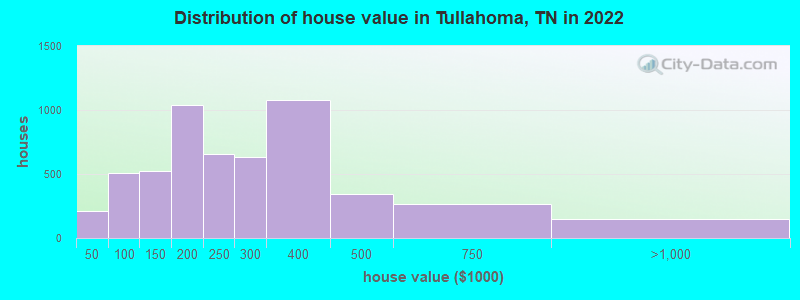
Estimated median house or condo value in 2022: $242,098 (it was $78,400 in 2000 )
Tullahoma:
$242,098Tennessee:
$284,800
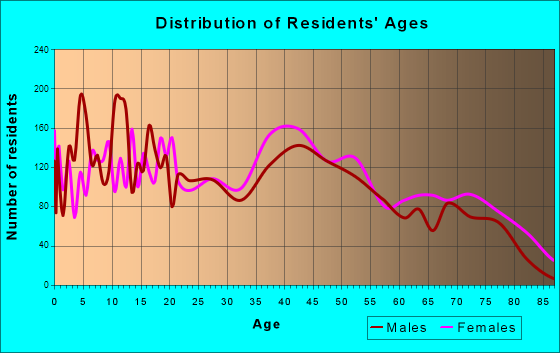
Lower value quartile - upper value quartile: $167,931 - $357,187Total population: 18,899 (Urban population: 16,836 (all inside urban clusters), Rural population: 1,157 (all nonfarm) )
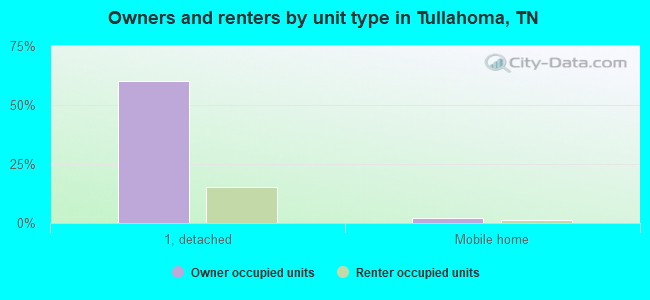
Houses: 9,712 (8,970 occupied: 5,793 owner occupied, 3,335 renter occupied )
% of renters here:
37%State:
33%
Housing density: 437 houses/condos per square mile
Median price asked for vacant for-sale houses and condos in 2022 in this county: $152,791.
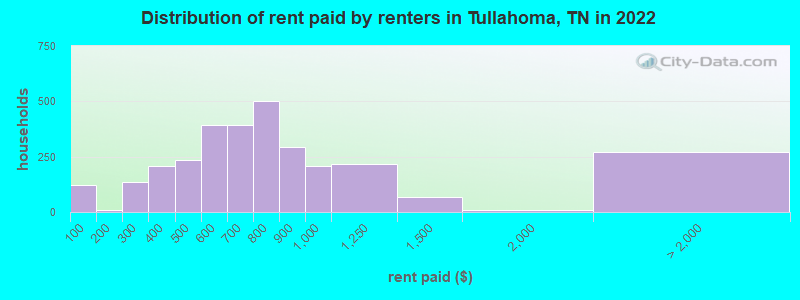
Median contract rent in 2022: $688 (lower quartile is $513, upper quartile is $868)
Median rent asked for vacant for-rent units in 2022: $706
Median gross rent in Tullahoma, TN in 2022: $862
Housing units in Tullahoma with a mortgage: 3,373 (306 second mortgage, 0 home equity loan, 261 both second mortgage and home equity loan )Houses without a mortgage: 62
Median household income for houses/condos with a mortgage: $94,938
Median household income for apartments without a mortgage: $53,027
Median monthly housing costs: $877
Data:
Median house or condo value ($)
Median house or condo value ($ change since 2000)
Median house or condo value ($) - White
Median house or condo value ($) - Black or African American
Median house or condo value ($) - Asian
Median house or condo value ($) - Hispanic or Latino
Median house or condo value ($) - American Indian and Alaska Native
Median house or condo value ($) - Multirace
Median house or condo value ($) - Other Race
Median price asked for mobile homes ($)
Household density (households per square mile)
Mean house or condo value by units in structure - 1, detached ($)
Mean house or condo value by units in structure - 1, attached ($)
Mean house or condo value by units in structure - 2 ($)
Mean house or condo value by units in structure by units in structure - 3 or 4 ($)
Mean house or condo value by units in structure - 5 or more ($)
Mean house or condo value by units in structure - Boat, RV, van, etc. ($)
Mean house or condo value by units in structure - Mobile home ($)
Median contract rent ($)
Median contract rent - Lower quartile ($)
Median contract rent - Upper quartile ($)
Median gross rent ($)
Urban houses (%)
Rural houses (%)
Houses occupied (%)
Houses occupied (% change since 2000)
Houses owner occupied (%)
Houses owner occupied (% change since 2000)
Houses renter occupied (%)
Houses renter occupied (% change since 2000)
Vacant housing units - For rent (%)
Vacant housing units - For rent (% change since 2000)
Vacant housing units - For sale only (%)
Vacant housing units - For sale only (% change since 2000)
Vacant housing units - Rented or sold, not occupied (%)
Vacant housing units - Rented or sold, not occupied (% change since 2000)
Vacant housing units - For seasonal, recreational, or occasional use (%)
Vacant housing units - For seasonal, recreational, or occasional use (% change since 2000)
Vacant housing units - For migrant workers (%)
Vacant housing units - For migrant workers (% change since 2000)
Vacant housing units - Other vacant (%)
Vacant housing units - Other vacant (% change since 2000)
Median monthly housing costs ($)
Median household income for houses/condos with a mortgage ($)
Median household income for houses/condos without a mortgage ($)
Median household income ($)
Median household income ($) - White
Median household income ($) - Black or African American
Median household income ($) - Asian
Median household income ($) - Hispanic or Latino
Median household income ($) - American Indian and Alaska Native
Median household income ($) - Multirace
Median household income ($) - Other Race
Mortgage status - with mortgage (%)
Mortgage status - with second mortgage (%)
Mortgage status - with home equity loan (%)
Mortgage status - with both second mortgage and home equity loan (%)
Mortgage status - without a mortgage (%)
Median year house/condo built
Median year apartment built
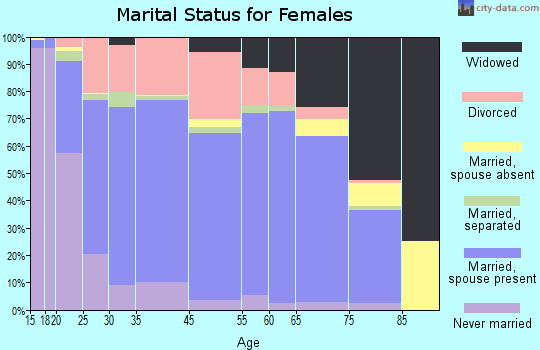
Household type by relationship - Male householder living alone (%)
Household type by relationship - Male householder not living alone (%)
Household type by relationship - Female householder living alone (%)
Household type by relationship - Female householder not living alone (%)
Household type by relationship - Opposite-Sex spouse (%)
Household type by relationship - Same-Sex spouse (%)
Household type by relationship - Opposite-Sex unmarried partner (%)
Household type by relationship - Same-Sex unmarried partner (%)
Household type by relationship - In group quarters (%)
Size of family households - 2-person household (%)
Size of family households - 3-person household (%)
Size of family households - 4-person household (%)
Size of family households - 5-person household (%)
Size of family households - 6-person household (%)
Size of family households - 7-or-more-person household (%)
Size of nonfamily households - 1-person household (%)
Size of nonfamily households - 2-person household (%)
Size of nonfamily households - 3-person household (%)
Size of nonfamily households - 4-person household (%)
Size of nonfamily households - 5-person household (%)
Size of nonfamily households - 6-person household (%)
Size of nonfamily households - 7-or-moreperson household (%)
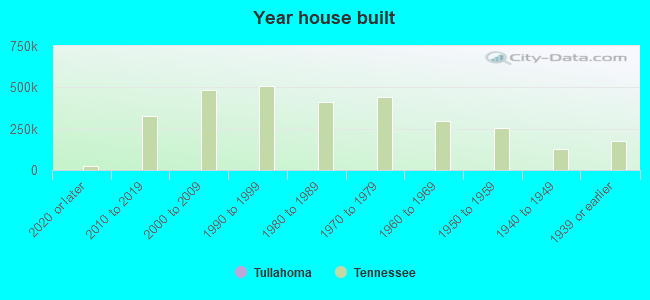
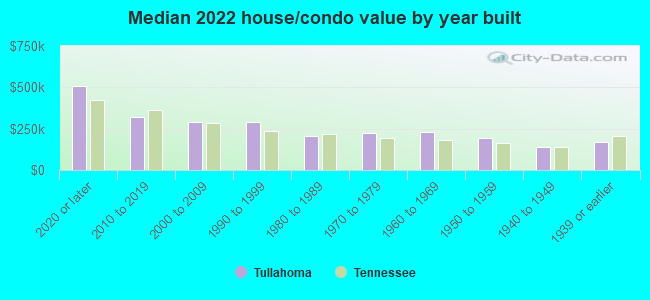
Year house built - Built 2010 or later (%)
Year house built - Built 2000 to 2009 (%)
Year house built - Built 1990 to 1999 (%)
Year house built - Built 1980 to 1989 (%)
Year house built - Built 1970 to 1979 (%)
Year house built - Built 1960 to 1969 (%)
Year house built - Built 1950 to 1959 (%)
Year house built - Built 1940 to 1949 (%)
Year house built - Built 1939 or earlier (%)
Median number of rooms in houses and condos
Median number of rooms in apartments
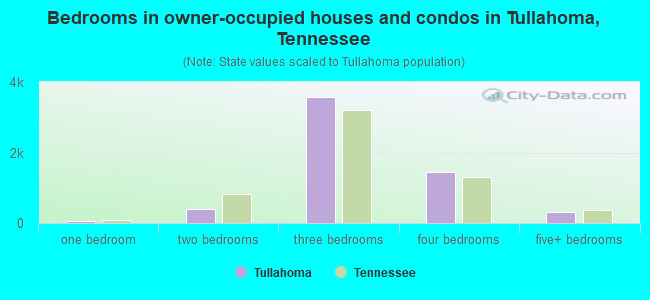
Median number of bedrooms in owner occupied houses
Mean number of bedrooms in owner occupied houses
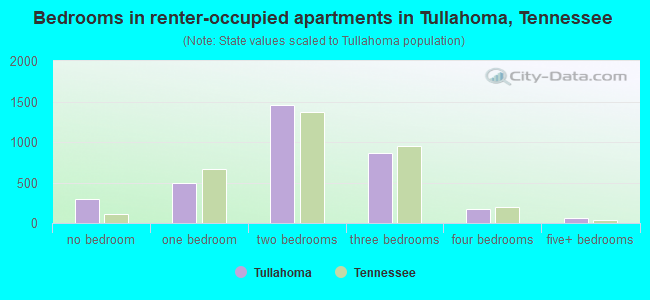
Median number of bedrooms in renter occupied houses
Mean number of bedrooms in renter occupied houses
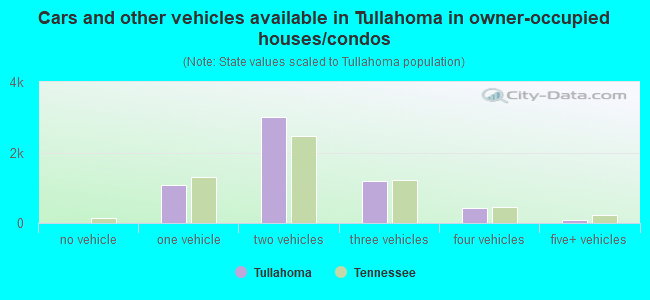
Median number of vehichles in owner occupied houses
Mean number of vehichles in owner occupied houses
Median number of vehichles in renter occupied houses
Mean number of vehichles in renter occupied houses
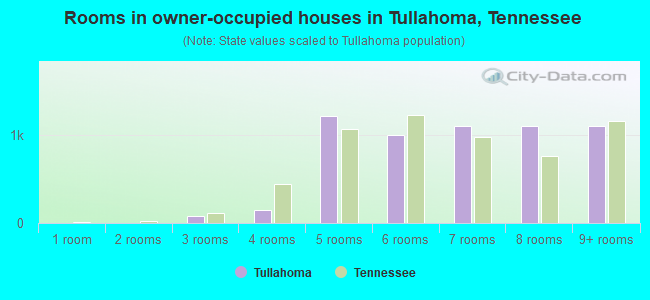
Rooms in owner-occupied houses - 1 room (%)
Rooms in owner-occupied houses - 2 rooms (%)
Rooms in owner-occupied houses - 3 rooms (%)
Rooms in owner-occupied houses - 4 rooms (%)
Rooms in owner-occupied houses - 5 rooms (%)
Rooms in owner-occupied houses - 6 rooms (%)
Rooms in owner-occupied houses - 7 rooms (%)
Rooms in owner-occupied houses - 8 rooms (%)
Rooms in owner-occupied houses - 9+ rooms (%)
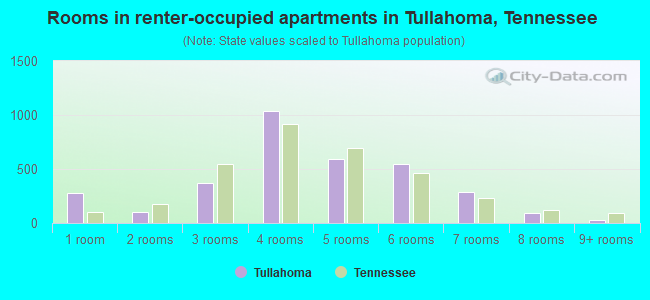
Rooms in renter-occupied houses - 1 room (%)
Rooms in renter-occupied houses - 2 rooms (%)
Rooms in renter-occupied houses - 3 rooms (%)
Rooms in renter-occupied houses - 4 rooms (%)
Rooms in renter-occupied houses - 5 rooms (%)
Rooms in renter-occupied houses - 6 rooms (%)
Rooms in renter-occupied houses - 7 rooms (%)
Rooms in renter-occupied houses - 8 rooms (%)
Rooms in renter-occupied houses - 9+ rooms (%)
Bedrooms in owner-occupied houses - no bedrooms (%)
Bedrooms in owner-occupied houses - 1 bedroom (%)
Bedrooms in owner-occupied houses - 2 bedrooms (%)
Bedrooms in owner-occupied houses - 3 bedrooms (%)
Bedrooms in owner-occupied houses - 4 bedrooms (%)
Bedrooms in owner-occupied houses - 5+ bedrooms (%)
Bedrooms in renter-occupied houses - no bedrooms (%)
Bedrooms in renter-occupied houses - 1 bedroom (%)
Bedrooms in renter-occupied houses - 2 bedrooms (%)
Bedrooms in renter-occupied houses - 3 bedrooms (%)
Bedrooms in renter-occupied houses - 4 bedrooms (%)
Bedrooms in renter-occupied houses - 5+ bedrooms (%)
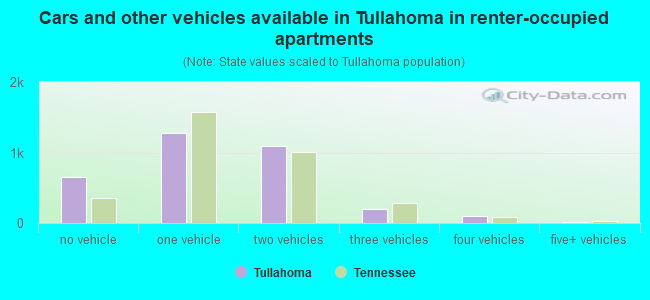
Vehicles available in owner-occupied houses - no vehicle available (%)
Vehicles available in owner-occupied houses - 1 vehicle available(%)
Vehicles available in owner-occupied houses - 2 Vehicles available (%)
Vehicles available in owner-occupied houses - 3 Vehicles available (%)
Vehicles available in owner-occupied houses - 4 Vehicles available (%)
Vehicles available in owner-occupied houses - 5+ Vehicles available (%)
Vehicles available in renter-occupied houses - no vehicle available (%)
Vehicles available in renter-occupied houses - 1 vehicle available (%)
Vehicles available in renter-occupied houses - 2 Vehicles available (%)
Vehicles available in renter-occupied houses - 3 Vehicles available (%)
Vehicles available in renter-occupied houses - 4 Vehicles available (%)
Vehicles available in renter-occupied houses - 5+ Vehicles available (%)
Housing units in structures - 1, detached (%)
Housing units in structures - 1, attached (%)
Housing units in structures - 2 (%)
Housing units in structures - 3 or 4 (%)
Housing units in structures - 5 to 9 (%)
Housing units in structures - 10 to 19 (%)
Housing units in structures - 20 to 49 (%)
Housing units in structures - 50 or more (%)
Housing units in structures - Mobile home (%)
Housing units in structures - Boat, RV, van, etc. (%)
Housing units in structures - Owners - 1, detached (%)
Housing units in structures - Owners - 1, attached (%)
Housing units in structures - Owners - 2 (%)
Housing units in structures - Owners - 3 or 4 (%)
Housing units in structures - Owners - 5 to 9 (%)
Housing units in structures - Owners - 10 to 19 (%)
Housing units in structures - Owners - 20 to 49 (%)
Housing units in structures - Owners - 50 or more (%)
Housing units in structures - Owners - Mobile home (%)
Housing units in structures - Owners - Boat, RV, van, etc. (%)
Housing units in structures - Renters - 1, detached (%)
Housing units in structures - Renters - 1, attached (%)
Housing units in structures - Renters - 2 (%)
Housing units in structures - Renters - 3 or 4 (%)
Housing units in structures - Renters - 5 to 9 (%)
Housing units in structures - Renters - 10 to 19 (%)
Housing units in structures - Renters - 20 to 49 (%)
Housing units in structures - Renters - 50 or more (%)
Housing units in structures - Renters - Mobile home (%)
Housing units in structures - Renters - Boat, RV, van, etc. (%)
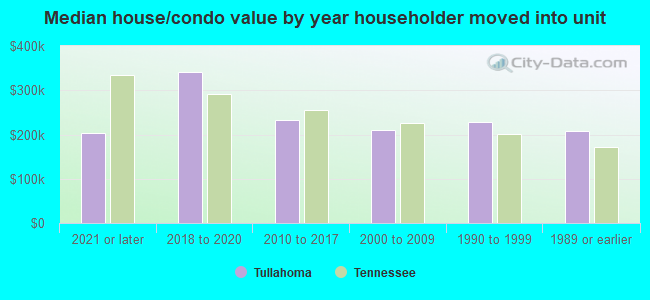
House/condo owner moved in on average (years ago)
Renter moved in on average (years ago)
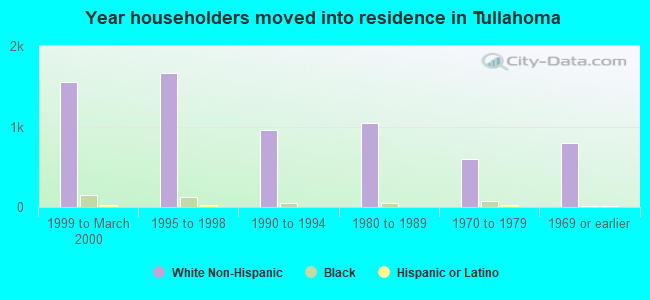
Year householder moved into unit - Moved in 1999 to March 2000 (%)
Year householder moved into unit - Moved in 1999 to March 2000 (%) - White
Year householder moved into unit - Moved in 1999 to March 2000 (%) - Black or African American
Year householder moved into unit - Moved in 1999 to March 2000 (%) - Asian
Year householder moved into unit - Moved in 1999 to March 2000 (%) - Hispanic or Latino
Year householder moved into unit - Moved in 1999 to March 2000 (%) - American Indian and Alaska Native
Year householder moved into unit - Moved in 1999 to March 2000 (%) - Multirace
Year householder moved into unit - Moved in 1999 to March 2000 (%) - Other Race
Year householder moved into unit - Moved in 1995 to 1998 (%)
Year householder moved into unit - Moved in 1995 to 1998 (%) - White
Year householder moved into unit - Moved in 1995 to 1998 (%) - Black or African American
Year householder moved into unit - Moved in 1995 to 1998 (%) - Asian
Year householder moved into unit - Moved in 1995 to 1998 (%) - Hispanic or Latino
Year householder moved into unit - Moved in 1995 to 1998 (%) - American Indian and Alaska Native
Year householder moved into unit - Moved in 1995 to 1998 (%) - Multirace
Year householder moved into unit - Moved in 1995 to 1998 (%) - Other Race
Year householder moved into unit - Moved in 1990 to 1994 (%)
Year householder moved into unit - Moved in 1990 to 1994 (%) - White
Year householder moved into unit - Moved in 1990 to 1994 (%) - Black or African American
Year householder moved into unit - Moved in 1990 to 1994 (%) - Asian
Year householder moved into unit - Moved in 1990 to 1994 (%) - Hispanic or Latino
Year householder moved into unit - Moved in 1990 to 1994 (%) - American Indian and Alaska Native
Year householder moved into unit - Moved in 1990 to 1994 (%) - Multirace
Year householder moved into unit - Moved in 1990 to 1994 (%) - Other Race
Year householder moved into unit - Moved in 1980 to 1989 (%)
Year householder moved into unit - Moved in 1980 to 1989 (%) - White
Year householder moved into unit - Moved in 1980 to 1989 (%) - Black or African American
Year householder moved into unit - Moved in 1980 to 1989 (%) - Asian
Year householder moved into unit - Moved in 1980 to 1989 (%) - Hispanic or Latino
Year householder moved into unit - Moved in 1980 to 1989 (%) - American Indian and Alaska Native
Year householder moved into unit - Moved in 1980 to 1989 (%) - Multirace
Year householder moved into unit - Moved in 1980 to 1989 (%) - Other Race
Year householder moved into unit - Moved in 1970 to 1979 (%)
Year householder moved into unit - Moved in 1970 to 1979 (%) - White
Year householder moved into unit - Moved in 1970 to 1979 (%) - Black or African American
Year householder moved into unit - Moved in 1970 to 1979 (%) - Asian
Year householder moved into unit - Moved in 1970 to 1979 (%) - Hispanic or Latino
Year householder moved into unit - Moved in 1970 to 1979 (%) - American Indian and Alaska Native
Year householder moved into unit - Moved in 1970 to 1979 (%) - Multirace
Year householder moved into unit - Moved in 1970 to 1979 (%) - Other Race
Year householder moved into unit - Moved in 1969 or earlier (%)
Year householder moved into unit - Moved in 1969 or earlier (%) - White
Year householder moved into unit - Moved in 1969 or earlier (%) - Black or African American
Year householder moved into unit - Moved in 1969 or earlier (%) - Asian
Year householder moved into unit - Moved in 1969 or earlier (%) - Hispanic or Latino
Year householder moved into unit - Moved in 1969 or earlier (%) - American Indian and Alaska Native
Year householder moved into unit - Moved in 1969 or earlier (%) - Multirace
Year householder moved into unit - Moved in 1969 or earlier (%) - Other Race
Housing units lacking complete plumbing facilities (%)
Housing units lacking complete kitchen facilities (%)
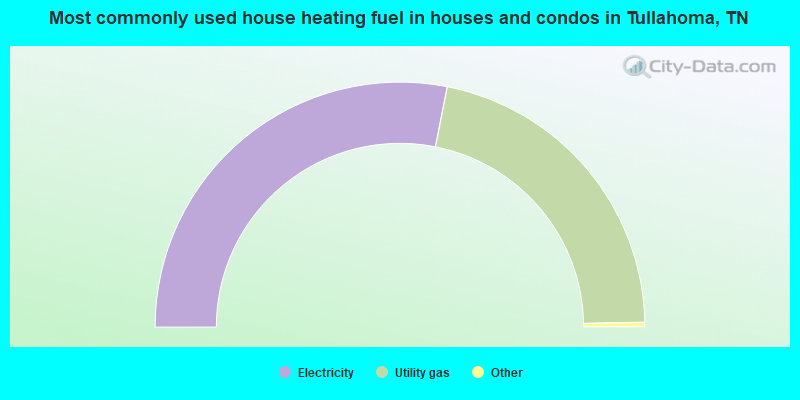
House heating fuel used in houses and condos - Utility gas (%)
House heating fuel used in houses and condos - Bottled, tank, or LP gas (%)
House heating fuel used in houses and condos - Electricity (%)
House heating fuel used in houses and condos - Fuel oil, kerosene, etc. (%)
House heating fuel used in houses and condos - Coal or coke (%)
House heating fuel used in houses and condos - Wood (%)
House heating fuel used in houses and condos - Solar energy (%)
House heating fuel used in houses and condos - Other fuel (%)
House heating fuel used in houses and condos - No fuel used (%)
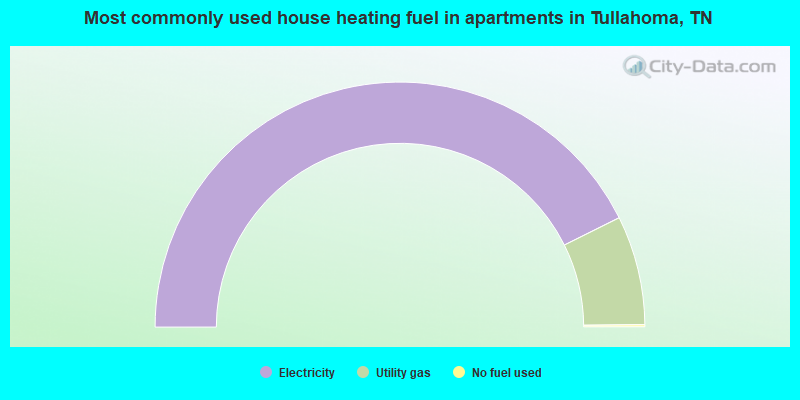
House heating fuel used in apartments - Utility gas (%)
House heating fuel used in apartments - Bottled, tank, or LP gas (%)
House heating fuel used in apartments - Electricity (%)
House heating fuel used in apartments - Fuel oil, kerosene, etc. (%)
House heating fuel used in apartments - Coal or coke (%)
House heating fuel used in apartments - Wood (%)
House heating fuel used in apartments - Solar energy (%)
House heating fuel used in apartments - Other fuel (%)
House heating fuel used in apartments - No fuel used (%)
Latest news about housing in Tullahoma, TN collected exclusively by city-data.com from local newspapers, TV, and radio stations
Median year house/condo built: 1985Median year apartment built: 1974Household type by relationship:
Households: 21,495
Male householders: 4,192 (1,364 living alone ), Female householders: 4,670 (1,308 living alone )4,130 spouses (4,112 opposite-sex spouses ), 433 unmarried partners , (421 opposite-sex unmarried partners ), 5,709 children (5,221 natural , 197 adopted , 290 stepchildren ), 496 grandchildren , 292 brothers or sisters , 344 parents , 0 foster children , 262 other relatives , 759 non-relatives In group quarters: 202
Size of family households: 3,174 2-persons , 1,302 3-persons , 703 4-persons , 627 5-persons , 116 6-persons , 23 7-or-more-persons .
Size of nonfamily households: 2,720 1-person , 367 2-persons , 53 3-persons , 34 4-persons .
3,005 married couples with children. single-parent households (381 men , 1,008 women ).
96.1% of residents of Tullahoma speak English at home. of residents speak Spanish at home (51% speak English very well , 23% speak English well , 25% speak English not well , 1% don't speak English at all ).of residents speak other Indo-European language at home (84% speak English very well , 16% speak English well ).of residents speak Asian or Pacific Island language at home (47% speak English very well , 44% speak English well , 9% speak English not well ).of residents speak other language at home (100% speak English very well ).
Foreign born population: 687 (3.2%)of them are naturalized citizens )
Median number of rooms in houses and condos:
Median number of rooms in apartments
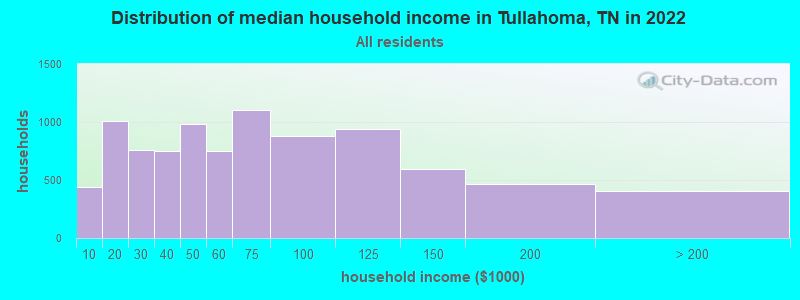
Tullahoma, TN household income distribution 437 Less than $10,0001,010 $10,000 to $19,999760 $20,000 to $29,999748 $30,000 to $39,999987 $40,000 to $49,999749 $50,000 to $59,9991,107 $60,000 to $74,999882 $75,000 to $99,999943 $100,000 to $124,999593 $125,000 to $149,999469 $150,000 to $199,999408 $200,000 or more
Home value of owner - occupied houses in 2022 in Tullahoma, TN 18 Less than $10,00058 $10,000 to $14,99945 $20,000 to $24,99915 $25,000 to $29,99956 $30,000 to $34,99916 $40,000 to $49,99964 $50,000 to $59,999140 $60,000 to $69,999125 $70,000 to $79,99998 $80,000 to $89,99965 $90,000 to $99,999331 $100,000 to $124,999190 $125,000 to $149,999449 $150,000 to $174,999591 $175,000 to $199,999655 $200,000 to $249,999629 $250,000 to $299,9991,080 $300,000 to $399,999341 $400,000 to $499,999262 $500,000 to $749,999152 $750,000 to $999,999Rent paid by renters in 2022 in Tullahoma, TN 119 Less than $1009 $100 to $14913 $200 to $249122 $250 to $299197 $300 to $34912 $350 to $39984 $400 to $449149 $450 to $499223 $500 to $549170 $550 to $599241 $600 to $649149 $650 to $699180 $700 to $749320 $750 to $799293 $800 to $899209 $900 to $999215 $1,000 to $1,24968 $1,250 to $1,4999 $1,500 to $1,99914 $3,500 or more256 No cash rent
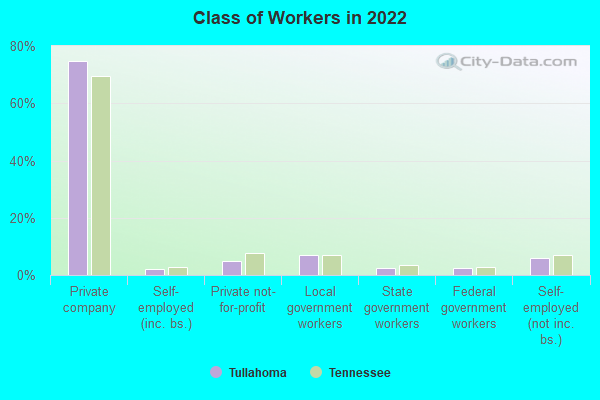
Percentage of workers working in this county: 69.0%Number of people working at home: 859 (8.9% of all workers )
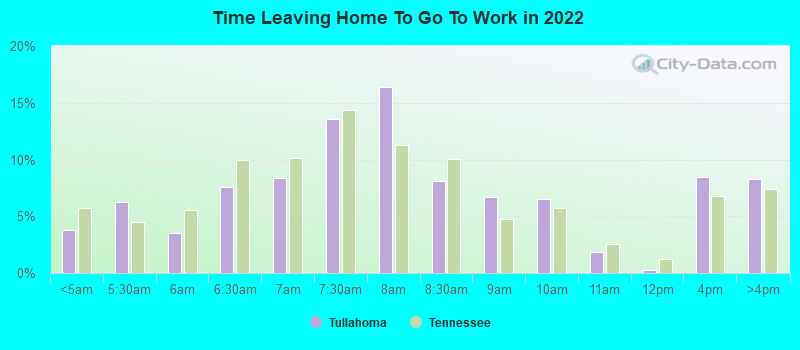
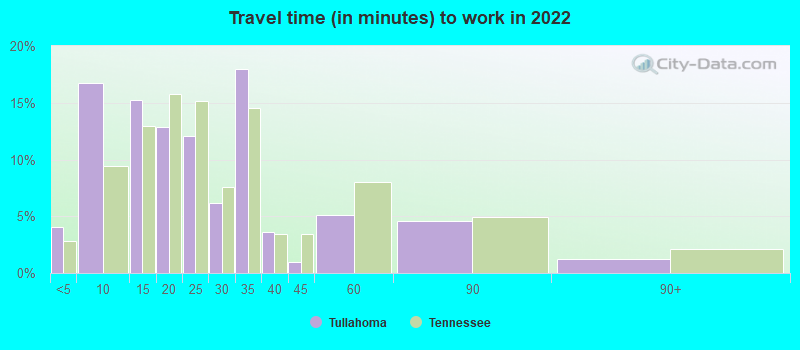
Travel time to work (commute)
Less than 5 minutes: 4365 to 9 minutes: 1,87910 to 14 minutes: 1,61415 to 19 minutes: 1,01820 to 24 minutes: 1,13625 to 29 minutes: 45130 to 34 minutes: 91635 to 39 minutes: 12340 to 44 minutes: 14245 to 59 minutes: 36560 to 89 minutes: 50790 or more minutes: 166
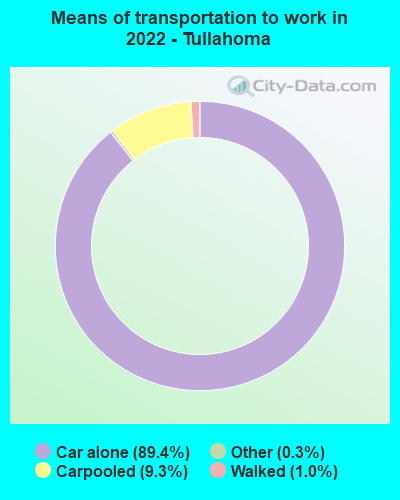
Means of transportation to work:
Drove a car alone: 10,018 (80.9%)Carpooled: 1,100 (8.9%)Taxi: 38 (0.3%)Walked: 119 (1.0%)Worked at home: 859 (6.9%)
Unemployment by race in 2022
Unemployment rate for White non-Hispanic residents 1.2% Males3.2% FemalesUnemployment rate for Black residents 3.2% Males5.9% FemalesUnemployment rate for Asian residents 5.9% FemalesUnemployment rate for two or more race residents 11.9% Males31.9% FemalesUnemployment rate for Hispanic or Latino residents 13.0% Males
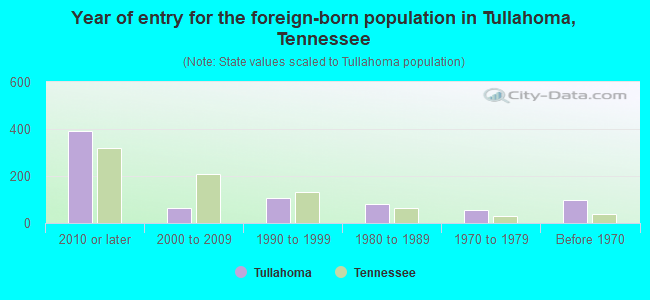
Year of entry for the foreign-born population in Tullahoma, Tennessee
391 2010 or later 64 2000 to 2009 107 1990 to 1999 81 1980 to 1989 54 1970 to 1979 96 Before 1970
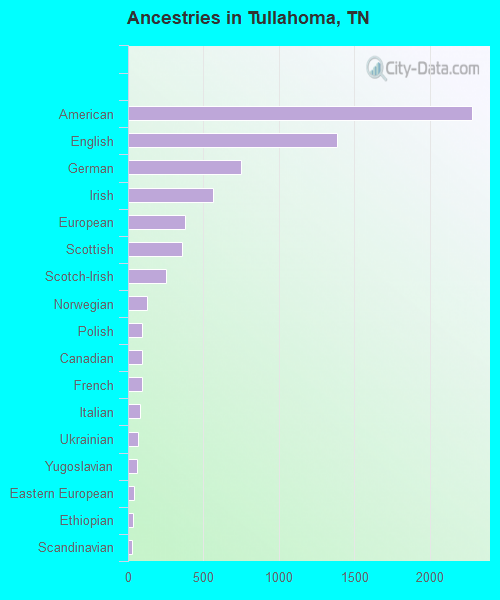
First ancestries reported:
American: 2,278 (24.4%)
English: 1,387 (14.9%)
German: 752 (8.1%)
Irish: 562 (6.0%)
European: 375 (4.0%)
Scottish: 360 (3.9%)
Scotch-Irish: 252 (2.7%)
Norwegian: 129 (1.4%)
Polish: 94 (1.0%)
Canadian: 92 (1.0%)
French: 91 (1.0%)
Italian: 80 (0.9%)
Ukrainian: 69 (0.7%)
Yugoslavian: 58 (0.6%)
Eastern European: 37 (0.4%)
Ethiopian: 36 (0.4%)
Scandinavian: 28 (0.3%)
British: 20 (0.2%)
Dutch: 16 (0.2%)
French Canadian: 16 (0.2%)
Russian: 13 (0.1%)
Northern European: 8 (0.09%)
African: 8 (0.09%)
Swiss: 6 (0.06%)
Hungarian: 4 (0.04%) Most common places of birth for foreign-born residents (%): Mexico Tullahoma:
28.2% (194)Tennessee:
23.0% (86,435)
China, excluding Hong Kong and Taiwan Tullahoma:
21.4% (147)Tennessee:
3.3% (12,582)
Canada Tullahoma:
11.5% (79)Tennessee:
2.7% (10,295)
Vietnam Tullahoma:
6.6% (45)Tennessee:
2.4% (8,894)
Ukraine Tullahoma:
4.7% (32)Tennessee:
0.6% (2,261)
Ethiopia Tullahoma:
3.6% (25)Tennessee:
1.4% (5,265)
Germany Tullahoma:
2.8% (19)Tennessee:
2.2% (8,261)
Uganda Tullahoma:
2.5% (17)Tennessee:
0.1% (251)
Thailand Tullahoma:
2.2% (15)Tennessee:
0.8% (3,002)
Russia Tullahoma:
1.7% (12)Tennessee:
0.7% (2,448)
Italy Tullahoma:
1.7% (12)Tennessee:
0.3% (1,178)
Place of birth for U.S.-born residents:
This state: 13,123Other state: 7,408Northeast: 1,092Midwest: 1,982South: 3,565West: 769 83.9% of Tullahoma residents lived in the same house 1 years ago.
Out of people who lived in different houses, 32.9% lived in this county.
Out of people who lived in different counties, 59.2% lived in Tennessee.
Tullahoma:
83.9%State average:
87.0%
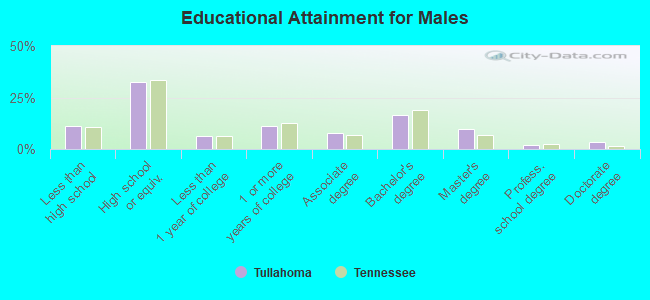
Education attainment for males 25 years and older:
No schooling: 13Nursery to 4th grade: 1015th and 6th grade: 427th and 8th grade: 649th grade: 10210th grade: 6911th grade: 18512th grade, no diploma: 248High school graduate (or equivalency): 2,435Less than 1 year of college: 466Some college more than 1 year, no degree: 822Associate degree: 571Bachelor's degree: 1,222Master's degree: 735Professional school degree: 128Doctorate degree: 235
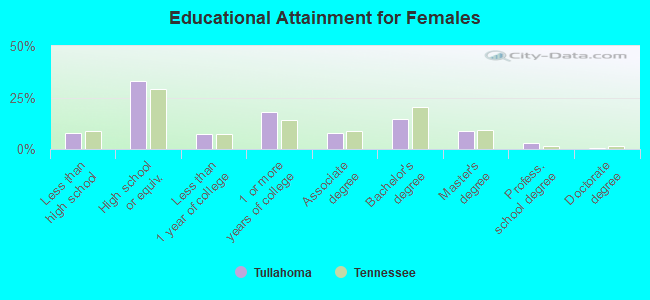
Education attainment for females 25 years and older:
No schooling: 103Nursery to 4th grade: 55th and 6th grade: 27th and 8th grade: 189th grade: 10110th grade: 15011th grade: 19112th grade, no diploma: 30High school graduate (or equivalency): 2,487Less than 1 year of college: 536Some college more than 1 year, no degree: 1,343Associate degree: 577Bachelor's degree: 1,085Master's degree: 641Professional school degree: 205Doctorate degree: 28
Housing units in structures:
One, detached: 7,251One, attached: 129Two: 2103 or 4: 2215 to 9: 92710 to 19: 19220 to 49: 17150 or more: 273Mobile homes: 334Housing units lacking complete plumbing facilities in 2022: 2.2%Housing units lacking complete kitchen facilities in 2022: 5.0%House/condo owner moved in on average 8 years ago
Renter moved in on average 4 years ago
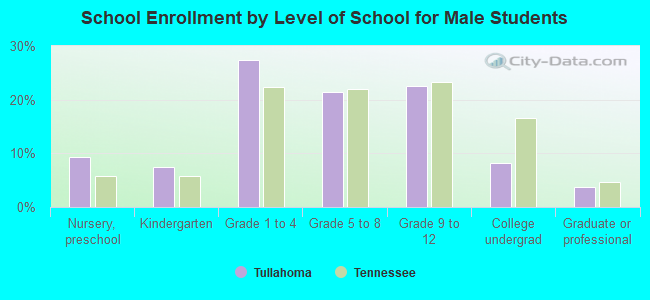
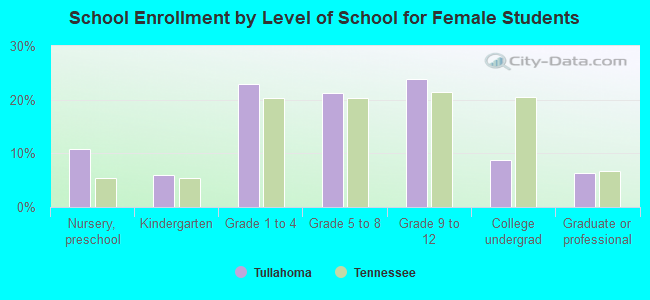
Private vs. public school enrollment:
Students in private schools in grades 1 to 8 (elementary and middle school): 146 Students in private schools in grades 9 to 12 (high school): 20 Students in private undergraduate colleges: 5