Tullytown, PA (Pennsylvania) Houses and Residents
| Tullytown: | $302,966 |
| Pennsylvania: | $245,500 |
Mean price in 2022:
Detached houses: $307,232
Here: $307,232 State: $317,202 Townhouses or other attached units: $217,796
Here: $217,796 State: $254,369
Total population: 1,862 (All urban)
Houses: 942 (918 occupied: 470 owner occupied, 457 renter occupied)
| % of renters here: | 49% |
| State: | 31% |
Housing density: 598 houses/condos per square mile
Median price asked for vacant for-sale houses and condos in 2022 in this county: $426,803.
Median contract rent in 2022: $1,182 (lower quartile is $883, upper quartile is $1,384)
Median rent asked for vacant for-rent units in 2022: $3,097
Median gross rent in Tullytown, PA in 2022: $1,183
Housing units in Tullytown with a mortgage: 325 (69 second mortgage, 2 home equity loan, 59 both second mortgage and home equity loan)
Houses without a mortgage: 12
Median household income for houses/condos with a mortgage: $111,161
Median household income for apartments without a mortgage: $61,619
Median monthly housing costs: $1,261
Compare current foreclosures near Tullytown, PA:
| Photo | Address | Area | Beds / Baths | Price | Details |
|---|---|---|---|---|---|

|
#1
Arneys Mount Rd
Pemberton, NJ 08068
|
2,514 sq. feet
|
2 baths 3 beds |
$399,000
|
show details |

|
#2
Brunswick Ave
Trenton, NJ 08618
|
1,088 sq. feet
|
1 baths 2 beds |
$68,500
|
show details |

|
#3
Monmouth Rd
Jobstown, NJ 08041
|
672 sq. feet
|
1 baths 2 beds |
$134,900
|
show details |

|
#4
Harvey Ave
Pennsauken, NJ 08110
|
1,555 sq. feet
|
2 baths 4 beds |
$415,000
|
show details |

|
#5
Foxglove Dr
Riverside, NJ 08075
|
840 sq. feet
|
1 baths 2 beds |
$113,683
|
show details |

|
#6
Moore Ct
Pennington, NJ 08534
|
940 sq. feet
|
1 baths 2 beds |
$195,993
|
show details |

|
#7
N Forklanding Rd
Maple Shade, NJ 08052
|
1,450 sq. feet
|
1 baths 3 beds |
$259,900
|
show details |

|
#8
N Cedar St
Bristol, PA 19007
|
841 sq. feet
|
1 baths 1 beds |
$307,500
|
show details |

|
#9
Scattergood St
Philadelphia, PA 19124
|
992 sq. feet
|
1 baths 3 beds |
$65,864
|
show details |

|
#10
Leonard St
Philadelphia, PA 19149
|
1,024 sq. feet
|
1 baths 3 beds |
$54,557
|
show details |
| Photo | Address | Area | Beds / Baths | Price | Details |
|---|---|---|---|---|---|

|
#11
Magnolia Rd
Pemberton, NJ 08068
|
- sq. feet
|
2 baths 4 beds |
$289,900
|
show details |

|
#12
Vista St
Philadelphia, PA 19136
|
1,078 sq. feet
|
1 baths 3 beds |
show details | |

|
#13
Torresdale Ave
Philadelphia, PA 19136
|
1,260 sq. feet
|
2 baths 3 beds |
show details | |

|
#14
Cottage St
Philadelphia, PA 19135
|
1,536 sq. feet
|
1 baths 4 beds |
show details | |

|
#15
Leon St
Philadelphia, PA 19136
|
1,280 sq. feet
|
1 baths 3 beds |
show details | |

|
#16
Franklin Ave
Croydon, PA 19021
|
1,559 sq. feet
|
2 baths 3 beds |
show details | |

|
#17
Vista St
Philadelphia, PA 19136
|
1,702 sq. feet
|
2 baths 3 beds |
show details | |

|
#18
Large St
Philadelphia, PA 19152
|
1,024 sq. feet
|
1 baths 2 beds |
show details | |

|
#19
Main St
Lumberton, NJ 08048
|
3,796 sq. feet
|
1 baths 5 beds |
show details | |

|
#20
Garfield Ave
Croydon, PA 19021
|
2,017 sq. feet
|
2 baths 3 beds |
show details |
| Photo | Address | Area | Beds / Baths | Price | Details |
|---|---|---|---|---|---|

|
#21
Adams St
Mount Laurel, NJ 08054
|
1,414 sq. feet
|
1 baths 3 beds |
show details | |

|
#22
Packard Ave
Huntingdon Valley, PA 19006
|
2,205 sq. feet
|
2 baths 4 beds |
show details | |

|
#23
New Albany Rd
Riverton, NJ 08077
|
1,494 sq. feet
|
2 baths 3 beds |
show details | |

|
#24
Turton Dr
Philadelphia, PA 19115
|
1,890 sq. feet
|
2 baths 4 beds |
show details | |

|
#25
Grant Ave
Philadelphia, PA 19115
|
1,080 sq. feet
|
1 baths 3 beds |
show details | |

|
#26
Altimari Ct
Southampton, PA 18966
|
1,693 sq. feet
|
2 baths 3 beds |
show details | |

|
#27
Old Newtown Rd
Philadelphia, PA 19115
|
2,300 sq. feet
|
2 baths 4 beds |
show details | |

|
#28
Hulmeville Rd
Bensalem, PA 19020
|
1,908 sq. feet
|
1 baths 3 beds |
show details | |

|
#29
Carlyle Dr
Wrightstown, NJ 08562
|
2,567 sq. feet
|
2 baths 3 beds |
show details | |

|
#30
Benson St
Philadelphia, PA 19136
|
1,088 sq. feet
|
1 baths 3 beds |
show details |
| Photo | Address | Area | Beds / Baths | Price | Details |
|---|---|---|---|---|---|

|
#31
Tynemouth Dr
Lumberton, NJ 08048
|
3,934 sq. feet
|
4 baths 5 beds |
show details | |

|
#32
Springhouse Ct
Bordentown, NJ 08505
|
3,040 sq. feet
|
2 baths 5 beds |
show details | |

|
#33
Barley Rd
Warminster, PA 18974
|
2,580 sq. feet
|
3 baths 5 beds |
show details | |

|
#34
Byberry Rd
Huntingdon Valley, PA 19006
|
1,361 sq. feet
|
2 baths 3 beds |
show details | |

|
#35
Lawrenceville Rd
Princeton, NJ 08540
|
2,409 sq. feet
|
3 baths 4 beds |
show details | |

|
#36
Emory Ave
Trenton, NJ 08611
|
1,232 sq. feet
|
2 baths 4 beds |
show details | |

|
#37
Algon Ave
Philadelphia, PA 19111
|
1,296 sq. feet
|
3 baths 3 beds |
show details | |

|
#38
Lardner St
Philadelphia, PA 19149
|
928 sq. feet
|
1 baths 3 beds |
show details | |

|
#39
S Boulevard Ave
Maple Shade, NJ 08052
|
1,262 sq. feet
|
2 baths 3 beds |
show details | |

|
#40
3rd Ave
Bristol, PA 19007
|
1,024 sq. feet
|
1 baths 3 beds |
show details |
| Photo | Address | Area | Beds / Baths | Price | Details |
|---|---|---|---|---|---|

|
#41
Fanshawe St
Philadelphia, PA 19111
|
1,200 sq. feet
|
1 baths 3 beds |
show details | |

|
#42
Plumtree Rd
Levittown, PA 19056
|
1,513 sq. feet
|
2 baths 4 beds |
show details | |

|
#43
Liberty Dr
Langhorne, PA 19047
|
1,480 sq. feet
|
2 baths 3 beds |
show details | |

|
#44
Fountain Rd
Levittown, PA 19056
|
2,289 sq. feet
|
2 baths 3 beds |
show details | |

|
#45
Hale St
Philadelphia, PA 19111
|
1,290 sq. feet
|
1 baths 3 beds |
show details | |

|
#46
Claridge St
Philadelphia, PA 19111
|
1,136 sq. feet
|
1 baths 3 beds |
show details | |

|
#47
Wood St
Bristol, PA 19007
|
1,339 sq. feet
|
1 baths 5 beds |
show details | |

|
#48
S Garfield Ave
Moorestown, NJ 08057
|
1,252 sq. feet
|
2 baths 3 beds |
show details | |

|
#49
Greeby St
Philadelphia, PA 19111
|
1,040 sq. feet
|
1 baths 3 beds |
show details | |

|
Check over 1 million property listings on Foreclosure.com!
|
browse all offers | |||

Latest news about housing in Tullytown, PA collected exclusively by city-data.com from local newspapers, TV, and radio stations

 | Which city has retained more of its poor white working class, Philadelphia or Pittsburgh? (10 replies) |
| Young family looking in Bucks County for first home (3 replies) |
| Far Northeast (33 replies) |
| Potential move from NYC - what areas should we visit? (15 replies) |
| White in Kensington?? (160 replies) |
| Looking for a safe philly suburb (97 replies) |

Median year apartment built: 1964
Household type by relationship:
Households: 2,320- Male householders: 498 (98 living alone), Female householders: 413 (148 living alone)
534 spouses (534 opposite-sex spouses), 82 unmarried partners, (82 opposite-sex unmarried partners), 590 children (554 natural, 11 adopted, 23 stepchildren), 75 grandchildren, 21 brothers or sisters, 40 parents, 0 foster children, 22 other relatives, 31 non-relatives
- In group quarters: 4
Size of family households: 302 2-persons, 167 3-persons, 103 4-persons, 34 5-persons, 18 6-persons, 13 7-or-more-persons.
Size of nonfamily households: 248 1-person, 40 2-persons.
350 married couples with children.
91 single-parent households (21 men, 70 women).
95.1% of residents of Tullytown speak English at home.
2.1% of residents speak Spanish at home (100% speak English very well).
1.8% of residents speak other Indo-European language at home (69% speak English very well, 18% speak English well, 13% speak English not well).
Foreign born population: 42 (1.8%)
(71.4% of them are naturalized citizens)
| Here: | 6.4 |
| State: | 6.8 |
| Here: | 3.6 |
| State: | 4.3 |

- Bedrooms in owner-occupied houses and condos in Tullytown, Pennsylvania
- 0no bedroom
- 31 bedroom
- 242 bedrooms
- 3043 bedrooms
- 1004 bedrooms
- 405+ bedrooms

- Bedrooms in renter-occupied apartments in Tullytown, Pennsylvania
- 8no bedroom
- 2671 bedroom
- 342 bedrooms
- 883 bedrooms
- 154 bedrooms
- 455+ bedrooms

- Cars and other vehicles available in Tullytown in owner-occupied houses/condos
- 14no vehicle
- 821 vehicle
- 1952 vehicles
- 1033 vehicles
- 594 vehicles
- 175+ vehicles

- Cars and other vehicles available in Tullytown in renter-occupied apartments
- 87no vehicle
- 1721 vehicle
- 1352 vehicles
- 583 vehicles
- 04 vehicles
- 55+ vehicles

- Rooms in owner-occupied houses in Tullytown, Pennsylvania
- 01 room
- 02 rooms
- 33 rooms
- 24 rooms
- 995 rooms
- 1396 rooms
- 1007 rooms
- 698 rooms
- 599+ rooms

- Rooms in renter-occupied apartments in Tullytown, Pennsylvania
- 81 room
- 182 rooms
- 2063 rooms
- 494 rooms
- 935 rooms
- 166 rooms
- 87 rooms
- 48 rooms
- 549+ rooms


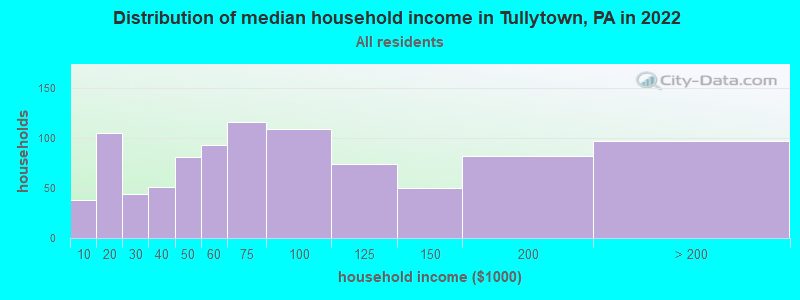
Tullytown, PA household income distribution

- 38Less than $10,000
- 105$10,000 to $19,999
- 44$20,000 to $29,999
- 51$30,000 to $39,999
- 81$40,000 to $49,999
- 93$50,000 to $59,999
- 116$60,000 to $74,999
- 109$75,000 to $99,999
- 74$100,000 to $124,999
- 50$125,000 to $149,999
- 82$150,000 to $199,999
- 97$200,000 or more
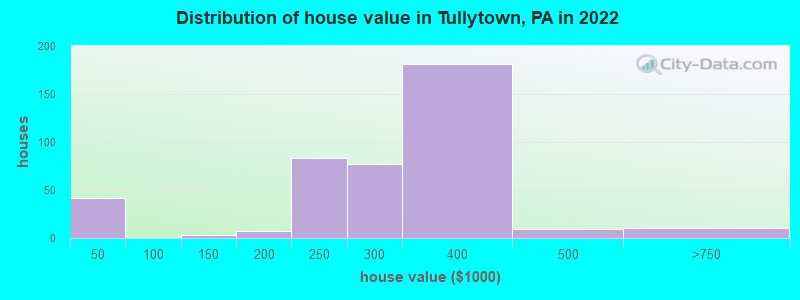
Home value of owner - occupied houses in 2022 in Tullytown, PA
-
- 31Less than $10,000
- 8$20,000 to $24,999
- 1$25,000 to $29,999
- 3$100,000 to $124,999
- 2$150,000 to $174,999
- 4$175,000 to $199,999
- 83$200,000 to $249,999
- 77$250,000 to $299,999
- 181$300,000 to $399,999
- 9$400,000 to $499,999
- 10$500,000 to $749,999
Rent paid by renters in 2022 in Tullytown, PA
-
- 44$200 to $249
- 10$250 to $299
- 1$300 to $349
- 3$350 to $399
- 20$400 to $449
- 4$500 to $549
- 9$600 to $649
- 8$650 to $699
- 1$700 to $749
- 11$750 to $799
- 29$800 to $899
- 3$900 to $999
- 142$1,000 to $1,249
- 76$1,250 to $1,499
- 71$1,500 to $1,999
- 3$2,000 to $2,499
- 23No cash rent


Percentage of workers working in this county: 72.0%
Number of people working at home: 110 (9.2% of all workers)
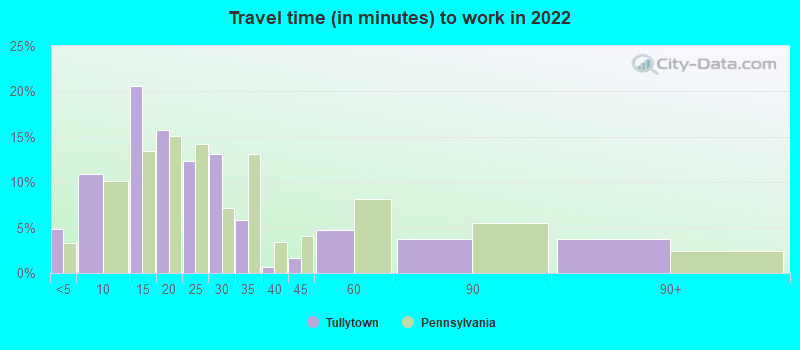
Travel time to work (commute)
- Less than 5 minutes: 18
- 5 to 9 minutes: 105
- 10 to 14 minutes: 216
- 15 to 19 minutes: 187
- 20 to 24 minutes: 115
- 25 to 29 minutes: 30
- 30 to 34 minutes: 100
- 35 to 39 minutes: 10
- 40 to 44 minutes: 9
- 45 to 59 minutes: 186
- 60 to 89 minutes: 54
- 90 or more minutes: 18
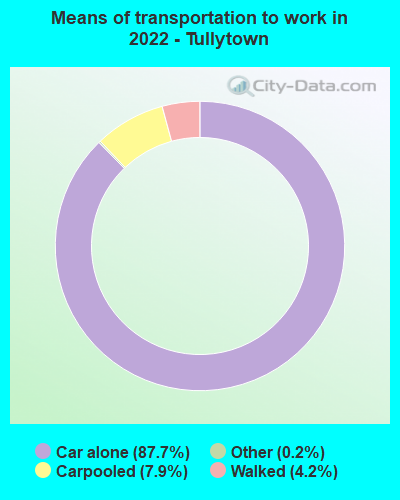
Means of transportation to work:
- Drove a car alone: 1,652 (79.6%)
- Carpooled: 138 (6.7%)
- Taxi: 4 (0.2%)
- Walked: 68 (3.3%)
- Worked at home: 110 (5.3%)

- Unemployment by race in 2022
- Unemployment rate for White non-Hispanic residents
- 0.5%Males
- 4.4%Females
- Unemployment rate for two or more race residents
- 22.5%Females
- Unemployment rate for Hispanic or Latino residents
- 25.4%Females

- Year of entry for the foreign-born population in Tullytown, Pennsylvania
- 122010 or later
- 102000 to 2009
- 121990 to 1999
- 41980 to 1989
- 01970 to 1979
- 21Before 1970

First ancestries reported:
- Italian: 178 (24.0%)
- Irish: 94 (12.7%)
- German: 74 (10.0%)
- Polish: 48 (6.5%)
- English: 47 (6.3%)
- American: 42 (5.7%)
- European: 23 (3.1%)
- Slovak: 12 (1.6%)
- Welsh: 12 (1.6%)
- French: 11 (1.5%)
- Scottish: 11 (1.5%)
- Czech: 8 (1.1%)
- Haitian: 6 (0.8%)
- Austrian: 5 (0.7%)
- Ukrainian: 5 (0.7%)
- French Canadian: 4 (0.5%)
- Dutch: 3 (0.4%)
- Eastern European: 3 (0.4%)
Most common places of birth for foreign-born residents (%):
| Tullytown: | 26.2% (11) |
| Pennsylvania: | 5.8% (54,190) |
| Tullytown: | 23.8% (10) |
| Pennsylvania: | 1.8% (16,884) |
| Tullytown: | 21.4% (9) |
| Pennsylvania: | 1.8% (17,032) |
| Tullytown: | 11.9% (5) |
| Pennsylvania: | 1.6% (15,224) |
| Tullytown: | 2.4% (1) |
| Pennsylvania: | 0.1% (1,263) |
Place of birth for U.S.-born residents:
- This state: 1,773
- Other state: 478
- Northeast: 415
- Midwest: 24
- South: 31
- West: 8
90.6% of Tullytown residents lived in the same house 1 years ago.
Out of people who lived in different houses, 48.7% lived in this county.
Out of people who lived in different counties, 64.7% lived in Pennsylvania.
| Tullytown: | 90.6% |
| State average: | 89.3% |
Education attainment for males 25 years and older:
- No schooling: 7
- Nursery to 4th grade: 0
- 5th and 6th grade: 0
- 7th and 8th grade: 1
- 9th grade: 3
- 10th grade: 11
- 11th grade: 12
- 12th grade, no diploma: 52
- High school graduate (or equivalency): 365
- Less than 1 year of college: 86
- Some college more than 1 year, no degree: 34
- Associate degree: 60
- Bachelor's degree: 114
- Master's degree: 50
- Professional school degree: 0
- Doctorate degree: 0

Education attainment for females 25 years and older:
- No schooling: 7
- Nursery to 4th grade: 0
- 5th and 6th grade: 0
- 7th and 8th grade: 0
- 9th grade: 2
- 10th grade: 5
- 11th grade: 5
- 12th grade, no diploma: 11
- High school graduate (or equivalency): 353
- Less than 1 year of college: 40
- Some college more than 1 year, no degree: 85
- Associate degree: 111
- Bachelor's degree: 122
- Master's degree: 27
- Professional school degree: 0
- Doctorate degree: 0


Housing units in structures:
- One, detached: 589
- One, attached: 11
- Two: 28
- 3 or 4: 82
- 5 to 9: 32
- 10 to 19: 18
- 20 to 49: 73
- 50 or more: 106
House/condo owner moved in on average 23 years ago
Renter moved in on average 5 years ago

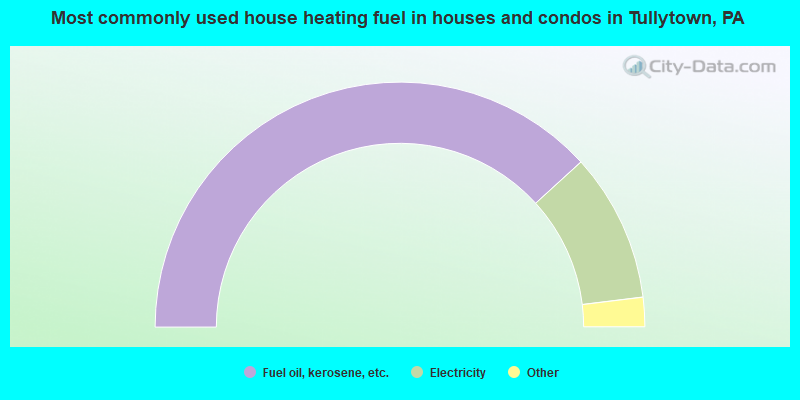
- 76.7%Fuel oil, kerosene, etc.
- 19.7%Electricity
- 1.9%Bottled, tank, or LP gas
- 0.9%Utility gas
- 0.9%Other fuel
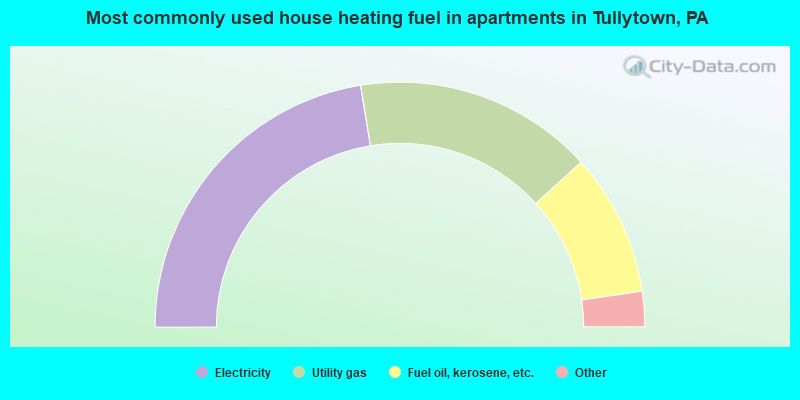
- 45.1%Electricity
- 31.8%Utility gas
- 18.9%Fuel oil, kerosene, etc.
- 2.0%Wood
- 1.1%Other fuel
- 1.1%No fuel used
Private vs. public school enrollment:
| Here: | 0.0% |
| Pennsylvania: | 15.7% |
| Here: | 7.1% |
| Pennsylvania: | 13.4% |
| Here: | 20.0% |
| Pennsylvania: | 39.8% |


