Tumwater, WA (Washington) Houses and Residents
| Tumwater: | $500,193 |
| Washington: | $569,500 |
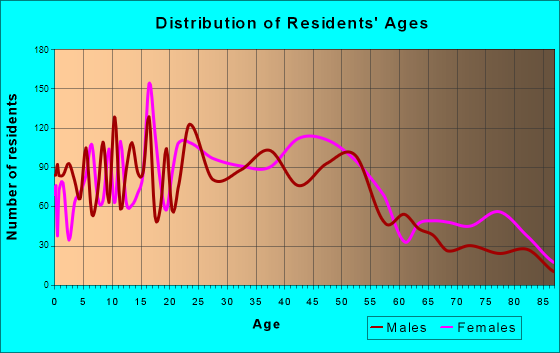
Total population: 18,820 (Urban population: 12,607, Rural population: 39 (all nonfarm))
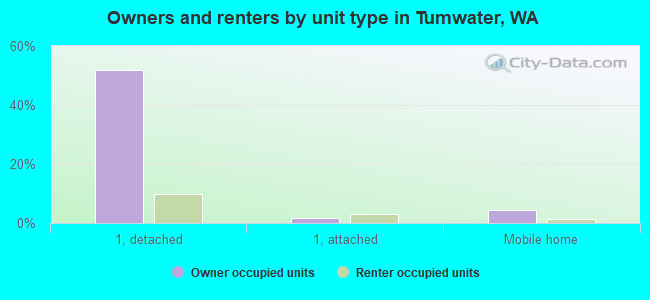
Houses: 10,615 (10,251 occupied: 6,070 owner occupied, 4,144 renter occupied)
| % of renters here: | 41% |
| State: | 36% |
Housing density: 1,067 houses/condos per square mile
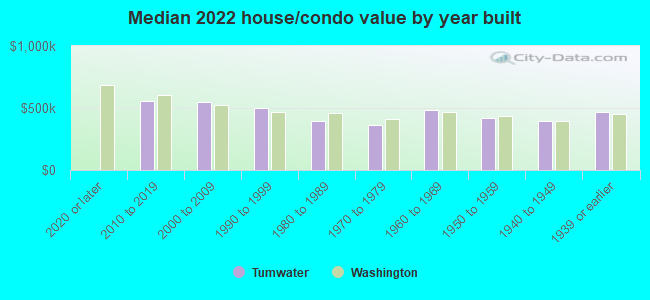
Median price asked for vacant for-sale houses and condos in 2022: $534,422.
Median contract rent in 2022: $1,455 (lower quartile is $1,163, upper quartile is $1,857)
Median rent asked for vacant for-rent units in 2022: $4,948
Median gross rent in Tumwater, WA in 2022: $1,592
Housing units in Tumwater with a mortgage: 4,145 (382 second mortgage, 0 home equity loan, 373 both second mortgage and home equity loan)
Houses without a mortgage: 47
Median household income for houses/condos with a mortgage: $130,114
Median household income for apartments without a mortgage: $67,028
Median monthly housing costs: $1,664
Compare current foreclosures near Tumwater, WA:
| Photo | Address | Area | Beds / Baths | Price | Details |
|---|---|---|---|---|---|

|
#1
25th Loop SE
Lacey, WA 98503
|
1,834 sq. feet
|
1 baths 3 beds |
show details | |

|
#2
E Budd Dr
Shelton, WA 98584
|
1,404 sq. feet
|
2 baths 3 beds |
show details | |

|
#3
Whittaker Rd NW
Olympia, WA 98502
|
2,517 sq. feet
|
- baths - beds |
$11,441
|
show details |

|
#4
Carole Dr NE
Olympia, WA 98516
|
1,440 sq. feet
|
2 baths 2 beds |
show details | |

|
#5
Bronson St SE
Tenino, WA 98589
|
1,554 sq. feet
|
2 baths 3 beds |
show details | |

|
#6
36th Ct SE
Lacey, WA 98503
|
1,344 sq. feet
|
2 baths 2 beds |
show details | |

|
#7
Point View St NE
Olympia, WA 98516
|
1,630 sq. feet
|
1 baths 3 beds |
show details | |

|
#8
Barrington Ln SE
Olympia, WA 98513
|
1,514 sq. feet
|
2 baths 3 beds |
show details | |

|
#9
Nutmeg St SW
Rochester, WA 98579
|
1,486 sq. feet
|
2 baths 3 beds |
show details | |

|
#10
Ramblewood Ln SE
Olympia, WA 98513
|
1,768 sq. feet
|
1 baths 3 beds |
show details |
| Photo | Address | Area | Beds / Baths | Price | Details |
|---|---|---|---|---|---|

|
#11
99th Ave SE
Yelm, WA 98597
|
1,560 sq. feet
|
2 baths 3 beds |
show details | |

|
#12
N Nenant Street
Bucoda, WA 98530
|
1,344 sq. feet
|
2 baths 3 beds |
show details | |

|
#13
Mazama St SW
Olympia, WA 98512
|
1,786 sq. feet
|
2 baths 3 beds |
show details | |

|
#14
Canal Rd SE
Yelm, WA 98597
|
1,608 sq. feet
|
2 baths 3 beds |
show details | |

|
#15
Kodiak Ave NE
Olympia, WA 98516
|
1,863 sq. feet
|
2 baths 4 beds |
show details | |

|
#16
E Lynwood Dr
Shelton, WA 98584
|
1,404 sq. feet
|
2 baths 3 beds |
show details | |

|
#17
E Lakeshore Dr W
Shelton, WA 98584
|
- sq. feet
|
2 baths 3 beds |
show details | |

|
#18
200th Avenue Kp S
Lakebay, WA 98349
|
2,360 sq. feet
|
2 baths 4 beds |
show details | |

|
#19
Cherry Ln SE
Olympia, WA 98501
|
1,173 sq. feet
|
1 baths 3 beds |
show details | |

|
#20
Ellinor Ave
Shelton, WA 98584
|
2,080 sq. feet
|
3 baths 4 beds |
show details |
| Photo | Address | Area | Beds / Baths | Price | Details |
|---|---|---|---|---|---|

|
#21
Foxfire Dr SE
Olympia, WA 98513
|
1,008 sq. feet
|
1 baths 3 beds |
show details | |

|
#22
3rd Ct SE
Olympia, WA 98513
|
1,502 sq. feet
|
2 baths 3 beds |
show details | |

|
#23
Quinault Dr NE
Olympia, WA 98516
|
1,066 sq. feet
|
1 baths 3 beds |
show details | |

|
#24
Foxfire Dr SE
Olympia, WA 98513
|
1,104 sq. feet
|
2 baths 3 beds |
show details | |

|
#25
Condor Loop NE
Olympia, WA 98516
|
1,852 sq. feet
|
1 baths 3 beds |
show details | |

|
#26
Alki St NE
Olympia, WA 98516
|
1,412 sq. feet
|
2 baths 3 beds |
show details | |

|
#27
Alki St NE
Olympia, WA 98516
|
1,442 sq. feet
|
2 baths 3 beds |
show details | |

|
#28
Piperhill Dr SE
Olympia, WA 98513
|
2,685 sq. feet
|
2 baths 3 beds |
show details | |

|
#29
Bacall St NE
Olympia, WA 98516
|
1,552 sq. feet
|
2 baths 3 beds |
show details | |

|
#30
Mallard Ct SE
Olympia, WA 98513
|
2,032 sq. feet
|
2 baths 3 beds |
show details |
| Photo | Address | Area | Beds / Baths | Price | Details |
|---|---|---|---|---|---|

|
#31
Libby Rd NE
Olympia, WA 98506
|
1,740 sq. feet
|
2 baths 3 beds |
show details | |

|
#32
Espirit Ct SE
Olympia, WA 98513
|
1,612 sq. feet
|
2 baths 3 beds |
show details | |

|
#33
Lilac St SE
Lacey, WA 98503
|
1,444 sq. feet
|
2 baths 3 beds |
show details | |

|
#34
60th Loop SE
Olympia, WA 98513
|
1,944 sq. feet
|
3 baths 3 beds |
show details | |

|
#35
Tri Lake Loop SE
Olympia, WA 98513
|
1,473 sq. feet
|
2 baths 3 beds |
show details | |

|
#36
Lakemont Dr SE
Olympia, WA 98513
|
1,954 sq. feet
|
2 baths 3 beds |
show details | |

|
#37
Briar St SE
Yelm, WA 98597
|
1,344 sq. feet
|
2 baths 2 beds |
show details | |

|
#38
Malibu Dr SE
Lacey, WA 98503
|
1,048 sq. feet
|
1 baths 2 beds |
show details | |

|
#39
Timberline Dr SE
Lacey, WA 98503
|
1,883 sq. feet
|
3 baths 4 beds |
show details | |

|
#40
Carpenter Rd SE
Lacey, WA 98503
|
904 sq. feet
|
1 baths 2 beds |
show details |
| Photo | Address | Area | Beds / Baths | Price | Details |
|---|---|---|---|---|---|

|
#41
Titan Dr SE
Lacey, WA 98503
|
1,874 sq. feet
|
2 baths 3 beds |
show details | |

|
#42
Henslin Ct SE
Olympia, WA 98513
|
1,176 sq. feet
|
1 baths 3 beds |
show details | |

|
#43
Madora Dr SE
Lacey, WA 98503
|
1,560 sq. feet
|
2 baths 3 beds |
show details | |

|
#44
Malibu Dr SE
Lacey, WA 98503
|
1,048 sq. feet
|
1 baths 2 beds |
show details | |

|
#45
Champion Dr SW
Olympia, WA 98512
|
880 sq. feet
|
1 baths 1 beds |
show details | |

|
#46
Clearwater Dr SE
Lacey, WA 98503
|
1,757 sq. feet
|
2 baths 3 beds |
show details | |

|
#47
Royal Oak Dr SE
Lacey, WA 98503
|
1,408 sq. feet
|
1 baths 3 beds |
show details | |

|
#48
E Wood Ln
Shelton, WA 98584
|
650 sq. feet
|
1 baths 2 beds |
show details | |

|
#49
Compton Blvd SE
Olympia, WA 98513
|
1,532 sq. feet
|
3 baths 3 beds |
show details | |

|
Check over 1 million property listings on Foreclosure.com!
|
browse all offers | |||

Latest news about housing in Tumwater, WA collected exclusively by city-data.com from local newspapers, TV, and radio stations

 | Buying a house in Olympia. What red flags should we look for? (3 replies) |
| Olympia Housing and Apartments (2 replies) |
| Apartments in Olympia (3 replies) |
| Renter priced out again! please help (45 replies) |
| Possible Move to Washington State (38 replies) |
| Is Aberdeen Washington, a lost cause? (77 replies) |
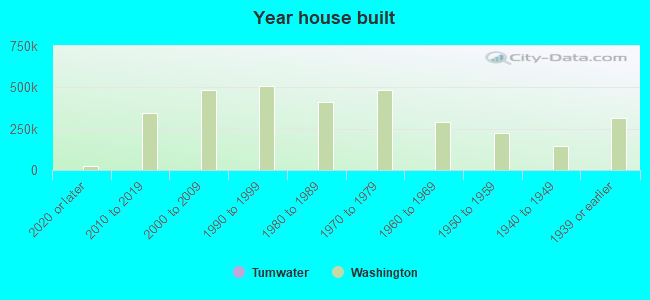
Median year apartment built: 1990
Household type by relationship:
Households: 26,007- Male householders: 4,667 (1,036 living alone), Female householders: 5,451 (1,662 living alone)
4,658 spouses (4,641 opposite-sex spouses), 1,023 unmarried partners, (959 opposite-sex unmarried partners), 7,087 children (6,271 natural, 177 adopted, 638 stepchildren), 481 grandchildren, 220 brothers or sisters, 358 parents, 33 foster children, 322 other relatives, 1,125 non-relatives
- In group quarters: 576
Size of family households: 2,660 2-persons, 1,647 3-persons, 1,189 4-persons, 434 5-persons, 184 6-persons, 79 7-or-more-persons.
Size of nonfamily households: 2,970 1-person, 802 2-persons, 173 3-persons.
3,466 married couples with children.
1,195 single-parent households (391 men, 804 women).
91.0% of residents of Tumwater speak English at home.
2.6% of residents speak Spanish at home (87% speak English very well, 4% speak English well, 6% speak English not well, 4% don't speak English at all).
1.9% of residents speak other Indo-European language at home (66% speak English very well, 19% speak English well, 15% speak English not well).
2.8% of residents speak Asian or Pacific Island language at home (48% speak English very well, 20% speak English well, 33% speak English not well).
0.9% of residents speak other language at home (80% speak English very well, 20% speak English well).
Foreign born population: 1,753 (6.7%)
(68.9% of them are naturalized citizens)
| Here: | 6.4 |
| State: | 6.5 |
| Here: | 3.9 |
| State: | 3.9 |
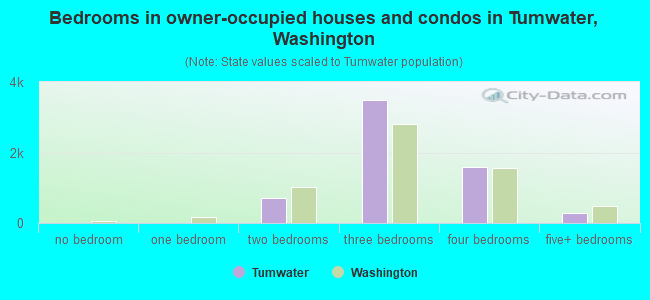
- Bedrooms in owner-occupied houses and condos in Tumwater, Washington
- 5no bedroom
- 101 bedroom
- 6962 bedrooms
- 3,5023 bedrooms
- 1,5884 bedrooms
- 2705+ bedrooms
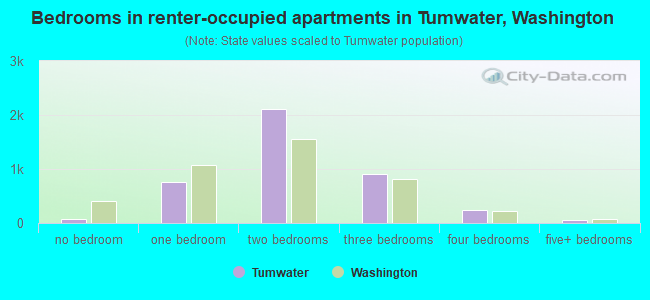
- Bedrooms in renter-occupied apartments in Tumwater, Washington
- 82no bedroom
- 7641 bedroom
- 2,1152 bedrooms
- 9023 bedrooms
- 2354 bedrooms
- 475+ bedrooms
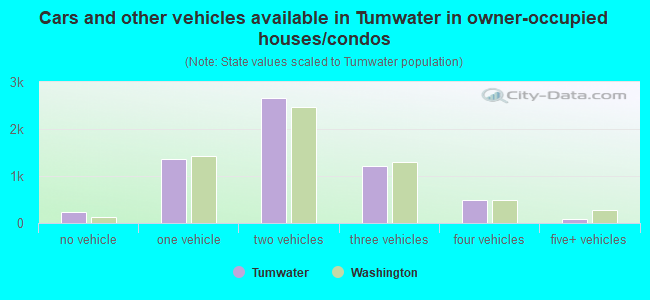
- Cars and other vehicles available in Tumwater in owner-occupied houses/condos
- 233no vehicle
- 1,3681 vehicle
- 2,6582 vehicles
- 1,2183 vehicles
- 5004 vehicles
- 935+ vehicles
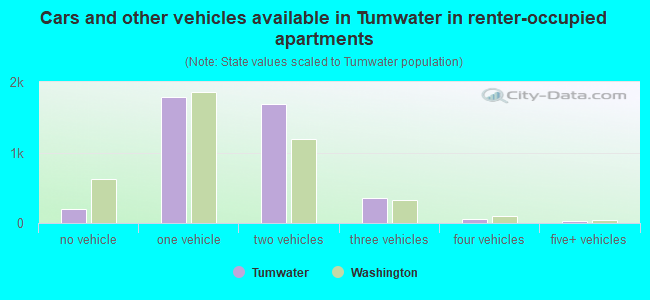
- Cars and other vehicles available in Tumwater in renter-occupied apartments
- 205no vehicle
- 1,7941 vehicle
- 1,6952 vehicles
- 3603 vehicles
- 574 vehicles
- 345+ vehicles
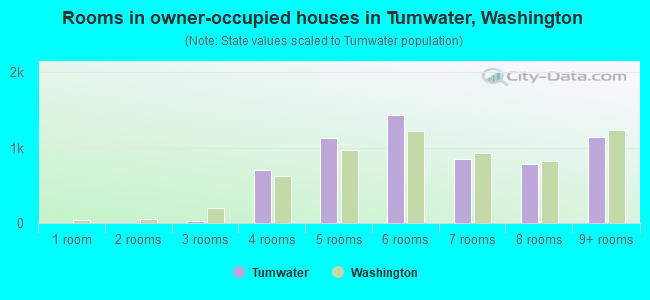
- Rooms in owner-occupied houses in Tumwater, Washington
- 51 room
- 02 rooms
- 203 rooms
- 7074 rooms
- 1,1315 rooms
- 1,4336 rooms
- 8517 rooms
- 7818 rooms
- 1,1429+ rooms
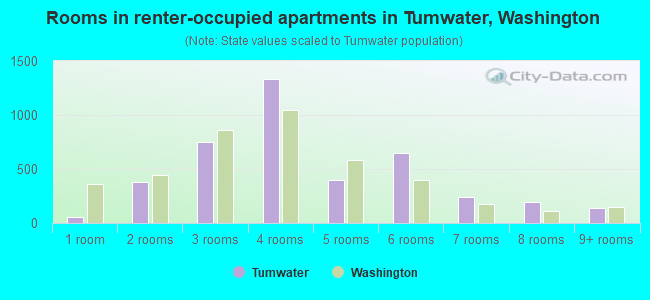
- Rooms in renter-occupied apartments in Tumwater, Washington
- 511 room
- 3782 rooms
- 7543 rooms
- 1,3354 rooms
- 3995 rooms
- 6516 rooms
- 2447 rooms
- 1948 rooms
- 1389+ rooms
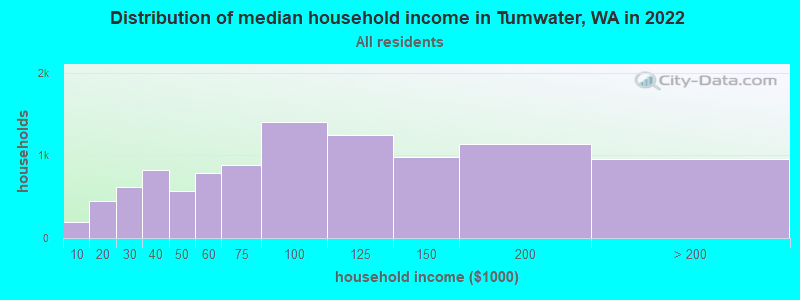
Tumwater, WA household income distribution

- 191Less than $10,000
- 450$10,000 to $19,999
- 617$20,000 to $29,999
- 817$30,000 to $39,999
- 567$40,000 to $49,999
- 783$50,000 to $59,999
- 883$60,000 to $74,999
- 1,404$75,000 to $99,999
- 1,251$100,000 to $124,999
- 980$125,000 to $149,999
- 1,134$150,000 to $199,999
- 959$200,000 or more
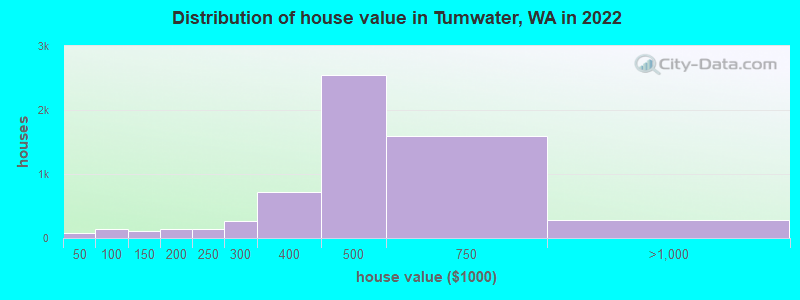
Home value of owner - occupied houses in 2022 in Tumwater, WA
-
- 13Less than $10,000
- 23$10,000 to $14,999
- 1$15,000 to $19,999
- 11$20,000 to $24,999
- 1$25,000 to $29,999
- 1$30,000 to $34,999
- 28$40,000 to $49,999
- 55$60,000 to $69,999
- 31$70,000 to $79,999
- 15$80,000 to $89,999
- 10$90,000 to $99,999
- 59$100,000 to $124,999
- 53$125,000 to $149,999
- 105$150,000 to $174,999
- 41$175,000 to $199,999
- 139$200,000 to $249,999
- 267$250,000 to $299,999
- 715$300,000 to $399,999
- 2,547$400,000 to $499,999
- 1,600$500,000 to $749,999
- 237$750,000 to $999,999
- 16$1,500,000 to $1,999,999
- 21$2,000,000 or more
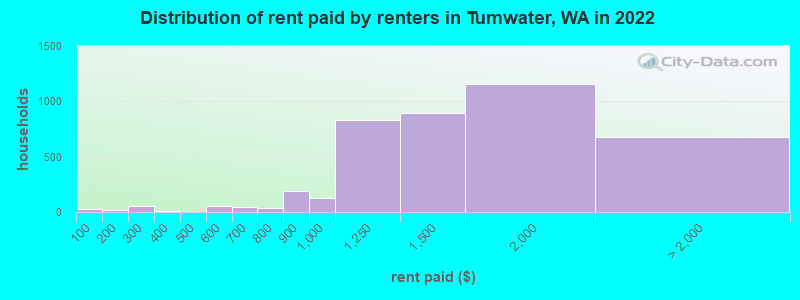
Rent paid by renters in 2022 in Tumwater, WA
-
- 26Less than $100
- 10$100 to $149
- 11$150 to $199
- 54$250 to $299
- 12$350 to $399
- 54$550 to $599
- 27$600 to $649
- 17$650 to $699
- 29$700 to $749
- 2$750 to $799
- 187$800 to $899
- 121$900 to $999
- 835$1,000 to $1,249
- 896$1,250 to $1,499
- 1,152$1,500 to $1,999
- 446$2,000 to $2,499
- 94$2,500 to $2,999
- 17$3,500 or more
- 118No cash rent
Percentage of workers working in this county: 85.9%
Number of people working at home: 3,341 (24.8% of all workers)
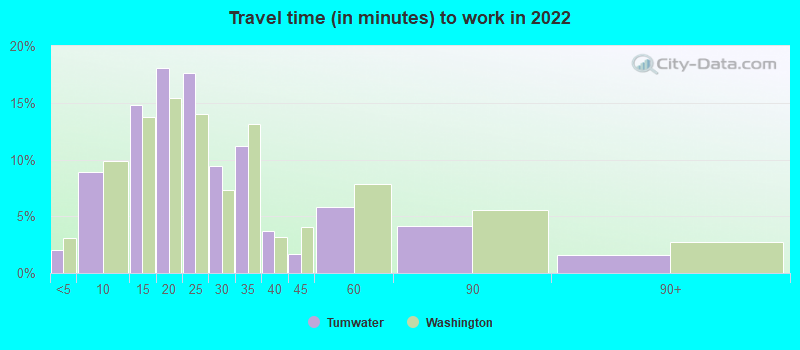
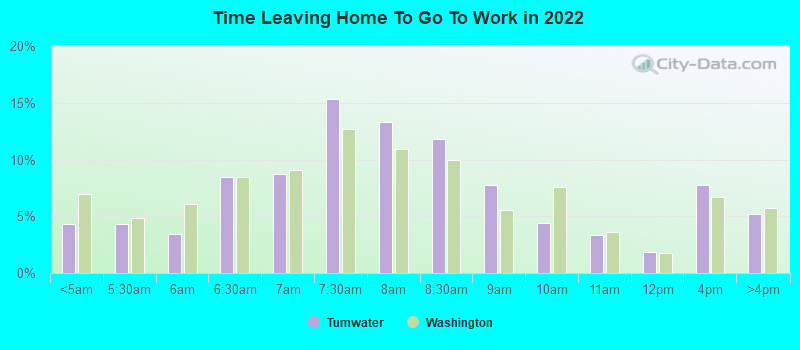
Travel time to work (commute)
- Less than 5 minutes: 349
- 5 to 9 minutes: 1,338
- 10 to 14 minutes: 2,705
- 15 to 19 minutes: 2,204
- 20 to 24 minutes: 1,152
- 25 to 29 minutes: 317
- 30 to 34 minutes: 633
- 35 to 39 minutes: 266
- 40 to 44 minutes: 455
- 45 to 59 minutes: 626
- 60 to 89 minutes: 250
- 90 or more minutes: 114
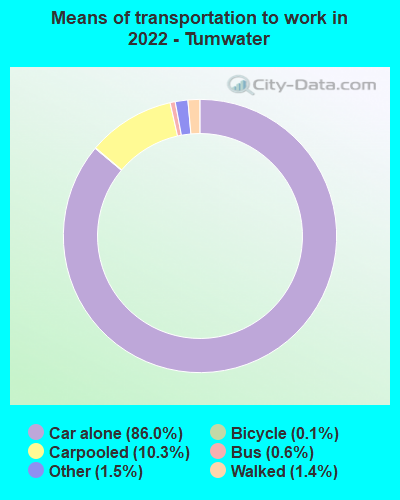
Means of transportation to work:
- Drove a car alone: 14,866 (69.9%)
- Carpooled: 1,692 (8.0%)
- Bus: 97 (0.5%)
- Taxi: 225 (1.1%)
- Bicycle: 18 (0.1%)
- Walked: 457 (2.1%)
- Worked at home: 3,341 (15.7%)
- Unemployment by race in 2022
- Unemployment rate for White non-Hispanic residents
- 1.7%Males
- 2.7%Females
- Unemployment rate for Black residents
- 46.8%Males
- 23.8%Females
- Unemployment rate for Asian residents
- 5.6%Males
- 7.1%Females
- Unemployment rate for other race residents
- 25.6%Females
- Unemployment rate for two or more race residents
- 5.8%Males
- 2.9%Females
- Unemployment rate for Hispanic or Latino residents
- 6.8%Females
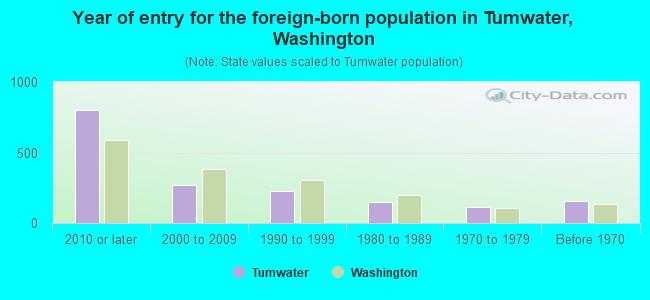
- Year of entry for the foreign-born population in Tumwater, Washington
- 8042010 or later
- 2702000 to 2009
- 2261990 to 1999
- 1481980 to 1989
- 1101970 to 1979
- 155Before 1970
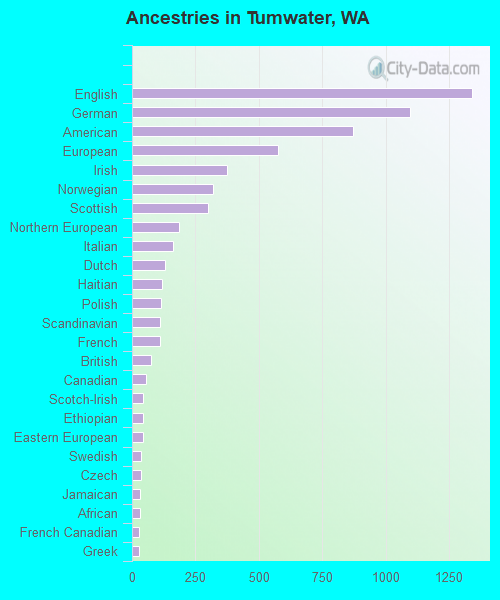
First ancestries reported:
- English: 1,341 (13.4%)
- German: 1,096 (10.9%)
- American: 873 (8.7%)
- European: 577 (5.8%)
- Irish: 374 (3.7%)
- Norwegian: 320 (3.2%)
- Scottish: 299 (3.0%)
- Northern European: 186 (1.9%)
- Italian: 161 (1.6%)
- Dutch: 132 (1.3%)
- Haitian: 117 (1.2%)
- Polish: 115 (1.1%)
- Scandinavian: 112 (1.1%)
- French: 111 (1.1%)
- British: 73 (0.7%)
- Canadian: 56 (0.6%)
- Scotch-Irish: 44 (0.4%)
- Ethiopian: 44 (0.4%)
- Eastern European: 42 (0.4%)
- Swedish: 36 (0.4%)
- Czech: 35 (0.3%)
- Jamaican: 31 (0.3%)
- African: 31 (0.3%)
- French Canadian: 27 (0.3%)
- Greek: 26 (0.3%)
- Croatian: 26 (0.3%)
- Danish: 25 (0.2%)
- Nigerian: 22 (0.2%)
- Romanian: 20 (0.2%)
- Iraqi: 16 (0.2%)
- Finnish: 15 (0.1%)
- Slovene: 15 (0.1%)
- Belgian: 15 (0.1%)
- Brazilian: 14 (0.1%)
- Lithuanian: 11 (0.1%)
- Welsh: 7 (0.07%)
- Afghan: 4 (0.04%)
Most common places of birth for foreign-born residents (%):
| Tumwater: | 12.9% (231) |
| Washington: | 5.4% (62,003) |
| Tumwater: | 12.6% (226) |
| Washington: | 0.2% (2,421) |
| Tumwater: | 8.6% (154) |
| Washington: | 21.1% (241,655) |
| Tumwater: | 7.8% (140) |
| Washington: | 1.6% (17,938) |
| Tumwater: | 6.1% (110) |
| Washington: | 4.1% (47,238) |
| Tumwater: | 5.1% (92) |
| Washington: | 0.3% (3,180) |
| Tumwater: | 4.5% (81) |
| Washington: | 4.3% (48,886) |
| Tumwater: | 4.3% (77) |
| Washington: | 7.4% (84,470) |
| Tumwater: | 4.1% (74) |
| Washington: | 0.9% (9,937) |
| Tumwater: | 3.8% (68) |
| Washington: | 0.1% (1,444) |
| Tumwater: | 3.4% (61) |
| Washington: | 0.2% (2,647) |
| Tumwater: | 3.2% (58) |
| Washington: | 8.9% (101,353) |
| Tumwater: | 2.8% (50) |
| Washington: | 1.2% (13,855) |
| Tumwater: | 2.7% (49) |
| Washington: | 0.5% (6,259) |
| Tumwater: | 2.5% (44) |
| Washington: | 6.3% (71,661) |
| Tumwater: | 2.3% (42) |
| Washington: | 0.3% (2,941) |
| Tumwater: | 2.1% (38) |
| Washington: | 1.2% (13,745) |
| Tumwater: | 2.0% (36) |
| Washington: | 1.0% (10,943) |
| Tumwater: | 2.0% (36) |
| Washington: | 1.6% (17,761) |
| Tumwater: | 2.0% (36) |
| Washington: | 0.7% (8,540) |
| Tumwater: | 1.9% (34) |
| Washington: | 0.3% (3,471) |
Place of birth for U.S.-born residents:
- This state: 13,207
- Other state: 10,137
- Northeast: 1,011
- Midwest: 1,594
- South: 2,516
- West: 5,080
82.2% of Tumwater residents lived in the same house 1 years ago.
Out of people who lived in different houses, 29.1% lived in this county.
Out of people who lived in different counties, 34.0% lived in Washington.
| Tumwater: | 82.2% |
| State average: | 85.2% |
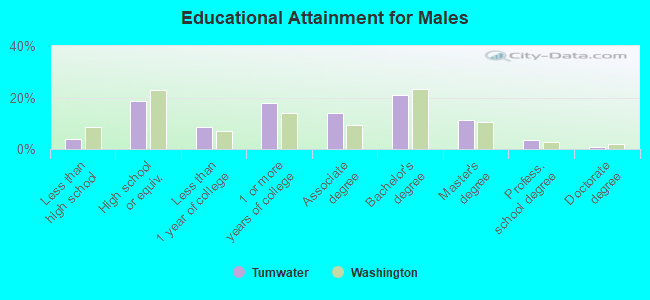
Education attainment for males 25 years and older:
- No schooling: 35
- Nursery to 4th grade: 0
- 5th and 6th grade: 30
- 7th and 8th grade: 25
- 9th grade: 0
- 10th grade: 53
- 11th grade: 111
- 12th grade, no diploma: 77
- High school graduate (or equivalency): 1,621
- Less than 1 year of college: 732
- Some college more than 1 year, no degree: 1,538
- Associate degree: 1,214
- Bachelor's degree: 1,814
- Master's degree: 966
- Professional school degree: 314
- Doctorate degree: 80
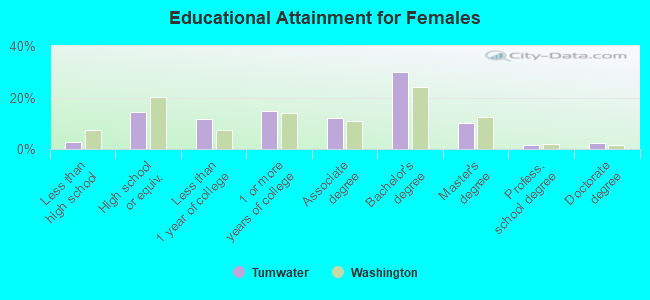
Education attainment for females 25 years and older:
- No schooling: 43
- Nursery to 4th grade: 19
- 5th and 6th grade: 0
- 7th and 8th grade: 0
- 9th grade: 27
- 10th grade: 30
- 11th grade: 74
- 12th grade, no diploma: 102
- High school graduate (or equivalency): 1,469
- Less than 1 year of college: 1,197
- Some college more than 1 year, no degree: 1,521
- Associate degree: 1,229
- Bachelor's degree: 3,066
- Master's degree: 1,027
- Professional school degree: 159
- Doctorate degree: 244
Housing units in structures:
- One, detached: 6,480
- One, attached: 536
- Two: 478
- 3 or 4: 223
- 5 to 9: 1,019
- 10 to 19: 647
- 20 to 49: 208
- 50 or more: 336
- Mobile homes: 683
Median worth of mobile homes: $148,483
Housing units lacking complete kitchen facilities in 2022: 1.5%
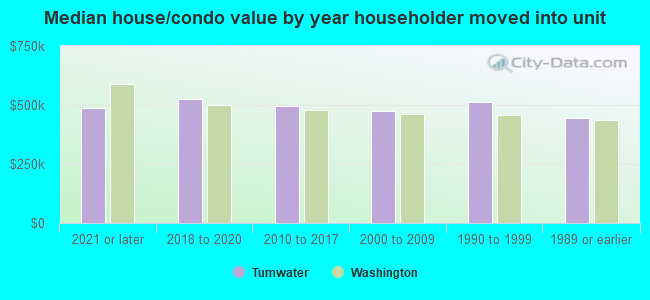
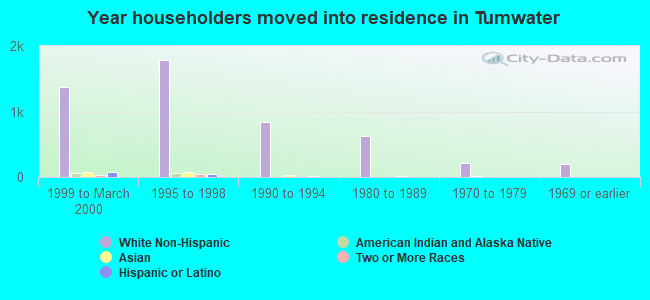
House/condo owner moved in on average 8 years ago
Renter moved in on average 4 years ago
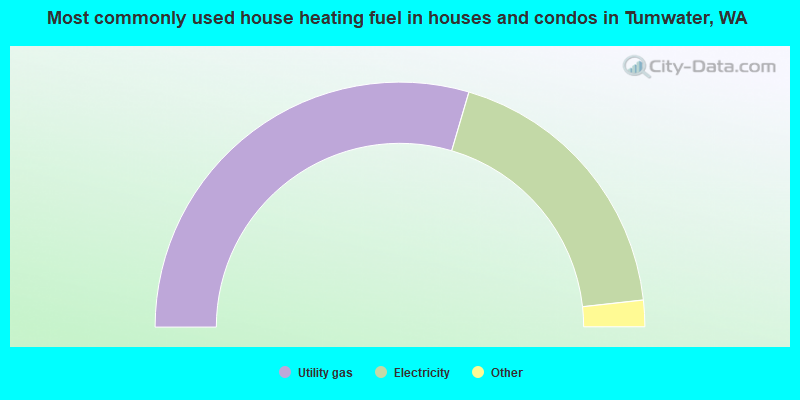
- 59.1%Utility gas
- 37.4%Electricity
- 1.6%Fuel oil, kerosene, etc.
- 1.0%Wood
- 0.6%Bottled, tank, or LP gas
- 0.3%Other fuel
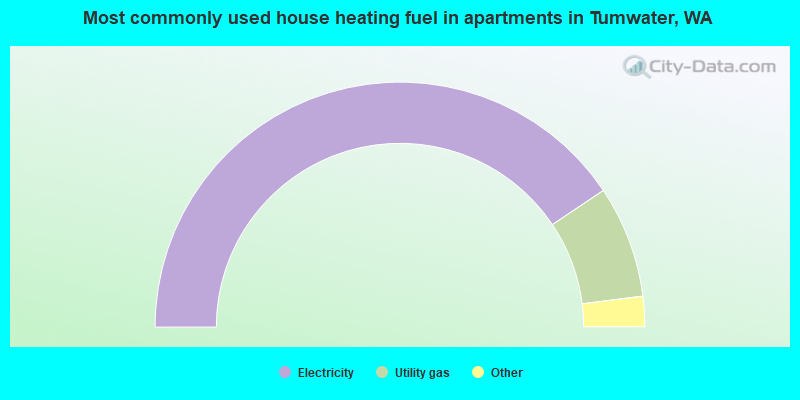
- 81.2%Electricity
- 14.8%Utility gas
- 1.7%Wood
- 1.1%Bottled, tank, or LP gas
- 0.6%No fuel used
- 0.3%Other fuel
- 0.3%Fuel oil, kerosene, etc.
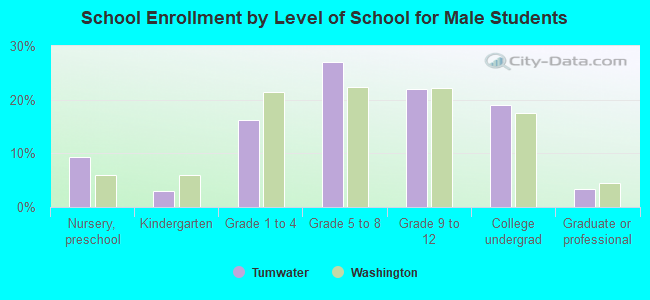
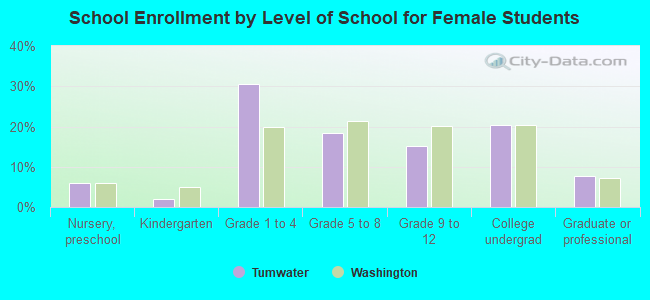
Private vs. public school enrollment:
| Here: | 4.1% |
| Washington: | 12.4% |
| Here: | 11.3% |
| Washington: | 9.2% |
| Here: | 7.0% |
| Washington: | 16.5% |