Tunbridge, VT (Vermont) Houses and Residents
| Tunbridge: | $293,769 |
| Vermont: | $304,700 |
Total population: 1,284 (Urban population: 0, Rural population: 1,323 (95 farm, 1,228 nonfarm))
Houses: 678 (514 occupied: 410 owner occupied, 104 renter occupied)
| % of renters here: | 20% |
| State: | 26% |
Housing density: 15 houses/condos per square mile
Median price asked for vacant for-sale houses and condos in 2022 in this county: $178,102.
Median contract rent in 2022: $759 (lower quartile is $676, upper quartile is $1,258)
Median gross rent in Tunbridge, VT in 2022: $1,112
Housing units in Tunbridge with a mortgage: 59 (7 second mortgage, 12 home equity loan, 0 both second mortgage and home equity loan)
Houses without a mortgage: 68


Latest news about housing in Tunbridge, VT collected exclusively by city-data.com from local newspapers, TV, and radio stations

 | Moving to Newport Vt from NV and wanted a bit more info :) (33 replies) |
| Randolph, Quechee, Upper Valley (22 replies) |
| What is your favorite Vermont event? (15 replies) |
| loved Burlington, but...... (65 replies) |
| Real Estate Buyers' Agents (3 replies) |
| Why Do People Leave Vermont? (596 replies) |

Household type by relationship:
Households: 28,221- In family households: 23,084 (5,404 male householders, 2,461 female householders)
6,175 spouses, 7,177 children (6,496 natural, 270 adopted, 411 stepchildren), 403 grandchildren, 120 brothers or sisters, 172 parents, foster children, 173 other relatives, 855 non-relatives
- In nonfamily households: 5,137 (1,987 male householders (1,458 living alone)), 2,035 female householders (1,620 living alone)), 1,115 nonrelatives
- In group quarters: 715 (86 institutionalized population)
5,082 married couples with children.
1,661 single-parent households (504 men, 1,157 women).
98.4% of residents of Tunbridge speak English at home.
0.8% of residents speak Spanish at home (100% speak English very well).
0.8% of residents speak other Indo-European language at home (100% speak English very well).
Foreign born population: 19 (1.3%)
(63.2% of them are naturalized citizens)
| Here: | 6.4 |
| State: | 6.4 |
| Here: | 5.4 |
| State: | 3.9 |

- Bedrooms in owner-occupied houses and condos in Tunbridge, Vermont
- 8no bedroom
- 201 bedroom
- 1062 bedrooms
- 1853 bedrooms
- 574 bedrooms
- 345+ bedrooms

- Bedrooms in renter-occupied apartments in Tunbridge, Vermont
- 0no bedroom
- 201 bedroom
- 412 bedrooms
- 233 bedrooms
- 204 bedrooms
- 05+ bedrooms

- Cars and other vehicles available in Tunbridge in owner-occupied houses/condos
- 7no vehicle
- 1031 vehicle
- 1862 vehicles
- 793 vehicles
- 284 vehicles
- 75+ vehicles

- Cars and other vehicles available in Tunbridge in renter-occupied apartments
- 5no vehicle
- 471 vehicle
- 402 vehicles
- 103 vehicles
- 04 vehicles
- 25+ vehicles

- Rooms in owner-occupied houses in Tunbridge, Vermont
- 81 room
- 52 rooms
- 173 rooms
- 554 rooms
- 825 rooms
- 766 rooms
- 697 rooms
- 468 rooms
- 529+ rooms

- Rooms in renter-occupied apartments in Tunbridge, Vermont
- 01 room
- 22 rooms
- 173 rooms
- 264 rooms
- 145 rooms
- 266 rooms
- 127 rooms
- 28 rooms
- 59+ rooms


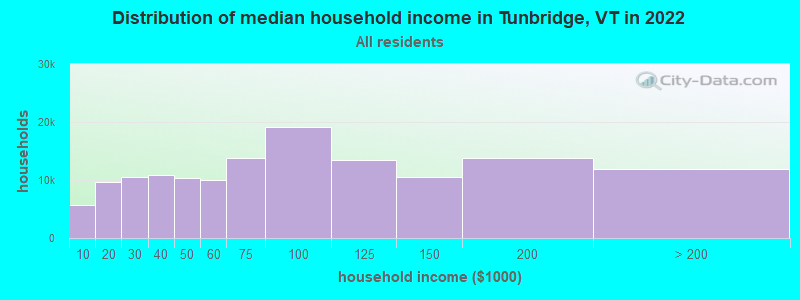
Tunbridge, VT household income distribution

- 5,034Less than $10,000
- 10,278$10,000 to $19,999
- 11,801$20,000 to $29,999
- 13,735$30,000 to $39,999
- 12,739$40,000 to $49,999
- 12,413$50,000 to $59,999
- 16,522$60,000 to $74,999
- 25,008$75,000 to $99,999
- 16,560$100,000 to $124,999
- 13,221$125,000 to $149,999
- 16,789$150,000 to $199,999
- 15,165$200,000 or more
Percentage of workers working in this county: 42.5%
Number of people working at home: 127 (17.3% of all workers)
Travel time to work (commute)
- Less than 5 minutes: 30
- 5 to 9 minutes: 53
- 10 to 14 minutes: 64
- 15 to 19 minutes: 103
- 20 to 24 minutes: 90
- 25 to 29 minutes: 26
- 30 to 34 minutes: 73
- 35 to 39 minutes: 23
- 40 to 44 minutes: 62
- 45 to 59 minutes: 84
- 60 to 89 minutes: 34
- 90 or more minutes: 6
Means of transportation to work:
- Drove a car alone: 521 (77.2%)
- Carpooled: 95 (14.1%)
- Bus or trolley bus: 2 (0.3%)
- Walked: 26 (3.9%)
- Other means: 4 (0.6%)
- Worked at home: 27 (4.0%)


- Year of entry for the foreign-born population in Tunbridge, Vermont
- 21995 to March 2000
- 01990 to 1994
- 01985 to 1989
- 01980 to 1984
- 31975 to 1979
- 21970 to 1974
- 01965 to 1969
- 11Before 1965

First ancestries reported:
- English: 442 (28.2%)
- Irish: 248 (15.8%)
- Other: 195 (12.4%)
- German: 163 (10.4%)
- French: 144 (9.2%)
- United States: 80 (5.1%)
- Italian: 50 (3.2%)
- French Canadian: 34 (2.2%)
- Scottish: 33 (2.1%)
- Polish: 32 (2.0%)
- Scotch-Irish: 29 (1.8%)
- Dutch: 26 (1.7%)
- Norwegian: 17 (1.1%)
- Russian: 17 (1.1%)
- Swedish: 15 (1.0%)
- Welsh: 11 (0.7%)
- Swiss: 10 (0.6%)
- Czech: 9 (0.6%)
- Lithuanian: 7 (0.4%)
- Hungarian: 5 (0.3%)
- Danish: 2 (0.1%)
Most common places of birth for foreign-born residents (%):
| Tunbridge: | 22.2% (4) |
| Vermont: | 7.2% (1,669) |
| Tunbridge: | 16.7% (3) |
| Vermont: | 1.1% (263) |
| Tunbridge: | 16.7% (3) |
| Vermont: | 34.0% (7,912) |
| Tunbridge: | 11.1% (2) |
| Vermont: | 7.5% (1,744) |
| Tunbridge: | 11.1% (2) |
| Vermont: | 1.0% (226) |
| Tunbridge: | 11.1% (2) |
| Vermont: | 1.2% (273) |
| Tunbridge: | 11.1% (2) |
| Vermont: | 1.6% (381) |
Place of birth for U.S.-born residents:
- This state: 704
- Other state: 601
- Northeast: 489
- Midwest: 36
- South: 46
- West: 30
72% of Tunbridge residents lived in the same house 5 years ago.
Out of people who lived in different houses, 46% lived in this county.
Out of people who lived in different counties, 50% lived in Vermont.
Education attainment for males 25 years and older:
- No schooling: 0
- Nursery to 4th grade: 0
- 5th and 6th grade: 4
- 7th and 8th grade: 31
- 9th grade: 6
- 10th grade: 15
- 11th grade: 9
- 12th grade, no diploma: 12
- High school graduate (or equivalency): 150
- Less than 1 year of college: 25
- Some college more than 1 year, no degree: 53
- Associate degree: 35
- Bachelor's degree: 55
- Master's degree: 30
- Professional school degree: 11
- Doctorate degree: 9

Education attainment for females 25 years and older:
- No schooling: 0
- Nursery to 4th grade: 0
- 5th and 6th grade: 0
- 7th and 8th grade: 20
- 9th grade: 13
- 10th grade: 12
- 11th grade: 12
- 12th grade, no diploma: 5
- High school graduate (or equivalency): 165
- Less than 1 year of college: 23
- Some college more than 1 year, no degree: 58
- Associate degree: 37
- Bachelor's degree: 88
- Master's degree: 35
- Professional school degree: 6
- Doctorate degree: 4


Housing units in structures:
- One, detached: 561
- One, attached: 17
- Two: 19
- 3 or 4: 2
- Mobile homes: 77
- Boats, RVs, vans, etc.: 2
Median worth of mobile homes: $85,871
Housing units lacking complete kitchen facilities: 8.0%

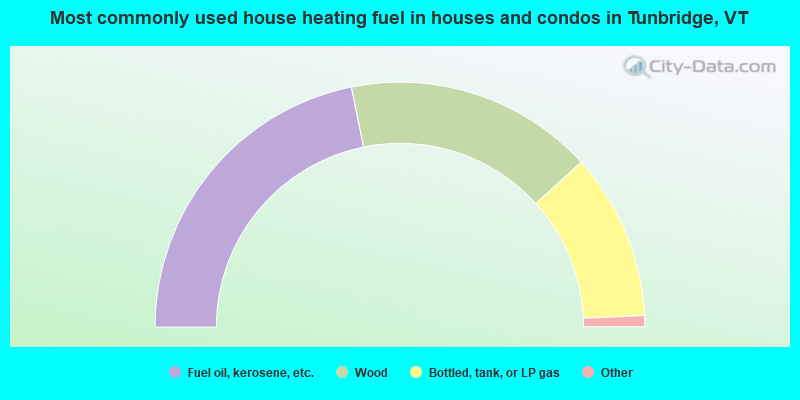
- 43.7%Fuel oil, kerosene, etc.
- 32.9%Wood
- 22.0%Bottled, tank, or LP gas
- 1.0%Coal or coke
- 0.5%Utility gas
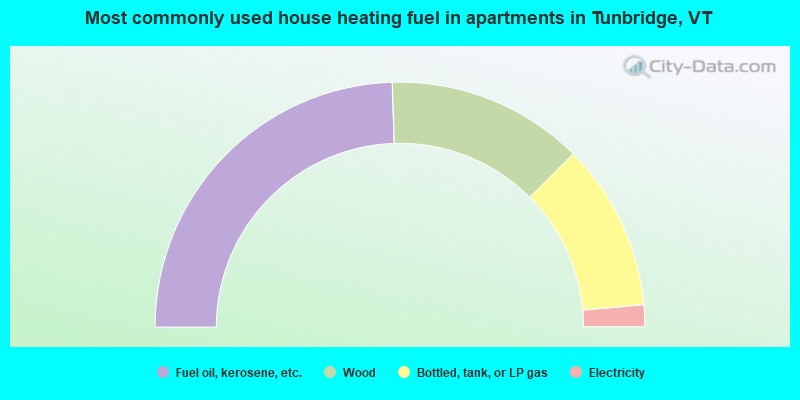
- 49.0%Fuel oil, kerosene, etc.
- 26.0%Wood
- 22.1%Bottled, tank, or LP gas
- 2.9%Electricity
Private vs. public school enrollment:
| Here: | 10.3% |
| Vermont: | 7.2% |
| Here: | 3.5% |
| Vermont: | 10.4% |
| Here: | 27.9% |
| Vermont: | 37.7% |


