Tuscola, IL (Illinois) Houses and Residents
| Tuscola: | $158,789 |
| Illinois: | $251,600 |
Total population: 4,461 (Urban population: 4,341 (all inside urban clusters), Rural population: 149 (4 farm, 145 nonfarm))
Houses: 2,223 (2,054 occupied: 1,533 owner occupied, 547 renter occupied)
| % of renters here: | 26% |
| State: | 33% |
Housing density: 1,042 houses/condos per square mile
Median price asked for vacant for-sale houses and condos in 2022: $860,128.
Median contract rent in 2022: $546 (lower quartile is $500, upper quartile is $921)
Median rent asked for vacant for-rent units in 2022: $6,201
Median gross rent in Tuscola, IL in 2022: $736
Housing units in Tuscola with a mortgage: 990 (143 second mortgage, 0 home equity loan, 138 both second mortgage and home equity loan)
Houses without a mortgage: 0
Median household income for houses/condos with a mortgage: $93,770
Median household income for apartments without a mortgage: $39,524
Median monthly housing costs: $951
Compare current foreclosures near Tuscola, IL:
| Photo | Address | Area | Beds / Baths | Price | Details |
|---|---|---|---|---|---|

|
#1
W Ensey St
Tuscola, IL 61953
|
1,764 sq. feet
|
1 baths 2 beds |
show details | |

|
#2
E Scott St
Tuscola, IL 61953
|
1,852 sq. feet
|
2 baths 3 beds |
show details | |

|
#3
E Ficklin St
Tuscola, IL 61953
|
- sq. feet
|
- baths - beds |
show details | |

|
#4
S Niles Ave
Tuscola, IL 61953
|
- sq. feet
|
- baths - beds |
show details | |

|
#5
E 5th St
Hammond, IL 61929
|
- sq. feet
|
1 baths 4 beds |
$14,900
|
show details |

|
#6
S Hickory St
Pesotum, IL 61863
|
1,155 sq. feet
|
1 baths 3 beds |
show details | |

|
#7
E Hancock St
Longview, IL 61852
|
2 sq. feet
|
1 baths 3 beds |
show details | |

|
#8
W Main St
Oakland, IL 61943
|
1,622 sq. feet
|
1 baths 3 beds |
show details | |

|
#9
E Main St
Arcola, IL 61910
|
3,252 sq. feet
|
3 baths 6 beds |
show details | |

|
#10
E Elm St
Villa Grove, IL 61956
|
1 sq. feet
|
1 baths 2 beds |
show details |
| Photo | Address | Area | Beds / Baths | Price | Details |
|---|---|---|---|---|---|

|
#11
Polk Dr
Arcola, IL 61910
|
896 sq. feet
|
1 baths 3 beds |
show details | |

|
#12
S Spruce St
Villa Grove, IL 61956
|
1,200 sq. feet
|
1 baths 4 beds |
show details | |

|
#13
S Walnut St
Pesotum, IL 61863
|
1,010 sq. feet
|
1 baths - beds |
show details | |

|
#14
N Pine St
Villa Grove, IL 61956
|
1,077 sq. feet
|
1 baths 2 beds |
show details | |

|
#15
Lincoln Ave
Arcola, IL 61910
|
754 sq. feet
|
1 baths - beds |
show details | |

|
#16
E Co Road N, 1400
Humboldt, IL 61931
|
- sq. feet
|
- baths - beds |
show details | |

|
#17
Tilton St
Ivesdale, IL 61851
|
- sq. feet
|
- baths - beds |
show details | |

|
#18
4th St
Ivesdale, IL 61851
|
- sq. feet
|
- baths - beds |
show details | |

|
#19
W Austin St
Tolono, IL 61880
|
- sq. feet
|
- baths - beds |
show details | |

|
#20
E Marshall St
Tolono, IL 61880
|
- sq. feet
|
- baths 3 beds |
show details |
| Photo | Address | Area | Beds / Baths | Price | Details |
|---|---|---|---|---|---|

|
#21
E Main St Apt C
Tolono, IL 61880
|
- sq. feet
|
- baths - beds |
show details | |

|
#22
W Monroe St
Philo, IL 61864
|
- sq. feet
|
- baths - beds |
show details | |

|
#23
Bryce Ln
Tolono, IL 61880
|
- sq. feet
|
- baths - beds |
show details | |

|
#24
E Larmon St
Tolono, IL 61880
|
- sq. feet
|
- baths - beds |
show details | |

|
#25
E Reynolds St
Tolono, IL 61880
|
- sq. feet
|
- baths - beds |
show details | |

|
#26
Prairie St
Arthur, IL 61911
|
- sq. feet
|
- baths - beds |
show details | |

|
#27
N Juniper Dr
Atwood, IL 61913
|
- sq. feet
|
- baths - beds |
show details | |

|
#28
W Forest Ave
Atwood, IL 61913
|
- sq. feet
|
- baths - beds |
show details | |

|
#29
N Chestnut St
Pesotum, IL 61863
|
- sq. feet
|
- baths - beds |
show details | |

|
#30
E County Road 1450 N
Newman, IL 61942
|
- sq. feet
|
- baths - beds |
show details |
| Photo | Address | Area | Beds / Baths | Price | Details |
|---|---|---|---|---|---|

|
Check over 1 million property listings on Foreclosure.com!
|
browse all offers | |||
| Photo | Address | Area | Beds / Baths | Price | Details |
|---|

Latest news about housing in Tuscola, IL collected exclusively by city-data.com from local newspapers, TV, and radio stations

 | How many years until Illinois is sprawled out? (16 replies) |
| Tuscola, IL Train Tracks (4 replies) |
| Tuscola, Illinois Info. (21 replies) |
| Moving from LA to Urbana-Champaign (46 replies) |
| Where is "the middle of nowhere"in Illinois? (72 replies) |
| Moving to Champaign - Urbana (8 replies) |

Median year apartment built: 1983
Household type by relationship:
Households: 4,642- Male householders: 1,100 (371 living alone), Female householders: 916 (315 living alone)
1,049 spouses (1,049 opposite-sex spouses), 68 unmarried partners, (68 opposite-sex unmarried partners), 1,253 children (1,097 natural, 29 adopted, 126 stepchildren), 14 grandchildren, 21 brothers or sisters, 17 parents, 0 foster children, 0 other relatives, 158 non-relatives
- In group quarters: 41
Size of family households: 617 2-persons, 238 3-persons, 316 4-persons, 111 5-persons, 7 6-persons, 10 7-or-more-persons.
Size of nonfamily households: 724 1-person, 53 2-persons.
662 married couples with children.
242 single-parent households (75 men, 167 women).
95.1% of residents of Tuscola speak English at home.
2.3% of residents speak Spanish at home (64% speak English very well, 36% speak English well).
1.1% of residents speak other Indo-European language at home (100% speak English very well).
0.9% of residents speak other language at home (100% speak English very well).
Foreign born population: 215 (4.6%)
(56.3% of them are naturalized citizens)
| Here: | 6.3 |
| State: | 6.4 |
| Here: | 3.7 |
| State: | 4.1 |

- Bedrooms in owner-occupied houses and condos in Tuscola, Illinois
- 0no bedroom
- 01 bedroom
- 2952 bedrooms
- 9263 bedrooms
- 2884 bedrooms
- 245+ bedrooms

- Bedrooms in renter-occupied apartments in Tuscola, Illinois
- 0no bedroom
- 881 bedroom
- 3132 bedrooms
- 1183 bedrooms
- 284 bedrooms
- 05+ bedrooms

- Cars and other vehicles available in Tuscola in owner-occupied houses/condos
- 48no vehicle
- 4131 vehicle
- 6132 vehicles
- 3033 vehicles
- 1574 vehicles
- 05+ vehicles

- Cars and other vehicles available in Tuscola in renter-occupied apartments
- 39no vehicle
- 2901 vehicle
- 1092 vehicles
- 753 vehicles
- 144 vehicles
- 205+ vehicles

- Rooms in owner-occupied houses in Tuscola, Illinois
- 01 room
- 02 rooms
- 183 rooms
- 1854 rooms
- 3815 rooms
- 2356 rooms
- 2507 rooms
- 1508 rooms
- 3149+ rooms

- Rooms in renter-occupied apartments in Tuscola, Illinois
- 01 room
- 432 rooms
- 1913 rooms
- 1144 rooms
- 1075 rooms
- 646 rooms
- 147 rooms
- 08 rooms
- 149+ rooms


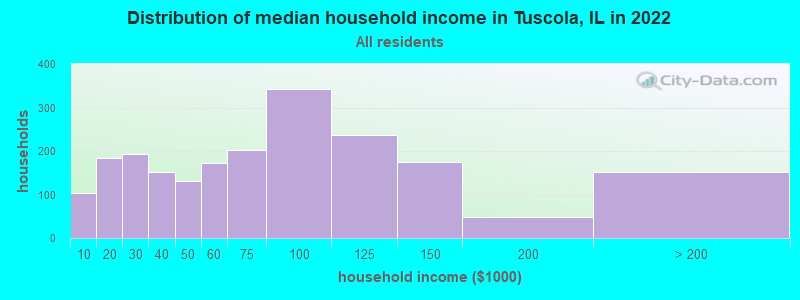
Tuscola, IL household income distribution

- 103Less than $10,000
- 184$10,000 to $19,999
- 193$20,000 to $29,999
- 152$30,000 to $39,999
- 132$40,000 to $49,999
- 172$50,000 to $59,999
- 202$60,000 to $74,999
- 343$75,000 to $99,999
- 236$100,000 to $124,999
- 174$125,000 to $149,999
- 48$150,000 to $199,999
- 152$200,000 or more
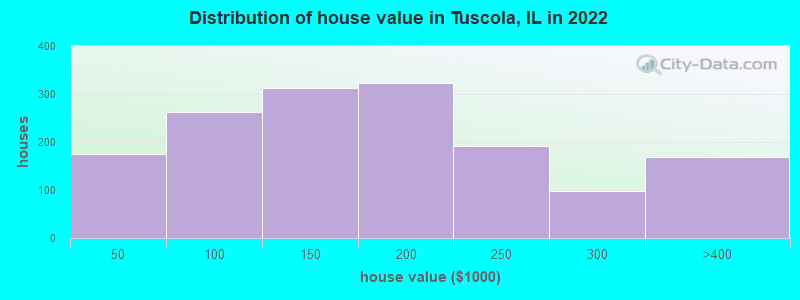
Home value of owner - occupied houses in 2022 in Tuscola, IL
-
- 105Less than $10,000
- 11$15,000 to $19,999
- 49$25,000 to $29,999
- 6$40,000 to $49,999
- 4$50,000 to $59,999
- 79$60,000 to $69,999
- 10$70,000 to $79,999
- 121$80,000 to $89,999
- 39$90,000 to $99,999
- 194$100,000 to $124,999
- 118$125,000 to $149,999
- 230$150,000 to $174,999
- 90$175,000 to $199,999
- 191$200,000 to $249,999
- 97$250,000 to $299,999
- 168$300,000 to $399,999
Rent paid by renters in 2022 in Tuscola, IL
-
- 8$100 to $149
- 15$300 to $349
- 13$350 to $399
- 24$400 to $449
- 51$450 to $499
- 178$500 to $549
- 25$550 to $599
- 22$650 to $699
- 17$700 to $749
- 42$800 to $899
- 88$900 to $999
- 61$1,000 to $1,249
- 9No cash rent


Percentage of workers working in this county: 60.0%
Number of people working at home: 127 (5.1% of all workers)
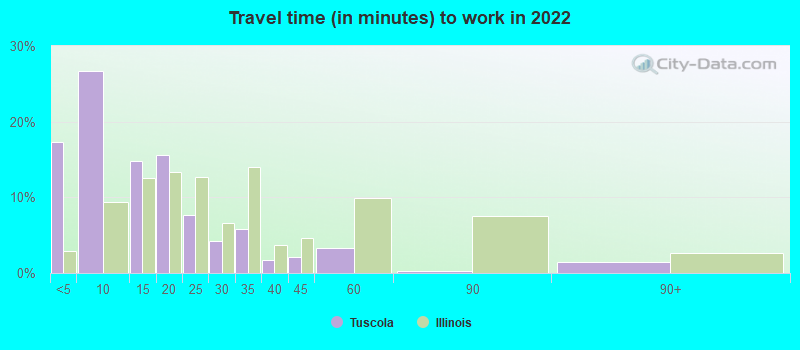
Travel time to work (commute)
- Less than 5 minutes: 257
- 5 to 9 minutes: 596
- 10 to 14 minutes: 290
- 15 to 19 minutes: 104
- 20 to 24 minutes: 104
- 25 to 29 minutes: 92
- 30 to 34 minutes: 539
- 35 to 39 minutes: 73
- 40 to 44 minutes: 66
- 45 to 59 minutes: 107
- 60 to 89 minutes: 67
- 90 or more minutes: 18
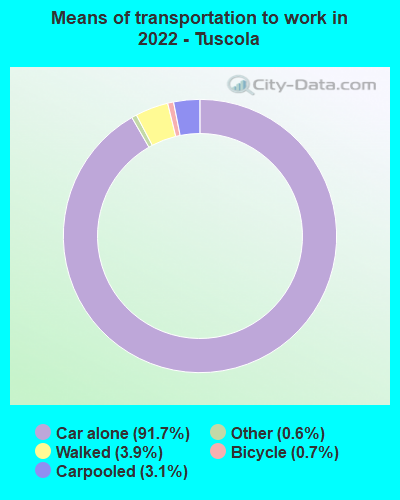
Means of transportation to work:
- Drove a car alone: 1,555 (83.7%)
- Carpooled: 55 (3.0%)
- Taxi: 11 (0.6%)
- Bicycle: 13 (0.7%)
- Walked: 67 (3.6%)
- Worked at home: 127 (6.8%)

- Unemployment by race in 2022
- Unemployment rate for White non-Hispanic residents
- 0.8%Males
- 2.9%Females

- Year of entry for the foreign-born population in Tuscola, Illinois
- 962010 or later
- 302000 to 2009
- 641990 to 1999
- 121980 to 1989
- 71970 to 1979
- 27Before 1970

First ancestries reported:
- German: 516 (20.5%)
- English: 512 (20.3%)
- American: 414 (16.4%)
- Irish: 357 (14.2%)
- European: 196 (7.8%)
- Italian: 63 (2.5%)
- Romanian: 24 (1.0%)
- French: 23 (0.9%)
- Scotch-Irish: 21 (0.8%)
- Welsh: 19 (0.8%)
- Dutch: 14 (0.6%)
- Swedish: 13 (0.5%)
- Scottish: 10 (0.4%)
- Dutch West Indian: 10 (0.4%)
- Ukrainian: 7 (0.3%)
- Canadian: 5 (0.2%)
- Pennsylvania German: 5 (0.2%)
Most common places of birth for foreign-born residents (%):
| Tuscola: | 44.7% (96) |
| Illinois: | 34.7% (626,958) |
| Tuscola: | 16.7% (36) |
| Illinois: | 0.1% (2,465) |
| Tuscola: | 14.0% (30) |
| Illinois: | 0.9% (15,679) |
| Tuscola: | 10.7% (23) |
| Illinois: | 1.6% (29,519) |
| Tuscola: | 7.0% (15) |
| Illinois: | 4.1% (74,364) |
| Tuscola: | 5.6% (12) |
| Illinois: | 9.2% (166,409) |
| Tuscola: | 3.7% (8) |
| Illinois: | 0.1% (1,780) |
Place of birth for U.S.-born residents:
- This state: 3,849
- Other state: 503
- Northeast: 27
- Midwest: 204
- South: 130
- West: 141
86.6% of Tuscola residents lived in the same house 1 years ago.
Out of people who lived in different houses, 29.8% lived in this county.
Out of people who lived in different counties, 93.1% lived in Illinois.
| Tuscola: | 86.6% |
| State average: | 88.3% |
Education attainment for males 25 years and older:
- No schooling: 25
- Nursery to 4th grade: 0
- 5th and 6th grade: 0
- 7th and 8th grade: 0
- 9th grade: 50
- 10th grade: 0
- 11th grade: 0
- 12th grade, no diploma: 0
- High school graduate (or equivalency): 512
- Less than 1 year of college: 169
- Some college more than 1 year, no degree: 252
- Associate degree: 243
- Bachelor's degree: 229
- Master's degree: 107
- Professional school degree: 33
- Doctorate degree: 13

Education attainment for females 25 years and older:
- No schooling: 0
- Nursery to 4th grade: 0
- 5th and 6th grade: 0
- 7th and 8th grade: 0
- 9th grade: 3
- 10th grade: 7
- 11th grade: 0
- 12th grade, no diploma: 32
- High school graduate (or equivalency): 392
- Less than 1 year of college: 83
- Some college more than 1 year, no degree: 255
- Associate degree: 302
- Bachelor's degree: 349
- Master's degree: 108
- Professional school degree: 17
- Doctorate degree: 0


Housing units in structures:
- One, detached: 1,695
- One, attached: 42
- Two: 33
- 3 or 4: 122
- 5 to 9: 96
- 10 to 19: 30
- 20 to 49: 19
- 50 or more: 51
- Mobile homes: 132
House/condo owner moved in on average 10 years ago
Renter moved in on average 5 years ago

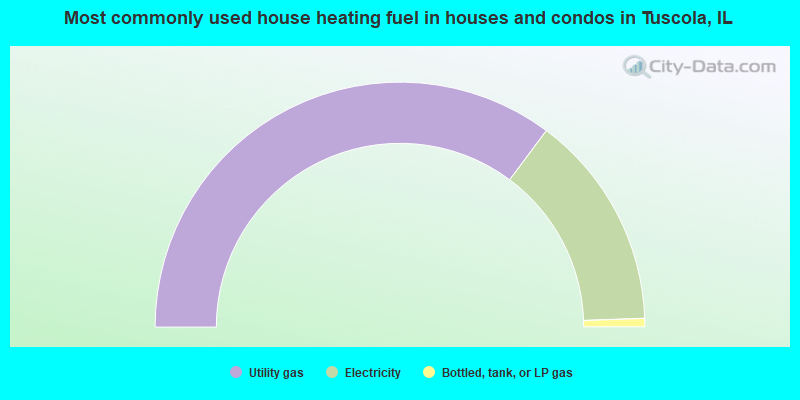
- 70.4%Utility gas
- 28.5%Electricity
- 1.1%Bottled, tank, or LP gas
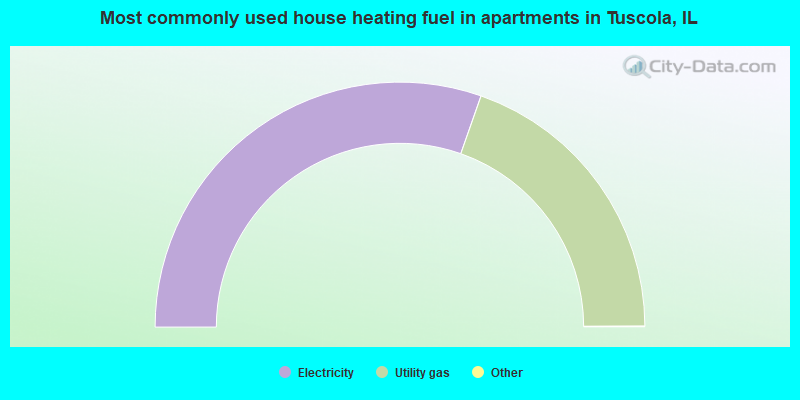
- 60.8%Electricity
- 39.2%Utility gas
Private vs. public school enrollment:
| Here: | 6.9% |
| Illinois: | 13.3% |
| Here: | 0.0% |
| Illinois: | 9.9% |
| Here: | 0.0% |
| Illinois: | 27.4% |


