Uhland, TX (Texas) Houses and Residents
| Uhland: | $208,286 |
| Texas: | $275,400 |
Mean price in 2022:
Detached houses: $282,359
Here: $282,359 State: $369,058 Mobile homes: $130,870
Here: $130,870 State: $124,413
Total population: 1,035 (Urban population: 0, Rural population: 442 (2 farm, 440 nonfarm))
Houses: 586 (551 occupied: 491 owner occupied, 68 renter occupied)
| % of renters here: | 12% |
| State: | 38% |
Housing density: 321 houses/condos per square mile
Median price asked for vacant for-sale houses and condos in 2022 in this county: $131,215.
Median contract rent in 2022: $1,079 (lower quartile is $739, upper quartile is $1,200)
Median gross rent in Uhland, TX in 2022: $1,278
Housing units in Uhland with a mortgage: 222 (0 second mortgage, 0 home equity loan, 0 both second mortgage and home equity loan)
Houses without a mortgage: 0
Median household income for houses/condos with a mortgage: $85,301
Median household income for apartments without a mortgage: $74,832
Median monthly housing costs: $1,074
Compare current foreclosures near Uhland, TX:
| Photo | Address | Area | Beds / Baths | Price | Details |
|---|---|---|---|---|---|

|
#1
Copperstone Ave
Austin, TX 78748
|
1,749 sq. feet
|
2 baths 4 beds |
show details | |

|
#2
Banff Drive
Kyle, TX 78640
|
1,322 sq. feet
|
2 baths 3 beds |
show details | |

|
#3
Suttles Ave
San Marcos, TX 78666
|
1,505 sq. feet
|
2 baths 3 beds |
show details | |

|
#4
Romayne Ln
Austin, TX 78748
|
1,372 sq. feet
|
2 baths 3 beds |
show details | |

|
#5
Stone Rim Loop
Buda, TX 78610
|
2,215 sq. feet
|
3 baths 4 beds |
show details | |

|
#6
Bridgestone Way
Buda, TX 78610
|
- sq. feet
|
2 baths 3 beds |
show details | |

|
#7
Little Ranches Rd
Wimberley, TX 78676
|
828 sq. feet
|
1 baths 2 beds |
show details | |

|
#8
Dovemeadow Dr
Austin, TX 78744
|
1,194 sq. feet
|
2 baths 3 beds |
show details | |

|
#9
Dove Flight Dr
Del Valle, TX 78617
|
1,452 sq. feet
|
2 baths 3 beds |
show details | |

|
#10
Frasier Dr
San Marcos, TX 78666
|
- sq. feet
|
2 baths 3 beds |
show details |
| Photo | Address | Area | Beds / Baths | Price | Details |
|---|---|---|---|---|---|

|
#11
Fairfield Dr
Kyle, TX 78640
|
2,318 sq. feet
|
3 baths 3 beds |
show details | |

|
#12
Cinkapin Dr
San Marcos, TX 78666
|
2,868 sq. feet
|
3 baths 3 beds |
show details | |

|
#13
Challenger
Kyle, TX 78640
|
1,002 sq. feet
|
1 baths 2 beds |
show details | |

|
#14
Marquitos Dr
Kyle, TX 78640
|
- sq. feet
|
2 baths 3 beds |
show details | |

|
#15
Spring Dr
Kyle, TX 78640
|
2,118 sq. feet
|
2 baths 3 beds |
show details | |

|
#16
Fm 2438
Kingsbury, TX 78638
|
1,056 sq. feet
|
2 baths 3 beds |
show details | |

|
#17
Magin Meadow Dr
Austin, TX 78744
|
1,482 sq. feet
|
2 baths - beds |
show details | |

|
#18
Rodriguez Rd # A
Austin, TX 78747
|
3,350 sq. feet
|
2 baths - beds |
show details | |

|
#19
Counselor Dr
Austin, TX 78749
|
1,581 sq. feet
|
2 baths - beds |
show details | |

|
#20
Turnstone Dr
Austin, TX 78744
|
776 sq. feet
|
1 baths - beds |
show details |
| Photo | Address | Area | Beds / Baths | Price | Details |
|---|---|---|---|---|---|

|
#21
Holly Springs Dr
Austin, TX 78748
|
768 sq. feet
|
2 baths - beds |
show details | |

|
#22
Avalon Ave
Austin, TX 78744
|
1,314 sq. feet
|
2 baths - beds |
show details | |

|
#23
W Dittmar Rd # A
Austin, TX 78745
|
1,643 sq. feet
|
2 baths - beds |
show details | |

|
#24
Arrow Dr
Austin, TX 78749
|
1,281 sq. feet
|
2 baths - beds |
show details | |

|
#25
Beaver Brook Ln
Austin, TX 78748
|
2,114 sq. feet
|
2 baths - beds |
show details | |

|
#26
Lendall Ln
Austin, TX 78744
|
1,237 sq. feet
|
2 baths - beds |
show details | |

|
#27
Eskew Dr
Austin, TX 78749
|
1,478 sq. feet
|
2 baths - beds |
show details | |

|
#28
Crepe Myrtle Dr
Austin, TX 78744
|
1,324 sq. feet
|
2 baths - beds |
show details | |

|
#29
Bannock Ln
Austin, TX 78747
|
2,912 sq. feet
|
2 baths - beds |
show details | |

|
#30
Coats Cir
Austin, TX 78748
|
1,427 sq. feet
|
2 baths - beds |
show details |
| Photo | Address | Area | Beds / Baths | Price | Details |
|---|---|---|---|---|---|

|
#31
Bliss Spillar Rd
Manchaca, TX 78652
|
1,570 sq. feet
|
2 baths - beds |
show details | |

|
#32
Canon Yeomans Trl
Austin, TX 78748
|
1,271 sq. feet
|
2 baths - beds |
show details | |

|
#33
Melissa Oaks Ln
Austin, TX 78744
|
2,281 sq. feet
|
2 baths - beds |
show details | |

|
#34
Brodie Ln Unit 4103
Austin, TX 78748
|
1,550 sq. feet
|
2 baths - beds |
show details | |

|
#35
Latteridge Dr
Austin, TX 78748
|
1,436 sq. feet
|
2 baths - beds |
show details | |

|
#36
Pebble Garden Ln
Austin, TX 78739
|
4,544 sq. feet
|
3 baths - beds |
show details | |

|
#37
Fence Row
Austin, TX 78744
|
1,203 sq. feet
|
2 baths - beds |
show details | |

|
#38
Brian Ln
Kyle, TX 78640
|
2,662 sq. feet
|
2 baths - beds |
show details | |

|
#39
Campina Xing
Del Valle, TX 78617
|
2,322 sq. feet
|
3 baths - beds |
show details | |

|
#40
Whispering Winds Dr
Austin, TX 78745
|
1,235 sq. feet
|
2 baths - beds |
show details |
| Photo | Address | Area | Beds / Baths | Price | Details |
|---|---|---|---|---|---|

|
#41
Lyra Cir
Austin, TX 78744
|
1,518 sq. feet
|
2 baths - beds |
show details | |

|
#42
Twisted Oaks Lane
Buda, TX 78610
|
1,688 sq. feet
|
- baths - beds |
show details | |

|
#43
Brandi Cir
Kyle, TX 78640
|
1,051 sq. feet
|
2 baths - beds |
show details | |

|
#44
Birch Creek Rd
Austin, TX 78744
|
1,320 sq. feet
|
2 baths - beds |
show details | |

|
#45
Allyson Ct
Austin, TX 78744
|
1,466 sq. feet
|
2 baths - beds |
show details | |

|
#46
Grennock Dr
Austin, TX 78745
|
1,571 sq. feet
|
2 baths - beds |
show details | |

|
#47
Philo St
San Marcos, TX 78666
|
1,938 sq. feet
|
- baths - beds |
show details | |

|
#48
Boyd Haven Dr
Austin, TX 78744
|
- sq. feet
|
- baths - beds |
show details | |

|
#49
Mitra Dr
Austin, TX 78739
|
- sq. feet
|
- baths - beds |
show details | |

|
Check over 1 million property listings on Foreclosure.com!
|
browse all offers | |||

Latest news about housing in Uhland, TX collected exclusively by city-data.com from local newspapers, TV, and radio stations


Median year apartment built: 2004
Household type by relationship:
Households: 1,988- Male householders: 312 (16 living alone), Female householders: 232 (24 living alone)
386 spouses (386 opposite-sex spouses), 62 unmarried partners, (62 opposite-sex unmarried partners), 752 children (591 natural, 45 adopted, 116 stepchildren), 90 grandchildren, 24 brothers or sisters, 14 parents, 0 foster children, 44 other relatives, 68 non-relatives
Size of family households: 190 2-persons, 41 3-persons, 104 4-persons, 73 5-persons, 16 6-persons, 39 7-or-more-persons.
Size of nonfamily households: 43 1-person, 48 2-persons.
293 married couples with children.
88 single-parent households (75 men, 13 women).
50.6% of residents of Uhland speak English at home.
47.9% of residents speak Spanish at home (68% speak English very well, 14% speak English well, 15% speak English not well, 3% don't speak English at all).
0.4% of residents speak other Indo-European language at home (43% speak English very well, 57% speak English well).
Foreign born population: 347 (17.5%)
(10.4% of them are naturalized citizens)
| Here: | 5.7 |
| State: | 6.3 |
| Here: | 4.4 |
| State: | 4.0 |

- Bedrooms in owner-occupied houses and condos in Uhland, Texas
- 4no bedroom
- 31 bedroom
- 562 bedrooms
- 2843 bedrooms
- 1264 bedrooms
- 185+ bedrooms

- Bedrooms in renter-occupied apartments in Uhland, Texas
- 0no bedroom
- 41 bedroom
- 232 bedrooms
- 373 bedrooms
- 44 bedrooms
- 05+ bedrooms

- Cars and other vehicles available in Uhland in owner-occupied houses/condos
- 0no vehicle
- 261 vehicle
- 2252 vehicles
- 1463 vehicles
- 914 vehicles
- 35+ vehicles

- Cars and other vehicles available in Uhland in renter-occupied apartments
- 0no vehicle
- 141 vehicle
- 342 vehicles
- 193 vehicles
- 24 vehicles
- 05+ vehicles

- Rooms in owner-occupied houses in Uhland, Texas
- 01 room
- 02 rooms
- 83 rooms
- 734 rooms
- 1055 rooms
- 2456 rooms
- 337 rooms
- 78 rooms
- 209+ rooms

- Rooms in renter-occupied apartments in Uhland, Texas
- 01 room
- 02 rooms
- 133 rooms
- 214 rooms
- 275 rooms
- 36 rooms
- 07 rooms
- 08 rooms
- 49+ rooms


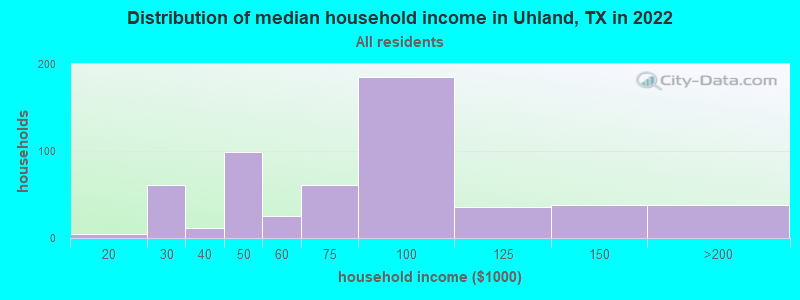
Uhland, TX household income distribution

- 5$10,000 to $19,999
- 61$20,000 to $29,999
- 11$30,000 to $39,999
- 99$40,000 to $49,999
- 25$50,000 to $59,999
- 61$60,000 to $74,999
- 185$75,000 to $99,999
- 36$100,000 to $124,999
- 38$125,000 to $149,999
- 38$150,000 to $199,999
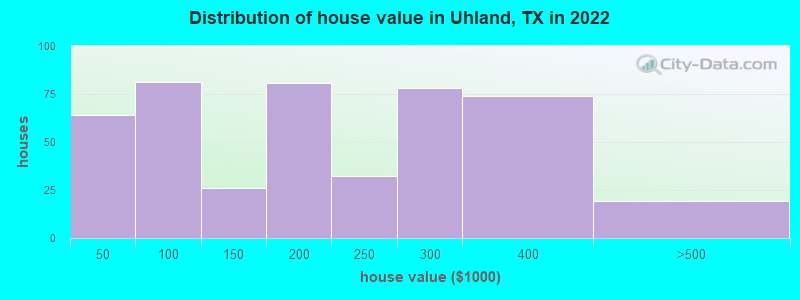
Home value of owner - occupied houses in 2022 in Uhland, TX
-
- 34$10,000 to $14,999
- 29$25,000 to $29,999
- 2$50,000 to $59,999
- 8$70,000 to $79,999
- 52$80,000 to $89,999
- 17$90,000 to $99,999
- 13$100,000 to $124,999
- 12$125,000 to $149,999
- 26$150,000 to $174,999
- 54$175,000 to $199,999
- 32$200,000 to $249,999
- 78$250,000 to $299,999
- 74$300,000 to $399,999
- 19$400,000 to $499,999
Rent paid by renters in 2022 in Uhland, TX
-
- 3$350 to $399
- 5$550 to $599
- 7$700 to $749
- 6$800 to $899
- 37$1,000 to $1,249
- 2$1,250 to $1,499


Percentage of workers working in this county: 40.5%
Number of people working at home: 13 (1.2% of all workers)
Travel time to work (commute)
- Less than 5 minutes: 8
- 5 to 9 minutes: 12
- 10 to 14 minutes: 84
- 15 to 19 minutes: 106
- 20 to 24 minutes: 188
- 25 to 29 minutes: 41
- 30 to 34 minutes: 119
- 35 to 39 minutes: 46
- 40 to 44 minutes: 19
- 45 to 59 minutes: 113
- 60 to 89 minutes: 210
- 90 or more minutes: 36
Means of transportation to work:
- Drove a car alone: 133 (69.6%)
- Carpooled: 36 (18.8%)
- Walked: 1 (0.5%)
- Worked at home: 21 (11.0%)

- Unemployment by race in 2022
- Unemployment rate for other race residents
- 1.7%Males
- Unemployment rate for two or more race residents
- 13.1%Females
- Unemployment rate for Hispanic or Latino residents
- 0.9%Males
- 8.0%Females

- Year of entry for the foreign-born population in Uhland, Texas
- 872010 or later
- 1152000 to 2009
- 931990 to 1999
- 251980 to 1989
- 51970 to 1979
- 6Before 1970
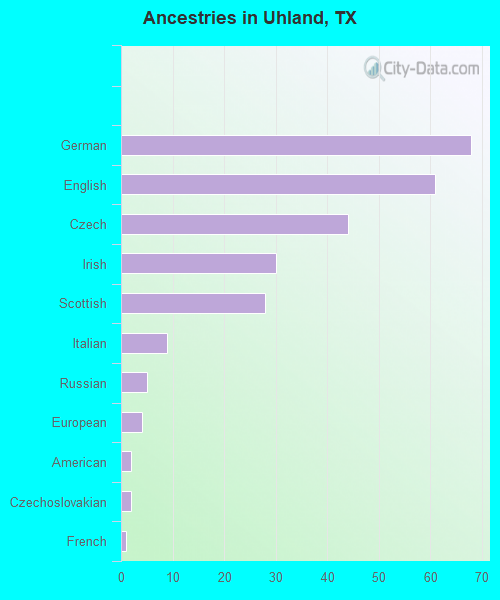
First ancestries reported:
- German: 68 (6.1%)
- English: 61 (5.5%)
- Czech: 44 (4.0%)
- Irish: 30 (2.7%)
- Scottish: 28 (2.5%)
- Italian: 9 (0.8%)
- Russian: 5 (0.5%)
- European: 4 (0.4%)
- American: 2 (0.2%)
- Czechoslovakian: 2 (0.2%)
- French: 1 (0.09%)
Most common places of birth for foreign-born residents (%):
| Uhland: | 88.5% (307) |
| Texas: | 48.4% (2,411,723) |
| Uhland: | 3.5% (12) |
| Texas: | 3.0% (147,182) |
| Uhland: | 2.9% (10) |
| Texas: | 4.5% (224,455) |
Place of birth for U.S.-born residents:
- This state: 1,309
- Other state: 312
- Northeast: 51
- Midwest: 162
- South: 65
- West: 30
95.7% of Uhland residents lived in the same house 1 years ago.
Out of people who lived in different houses, 47.0% lived in this county.
Out of people who lived in different counties, 0.0% lived in Texas.
| Uhland: | 95.7% |
| State average: | 85.7% |
Education attainment for males 25 years and older:
- No schooling: 61
- Nursery to 4th grade: 7
- 5th and 6th grade: 15
- 7th and 8th grade: 22
- 9th grade: 69
- 10th grade: 6
- 11th grade: 19
- 12th grade, no diploma: 0
- High school graduate (or equivalency): 266
- Less than 1 year of college: 26
- Some college more than 1 year, no degree: 71
- Associate degree: 21
- Bachelor's degree: 25
- Master's degree: 39
- Professional school degree: 0
- Doctorate degree: 0

Education attainment for females 25 years and older:
- No schooling: 36
- Nursery to 4th grade: 0
- 5th and 6th grade: 0
- 7th and 8th grade: 12
- 9th grade: 13
- 10th grade: 6
- 11th grade: 15
- 12th grade, no diploma: 18
- High school graduate (or equivalency): 121
- Less than 1 year of college: 10
- Some college more than 1 year, no degree: 37
- Associate degree: 64
- Bachelor's degree: 154
- Master's degree: 28
- Professional school degree: 0
- Doctorate degree: 0


Housing units in structures:
- One, detached: 278
- One, attached: 8
- 10 to 19: 3
- Mobile homes: 296
Median worth of mobile homes: $132,922
Housing units lacking complete kitchen facilities in 2022: 2.0%
House/condo owner moved in on average 10 years ago
Renter moved in on average 8 years ago

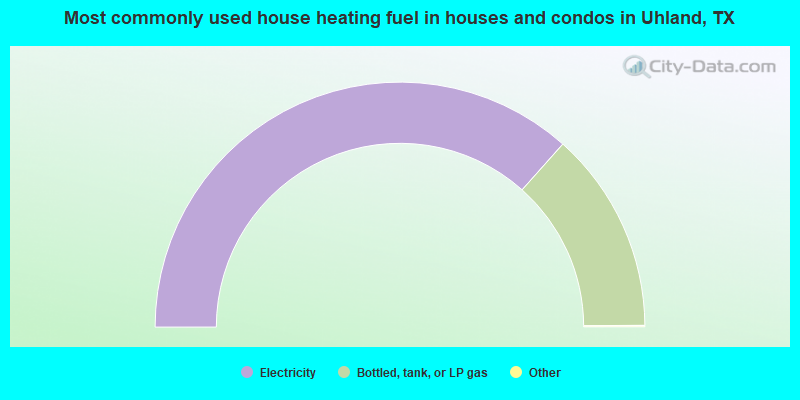
- 73.3%Electricity
- 26.7%Bottled, tank, or LP gas
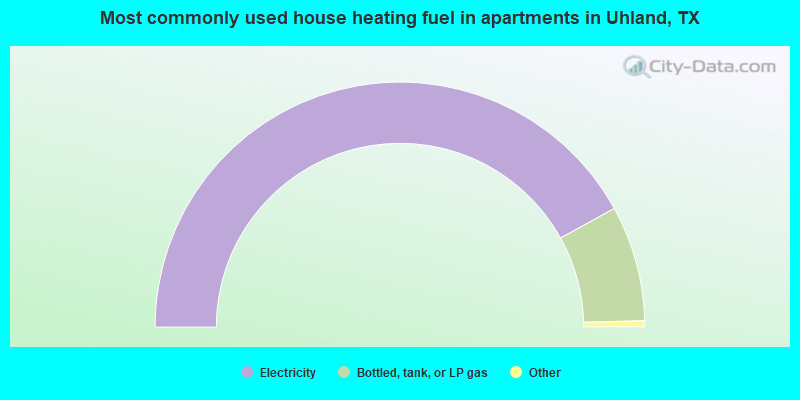
- 84.6%Electricity
- 15.4%Bottled, tank, or LP gas
Private vs. public school enrollment:
| Here: | 0.0% |
| Texas: | 8.8% |
| Here: | 0.0% |
| Texas: | 8.0% |
| Here: | 16.9% |
| Texas: | 16.2% |


