Union City, IN (Indiana) Houses and Residents
| Union City: | $93,324 |
| Indiana: | $208,700 |
Mean price in 2022:
Detached houses: $96,723
Here: $96,723 State: $257,916 Mobile homes: $8,976
Here: $8,976 State: $67,116
Total population: 3,478 (All urban)
Houses: 1,870 (1,607 occupied: 1,026 owner occupied, 600 renter occupied)
| % of renters here: | 37% |
| State: | 29% |
Housing density: 1,030 houses/condos per square mile
Median price asked for vacant for-sale houses and condos in 2022: $496,701.
Median contract rent in 2022: $357 (lower quartile is $233, upper quartile is $650)
Median rent asked for vacant for-rent units in 2022: $1,560
Median gross rent in Union City, IN in 2022: $543
Housing units in Union City with a mortgage: 480 (7 second mortgage, 0 home equity loan, 7 both second mortgage and home equity loan)
Houses without a mortgage: 0
Median household income for houses/condos with a mortgage: $64,863
Median household income for apartments without a mortgage: $42,558
Median monthly housing costs: $647
Compare current foreclosures near Union City, IN:
| Photo | Address | Area | Beds / Baths | Price | Details |
|---|---|---|---|---|---|

|
#1
Chatham St
Union City, IN 47390
|
1,320 sq. feet
|
1 baths 2 beds |
show details | |

|
#2
N Jackson Pike
Union City, IN 47390
|
1,994 sq. feet
|
2 baths 3 beds |
show details | |

|
#3
W Pearl St
Union City, IN 47390
|
1,280 sq. feet
|
1 baths 2 beds |
show details | |

|
#4
N State Road 227
Union City, IN 47390
|
1,870 sq. feet
|
1 baths 4 beds |
show details | |

|
#5
E 400 N
Union City, IN 47390
|
1,512 sq. feet
|
1 baths 3 beds |
show details | |

|
#6
W Division St
Union City, IN 47390
|
1,316 sq. feet
|
1 baths 2 beds |
show details | |

|
#7
N Plum St
Union City, IN 47390
|
1,648 sq. feet
|
2 baths 3 beds |
show details | |

|
#8
N Howard St
Union City, IN 47390
|
1,771 sq. feet
|
1 baths 2 beds |
show details | |

|
#9
E 100 S
Union City, IN 47390
|
2,071 sq. feet
|
1 baths 2 beds |
show details | |

|
#10
Royale Dr
Union City, IN 47390
|
1,089 sq. feet
|
1 baths 3 beds |
show details |
| Photo | Address | Area | Beds / Baths | Price | Details |
|---|---|---|---|---|---|

|
#11
N Walnut St
Union City, IN 47390
|
1,408 sq. feet
|
1 baths 3 beds |
show details | |

|
#12
N State Line Rd
Union City, IN 47390
|
- sq. feet
|
- baths - beds |
show details | |

|
#13
N Columbia St
Union City, IN 47390
|
- sq. feet
|
- baths - beds |
show details | |

|
#14
N George St
Ridgeville, IN 47380
|
2,100 sq. feet
|
2 baths 4 beds |
$176,900
|
show details |

|
#15
E North St
Winchester, IN 47394
|
1,672 sq. feet
|
1 baths 3 beds |
show details | |

|
#16
New York St
Farmland, IN 47340
|
- sq. feet
|
1 baths 3 beds |
show details | |

|
#17
Camden St
Ridgeville, IN 47380
|
1,401 sq. feet
|
1 baths 3 beds |
show details | |

|
#18
W North St
Winchester, IN 47394
|
2,032 sq. feet
|
2 baths 4 beds |
show details | |

|
#19
S Main St
Farmland, IN 47340
|
2,152 sq. feet
|
1 baths 4 beds |
show details | |

|
#20
W 800 N
Ridgeville, IN 47380
|
2,376 sq. feet
|
2 baths 4 beds |
show details |
| Photo | Address | Area | Beds / Baths | Price | Details |
|---|---|---|---|---|---|

|
#21
Martin St
Greenville, OH 45331
|
1,985 sq. feet
|
1 baths 3 beds |
show details | |

|
#22
N Main St
Lynn, IN 47355
|
1,640 sq. feet
|
1 baths 3 beds |
show details | |

|
#23
Orchard Dr
Greenville, OH 45331
|
2,071 sq. feet
|
2 baths 3 beds |
show details | |

|
#24
Markwith Ave
Greenville, OH 45331
|
1,642 sq. feet
|
2 baths 4 beds |
show details | |

|
#25
N Oak St
Lynn, IN 47355
|
1,632 sq. feet
|
1 baths 2 beds |
show details | |

|
#26
W Church St
Lynn, IN 47355
|
983 sq. feet
|
1 baths 2 beds |
show details | |

|
#27
S 300 W
Winchester, IN 47394
|
2,690 sq. feet
|
2 baths 3 beds |
show details | |

|
#28
Pierce St
Ridgeville, IN 47380
|
966 sq. feet
|
1 baths 2 beds |
show details | |

|
#29
Pierce St
Ridgeville, IN 47380
|
1,344 sq. feet
|
1 baths 2 beds |
show details | |

|
#30
W Church St
Lynn, IN 47355
|
1,594 sq. feet
|
1 baths 3 beds |
show details |
| Photo | Address | Area | Beds / Baths | Price | Details |
|---|---|---|---|---|---|

|
#31
N Main St
Farmland, IN 47340
|
1,084 sq. feet
|
1 baths 2 beds |
show details | |

|
#32
E 1050 S
Lynn, IN 47355
|
1,114 sq. feet
|
1 baths 3 beds |
show details | |

|
#33
Hollansburg Richmond Rd
Hollansburg, OH 45332
|
1,884 sq. feet
|
1 baths 3 beds |
show details | |

|
#34
State Route 121
Greenville, OH 45331
|
2,436 sq. feet
|
1 baths 3 beds |
show details | |

|
#35
Mohawk Dr
Greenville, OH 45331
|
1,242 sq. feet
|
1 baths 3 beds |
show details | |

|
#36
Sharp Ln
Greenville, OH 45331
|
960 sq. feet
|
1 baths 3 beds |
show details | |

|
#37
W 600 S
Lynn, IN 47355
|
960 sq. feet
|
1 baths 2 beds |
show details | |

|
#38
W State Road 28
Ridgeville, IN 47380
|
1,728 sq. feet
|
1 baths 3 beds |
show details | |

|
#39
W Maxville Rd
Farmland, IN 47340
|
1,216 sq. feet
|
1 baths 2 beds |
show details | |

|
#40
Harrison Rd
New Madison, OH 45346
|
2,699 sq. feet
|
3 baths 4 beds |
show details |
| Photo | Address | Area | Beds / Baths | Price | Details |
|---|---|---|---|---|---|

|
#41
S Middle Dr
Greenville, OH 45331
|
872 sq. feet
|
1 baths 2 beds |
show details | |

|
#42
Greenville Saint Marys Rd
Greenville, OH 45331
|
1,296 sq. feet
|
1 baths 1 beds |
show details | |

|
#43
Donald Dr
Greenville, OH 45331
|
2,162 sq. feet
|
2 baths 4 beds |
show details | |

|
#44
N State Route 49
Greenville, OH 45331
|
1,422 sq. feet
|
1 baths 3 beds |
show details | |

|
#45
Beatrice Dr
Union City, OH 45390
|
1,730 sq. feet
|
2 baths 3 beds |
show details | |

|
#46
State Route 571
Union City, OH 45390
|
1,697 sq. feet
|
1 baths 3 beds |
show details | |

|
#47
Springhill Rd
Union City, OH 45390
|
1,480 sq. feet
|
1 baths 3 beds |
show details | |

|
#48
Hunter Rd
Greenville, OH 45331
|
1,368 sq. feet
|
2 baths 3 beds |
show details | |

|
#49
Ream Rd
Fort Recovery, OH 45846
|
1,065 sq. feet
|
1 baths 3 beds |
show details | |

|
Check over 1 million property listings on Foreclosure.com!
|
browse all offers | |||


Median year apartment built: 1968
Household type by relationship:
Households: 3,536- Male householders: 765 (396 living alone), Female householders: 828 (292 living alone)
505 spouses (505 opposite-sex spouses), 146 unmarried partners, (146 opposite-sex unmarried partners), 1,098 children (975 natural, 70 adopted, 52 stepchildren), 117 grandchildren, 0 brothers or sisters, 2 parents, 0 foster children, 6 other relatives, 50 non-relatives
- In group quarters: 15
Size of family households: 342 2-persons, 149 3-persons, 140 4-persons, 118 5-persons, 50 6-persons.
Size of nonfamily households: 706 1-person, 108 2-persons, 11 3-persons.
434 married couples with children.
434 single-parent households (54 men, 380 women).
91.0% of residents of Union City speak English at home.
8.4% of residents speak Spanish at home (35% speak English very well, 45% speak English well, 20% speak English not well).
Foreign born population: 190 (5.4%)
(54.2% of them are naturalized citizens)
| Here: | 7.0 |
| State: | 6.6 |
| Here: | 4.2 |
| State: | 4.3 |

- Bedrooms in owner-occupied houses and condos in Union City, Indiana
- 0no bedroom
- 01 bedroom
- 2472 bedrooms
- 3883 bedrooms
- 2934 bedrooms
- 995+ bedrooms

- Bedrooms in renter-occupied apartments in Union City, Indiana
- 32no bedroom
- 1171 bedroom
- 2452 bedrooms
- 1773 bedrooms
- 304 bedrooms
- 05+ bedrooms

- Cars and other vehicles available in Union City in owner-occupied houses/condos
- 24no vehicle
- 2781 vehicle
- 4372 vehicles
- 2493 vehicles
- 394 vehicles
- 05+ vehicles

- Cars and other vehicles available in Union City in renter-occupied apartments
- 154no vehicle
- 2331 vehicle
- 1452 vehicles
- 573 vehicles
- 114 vehicles
- 05+ vehicles

- Rooms in owner-occupied houses in Union City, Indiana
- 01 room
- 02 rooms
- 433 rooms
- 244 rooms
- 925 rooms
- 2536 rooms
- 1857 rooms
- 2238 rooms
- 2079+ rooms

- Rooms in renter-occupied apartments in Union City, Indiana
- 321 room
- 112 rooms
- 1363 rooms
- 1544 rooms
- 665 rooms
- 1126 rooms
- 317 rooms
- 598 rooms
- 09+ rooms


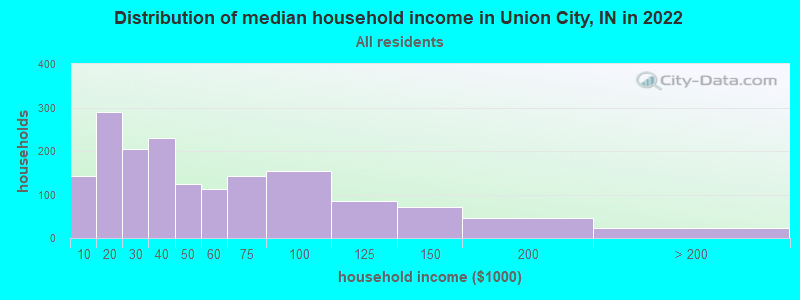
Union City, IN household income distribution

- 142Less than $10,000
- 290$10,000 to $19,999
- 205$20,000 to $29,999
- 231$30,000 to $39,999
- 123$40,000 to $49,999
- 112$50,000 to $59,999
- 142$60,000 to $74,999
- 153$75,000 to $99,999
- 84$100,000 to $124,999
- 72$125,000 to $149,999
- 46$150,000 to $199,999
- 22$200,000 or more
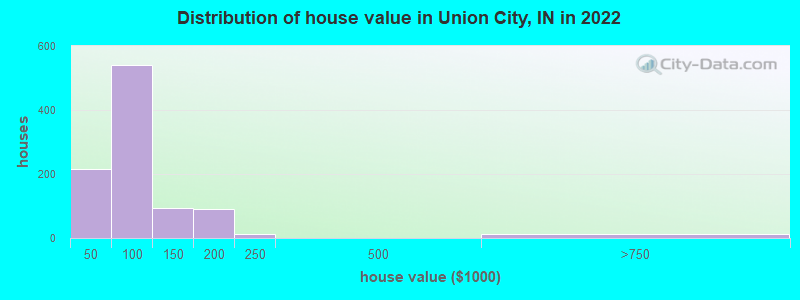
Home value of owner - occupied houses in 2022 in Union City, IN
-
- 64Less than $10,000
- 12$10,000 to $14,999
- 17$15,000 to $19,999
- 8$20,000 to $24,999
- 10$35,000 to $39,999
- 101$40,000 to $49,999
- 75$50,000 to $59,999
- 78$60,000 to $69,999
- 61$70,000 to $79,999
- 115$80,000 to $89,999
- 109$90,000 to $99,999
- 47$100,000 to $124,999
- 45$125,000 to $149,999
- 42$150,000 to $174,999
- 47$175,000 to $199,999
- 11$200,000 to $249,999
- 13$500,000 to $749,999
Rent paid by renters in 2022 in Union City, IN
-
- 41$100 to $149
- 59$150 to $199
- 46$200 to $249
- 75$250 to $299
- 5$300 to $349
- 47$350 to $399
- 28$400 to $449
- 19$500 to $549
- 10$550 to $599
- 52$600 to $649
- 70$650 to $699
- 30$2,000 to $2,499
- 74No cash rent


Percentage of workers working in this county: 49.4%
Number of people working at home: 73 (5.6% of all workers)
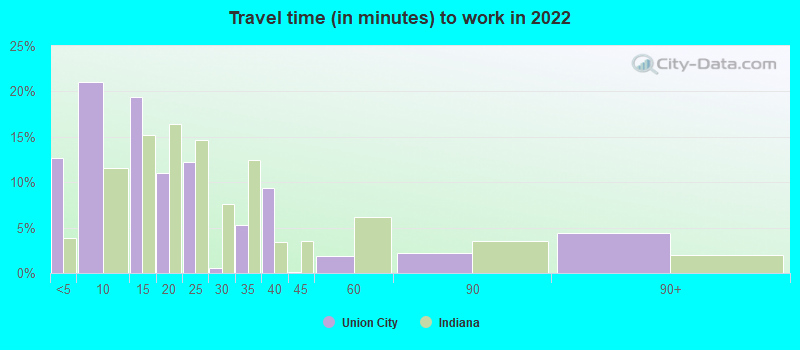
Travel time to work (commute)
- Less than 5 minutes: 170
- 5 to 9 minutes: 224
- 10 to 14 minutes: 82
- 15 to 19 minutes: 16
- 20 to 24 minutes: 181
- 25 to 29 minutes: 93
- 30 to 34 minutes: 97
- 35 to 39 minutes: 119
- 40 to 44 minutes: 44
- 45 to 59 minutes: 51
- 60 to 89 minutes: 122
- 90 or more minutes: 10
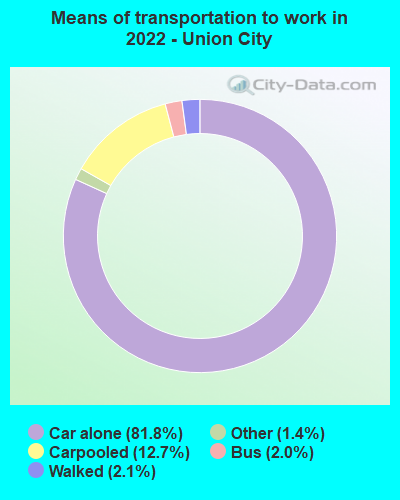
Means of transportation to work:
- Drove a car alone: 1,121 (75.6%)
- Carpooled: 191 (12.9%)
- Bus: 26 (1.8%)
- Taxi: 22 (1.5%)
- Walked: 29 (2.0%)
- Worked at home: 73 (4.9%)

- Unemployment by race in 2022
- Unemployment rate for White non-Hispanic residents
- 7.4%Males
- 12.9%Females

- Year of entry for the foreign-born population in Union City, Indiana
- 612010 or later
- 1152000 to 2009
- 01990 to 1999
- 271980 to 1989
- 61970 to 1979
- 0Before 1970

First ancestries reported:
- Irish: 266 (19.0%)
- American: 263 (18.8%)
- German: 99 (7.1%)
- English: 89 (6.4%)
- French: 21 (1.5%)
- British: 18 (1.3%)
- European: 13 (0.9%)
- Welsh: 10 (0.7%)
Most common places of birth for foreign-born residents (%):
| Union City: | 93.7% (178) |
| Indiana: | 27.0% (101,996) |
Place of birth for U.S.-born residents:
- This state: 2,124
- Other state: 1,220
- Northeast: 68
- Midwest: 949
- South: 145
- West: 62
89.9% of Union City residents lived in the same house 1 years ago.
Out of people who lived in different houses, 40.0% lived in this county.
Out of people who lived in different counties, 0.0% lived in Indiana.
| Union City: | 89.9% |
| State average: | 87.1% |
Education attainment for males 25 years and older:
- No schooling: 38
- Nursery to 4th grade: 0
- 5th and 6th grade: 13
- 7th and 8th grade: 28
- 9th grade: 27
- 10th grade: 76
- 11th grade: 0
- 12th grade, no diploma: 23
- High school graduate (or equivalency): 449
- Less than 1 year of college: 129
- Some college more than 1 year, no degree: 135
- Associate degree: 103
- Bachelor's degree: 50
- Master's degree: 0
- Professional school degree: 65
- Doctorate degree: 0

Education attainment for females 25 years and older:
- No schooling: 9
- Nursery to 4th grade: 0
- 5th and 6th grade: 0
- 7th and 8th grade: 0
- 9th grade: 60
- 10th grade: 0
- 11th grade: 25
- 12th grade, no diploma: 0
- High school graduate (or equivalency): 419
- Less than 1 year of college: 144
- Some college more than 1 year, no degree: 164
- Associate degree: 42
- Bachelor's degree: 99
- Master's degree: 111
- Professional school degree: 0
- Doctorate degree: 0


Housing units in structures:
- One, detached: 1,167
- One, attached: 22
- Two: 112
- 3 or 4: 118
- 5 to 9: 135
- 10 to 19: 20
- 20 to 49: 128
- 50 or more: 11
- Mobile homes: 153
Housing units lacking complete kitchen facilities in 2022: 9.9%
House/condo owner moved in on average 9 years ago
Renter moved in on average 3 years ago

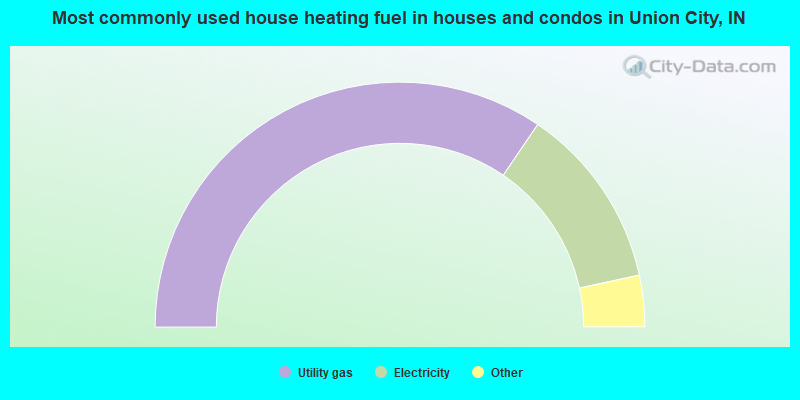
- 69.1%Utility gas
- 24.2%Electricity
- 3.3%Bottled, tank, or LP gas
- 2.4%Wood
- 1.0%Other fuel
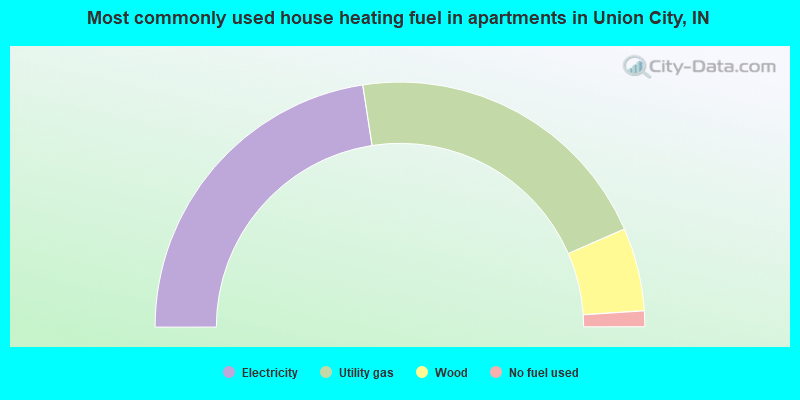
- 45.2%Electricity
- 41.8%Utility gas
- 11.0%Wood
- 2.1%No fuel used
Private vs. public school enrollment:
| Here: | 0.0% |
| Indiana: | 14.9% |
| Here: | 8.3% |
| Indiana: | 11.4% |
| Here: | 0.0% |
| Indiana: | 22.3% |


