Union Hill-Novelty Hill, WA (Washington) Houses and Residents
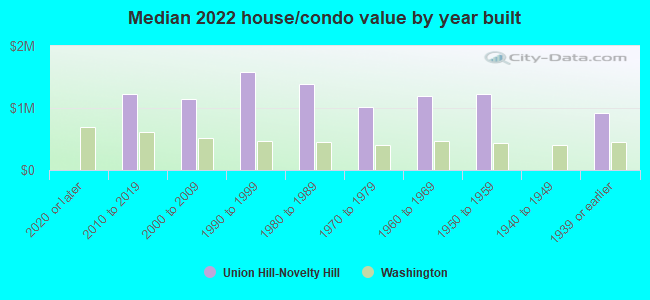
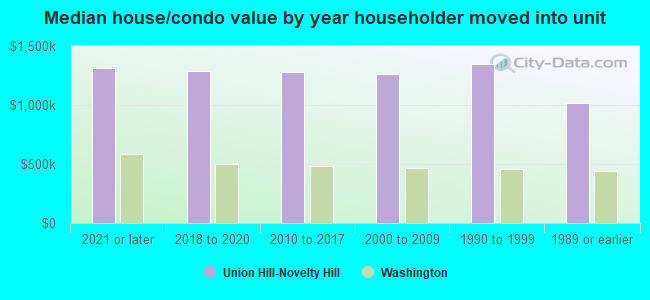
| Union Hill-Novelty Hill: | $1,255,540 |
| Washington: | $569,500 |
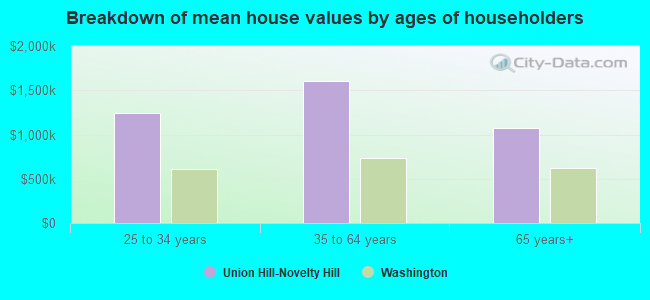
Mean price in 2022:
Detached houses: $1,258,021
Here: $1,258,021 State: $734,307 Townhouses or other attached units: $775,145
Here: $775,145 State: $657,697 In 5-or-more-unit structures: $551,014
Here: $551,014 State: $503,183 Mobile homes: $93,353
Here: $93,353 State: $218,362
Total population: 18,805 (Urban population: 9,112, Rural population: 2,067 (all nonfarm))
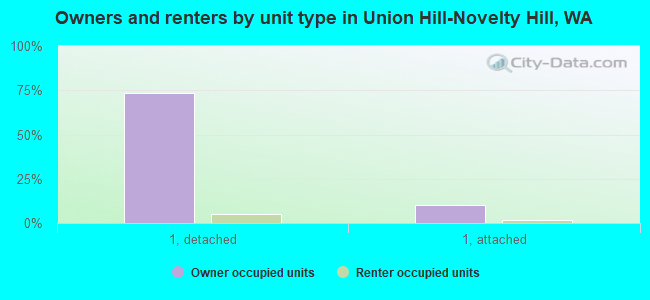
Houses: 9,032 (8,761 occupied: 7,392 owner occupied, 1,357 renter occupied)
| % of renters here: | 16% |
| State: | 36% |
Housing density: 371 houses/condos per square mile
Median price asked for vacant for-sale houses and condos in 2022: $474,690.
Median contract rent in 2022: over $2,000 (lower quartile is $1,678, upper quartile is over $2,000)
Median rent asked for vacant for-rent units in 2022: $9,345
Median gross rent in Union Hill-Novelty Hill, WA in 2022: over $2,000
Housing units in Union Hill-Novelty Hill with a mortgage: 4,765 (611 second mortgage, 17 home equity loan, 541 both second mortgage and home equity loan)
Houses without a mortgage: 65
Median household income for houses/condos with a mortgage: $245,235
Median household income for apartments without a mortgage: $162,292
Median monthly housing costs: $2,637
Compare current foreclosures near Union Hill-Novelty Hill, WA:
| Photo | Address | Area | Beds / Baths | Price | Details |
|---|---|---|---|---|---|

|
#1
4th Ave W Apt 6a
Everett, WA 98204
|
1,346 sq. feet
|
3 baths 2 beds |
show details | |

|
#2
57th Ave S Unit B104
Seattle, WA 98178
|
572 sq. feet
|
1 baths 1 beds |
show details | |

|
#3
1st Ave S # 806
Seattle, WA 98104
|
806 sq. feet
|
1 baths 1 beds |
show details | |

|
#4
3rd Dr SE
Bothell, WA 98012
|
1,957 sq. feet
|
2 baths 4 beds |
show details | |

|
#5
N Ridge Dr
Snohomish, WA 98290
|
2,033 sq. feet
|
3 baths 3 beds |
show details | |

|
#6
S 18th St
Renton, WA 98055
|
2,680 sq. feet
|
1 baths 4 beds |
show details | |

|
#7
NW 59th St
Seattle, WA 98107
|
1,110 sq. feet
|
1 baths 3 beds |
show details | |

|
#8
SE 24th Way
Sammamish, WA 98075
|
770 sq. feet
|
1 baths 2 beds |
show details | |

|
#9
NE 142nd Pl
Kirkland, WA 98034
|
1,830 sq. feet
|
2 baths 3 beds |
show details | |

|
#10
116th Ave NE
Kirkland, WA 98033
|
1,260 sq. feet
|
2 baths 3 beds |
show details |
| Photo | Address | Area | Beds / Baths | Price | Details |
|---|---|---|---|---|---|

|
#11
114th Ave NE
Kirkland, WA 98033
|
1,950 sq. feet
|
2 baths 4 beds |
show details | |

|
#12
NE 173rd St
Woodinville, WA 98072
|
2,730 sq. feet
|
2 baths 3 beds |
show details | |

|
#13
Cascadian Way
Bothell, WA 98012
|
1,492 sq. feet
|
2 baths 3 beds |
show details | |

|
#14
NE Woodinville Duvall Rd
Woodinville, WA 98072
|
1,520 sq. feet
|
1 baths 2 beds |
show details | |

|
#15
13th Ave NW
Seattle, WA 98117
|
1,490 sq. feet
|
2 baths 3 beds |
show details | |

|
#16
Heintz Ave SE
Monroe, WA 98272
|
1,455 sq. feet
|
2 baths 3 beds |
show details | |

|
#17
NE 134th Pl
Kirkland, WA 98034
|
2,893 sq. feet
|
3 baths 4 beds |
show details | |

|
#18
152nd St SE
Monroe, WA 98272
|
2,573 sq. feet
|
3 baths 3 beds |
show details | |

|
#19
SE 14th St
Sammamish, WA 98075
|
3,520 sq. feet
|
3 baths 6 beds |
show details | |

|
#20
51st Ave NE
Seattle, WA 98115
|
2,450 sq. feet
|
2 baths 4 beds |
show details |
| Photo | Address | Area | Beds / Baths | Price | Details |
|---|---|---|---|---|---|

|
#21
20th Ave SE
Bothell, WA 98021
|
1,552 sq. feet
|
2 baths 3 beds |
show details | |

|
#22
4th Ave W
Everett, WA 98204
|
1,206 sq. feet
|
2 baths 2 beds |
show details | |

|
#23
8th Ave W
Seattle, WA 98119
|
1,400 sq. feet
|
1 baths 3 beds |
show details | |

|
#24
205th Ave SE
Renton, WA 98059
|
2,130 sq. feet
|
2 baths 3 beds |
show details | |

|
#25
199th St SW
Bothell, WA 98012
|
2,846 sq. feet
|
2 baths 4 beds |
show details | |

|
#26
SE 170th St
Renton, WA 98058
|
960 sq. feet
|
1 baths 3 beds |
show details | |

|
#27
SE 47th Pl
Issaquah, WA 98029
|
2,610 sq. feet
|
2 baths 3 beds |
show details | |

|
#28
20th Ave W
Lynnwood, WA 98037
|
912 sq. feet
|
1 baths 3 beds |
show details | |

|
#29
77th Ave S
Seattle, WA 98178
|
3,090 sq. feet
|
4 baths 6 beds |
show details | |

|
#30
49th Ave SE
Bothell, WA 98012
|
1,756 sq. feet
|
2 baths 3 beds |
show details |
| Photo | Address | Area | Beds / Baths | Price | Details |
|---|---|---|---|---|---|

|
#31
320th Ave NE
Duvall, WA 98019
|
3,140 sq. feet
|
2 baths 3 beds |
show details | |

|
#32
230th Way SE
Sammamish, WA 98075
|
3,036 sq. feet
|
3 baths 4 beds |
show details | |

|
#33
NE 190th St
Seattle, WA 98155
|
2,070 sq. feet
|
2 baths 5 beds |
show details | |

|
#34
E Lynn St # 98102
Seattle, WA 98102
|
792 sq. feet
|
1 baths - beds |
show details | |

|
#35
59th Ave SE
Snohomish, WA 98296
|
2,641 sq. feet
|
2 baths 5 beds |
show details | |

|
#36
58th Ln NE
Kenmore, WA 98028
|
2,700 sq. feet
|
2 baths 3 beds |
show details | |

|
#37
119th Pl SE
Everett, WA 98208
|
1,296 sq. feet
|
1 baths 3 beds |
show details | |

|
#38
67th Pl W
Mountlake Terrace, WA 98043
|
2,194 sq. feet
|
2 baths 5 beds |
show details | |

|
#39
116th St SE
Everett, WA 98208
|
1,248 sq. feet
|
2 baths 3 beds |
show details | |

|
#40
Lyons Ave NE
Renton, WA 98059
|
2,510 sq. feet
|
2 baths 3 beds |
show details |
| Photo | Address | Area | Beds / Baths | Price | Details |
|---|---|---|---|---|---|

|
#41
NE 172nd St
Duvall, WA 98019
|
3,780 sq. feet
|
3 baths 4 beds |
show details | |

|
#42
210th St SE
Snohomish, WA 98296
|
1,580 sq. feet
|
2 baths 3 beds |
show details | |

|
#43
1st Ave NE
Seattle, WA 98115
|
1,110 sq. feet
|
1 baths 4 beds |
show details | |

|
#44
19th Dr SE
Bothell, WA 98012
|
852 sq. feet
|
1 baths 3 beds |
show details | |

|
#45
148th St SE
Everett, WA 98208
|
1,466 sq. feet
|
2 baths 3 beds |
show details | |

|
#46
S Sullivan St
Seattle, WA 98118
|
1,710 sq. feet
|
2 baths 3 beds |
show details | |

|
#47
Woods Creek Rd
Monroe, WA 98272
|
2,496 sq. feet
|
2 baths 4 beds |
show details | |

|
#48
173rd Pl SE
Monroe, WA 98272
|
1,024 sq. feet
|
2 baths 3 beds |
show details | |

|
#49
NE 88th St
Seattle, WA 98115
|
2,200 sq. feet
|
2 baths 3 beds |
show details | |

|
Check over 1 million property listings on Foreclosure.com!
|
browse all offers | |||


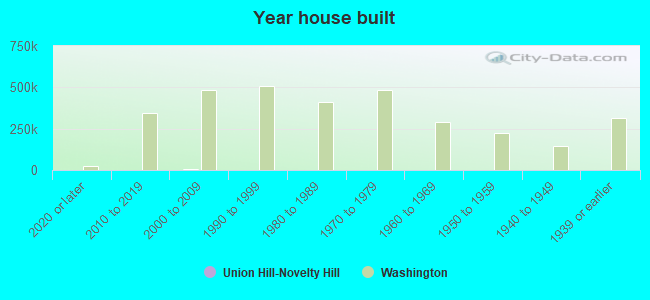
Median year apartment built: 2007
Household type by relationship:
Households: 23,300- Male householders: 5,339 (677 living alone), Female householders: 3,190 (959 living alone)
6,301 spouses (6,273 opposite-sex spouses), 260 unmarried partners, (226 opposite-sex unmarried partners), 7,333 children (7,256 natural, 57 adopted, 19 stepchildren), 72 grandchildren, 33 brothers or sisters, 324 parents, 0 foster children, 136 other relatives, 289 non-relatives
- In group quarters: 19
Size of family households: 2,779 2-persons, 1,318 3-persons, 1,843 4-persons, 413 5-persons, 84 6-persons, 127 7-or-more-persons.
Size of nonfamily households: 1,760 1-person, 219 2-persons, 42 3-persons, 2 6-persons.
5,194 married couples with children.
460 single-parent households (316 men, 144 women).
68.7% of residents of Union Hill-Novelty Hill speak English at home.
2.3% of residents speak Spanish at home (84% speak English very well, 6% speak English well, 8% speak English not well, 2% don't speak English at all).
14.9% of residents speak other Indo-European language at home (91% speak English very well, 7% speak English well, 2% speak English not well).
11.2% of residents speak Asian or Pacific Island language at home (77% speak English very well, 18% speak English well, 5% speak English not well).
3.6% of residents speak other language at home (51% speak English very well, 21% speak English well, 28% speak English not well).
Foreign born population: 7,067 (30.3%)
(41.1% of them are naturalized citizens)
| Here: | 7.5 |
| State: | 6.5 |
| Here: | 4.5 |
| State: | 3.9 |
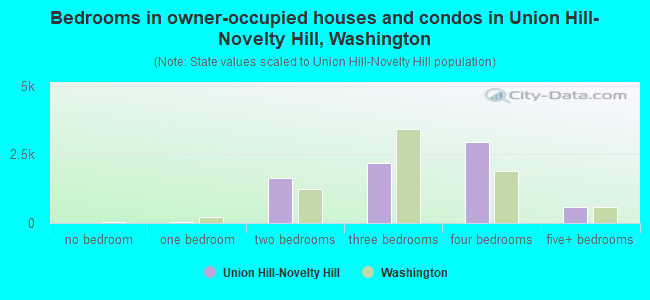
- Bedrooms in owner-occupied houses and condos in Union Hill-Novelty Hill, Washington
- 0no bedroom
- 441 bedroom
- 1,6282 bedrooms
- 2,1813 bedrooms
- 2,9554 bedrooms
- 5845+ bedrooms
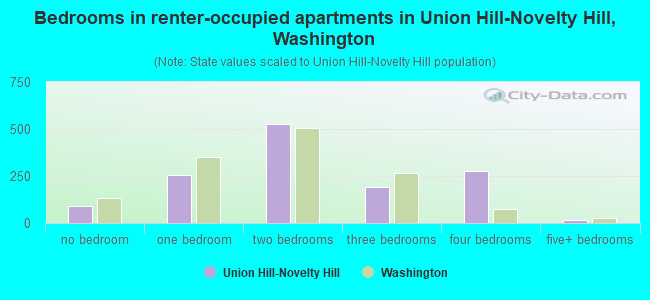
- Bedrooms in renter-occupied apartments in Union Hill-Novelty Hill, Washington
- 92no bedroom
- 2531 bedroom
- 5262 bedrooms
- 1913 bedrooms
- 2784 bedrooms
- 185+ bedrooms
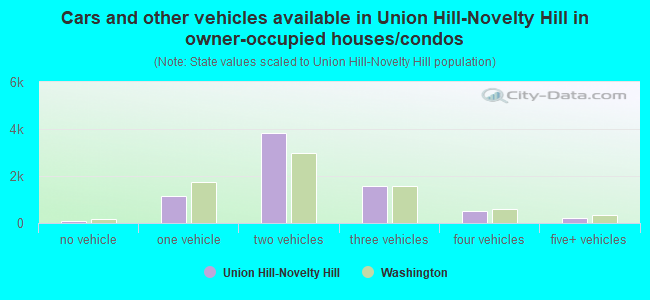
- Cars and other vehicles available in Union Hill-Novelty Hill in owner-occupied houses/condos
- 106no vehicle
- 1,1571 vehicle
- 3,8332 vehicles
- 1,5713 vehicles
- 5224 vehicles
- 2035+ vehicles
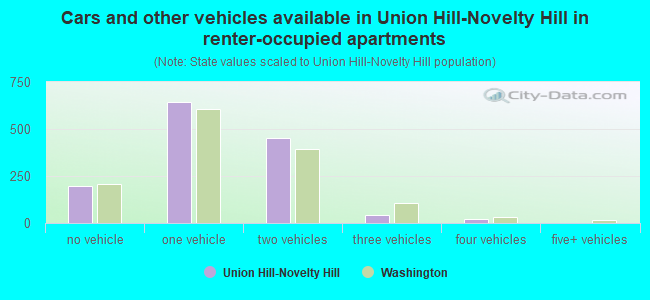
- Cars and other vehicles available in Union Hill-Novelty Hill in renter-occupied apartments
- 197no vehicle
- 6461 vehicle
- 4512 vehicles
- 453 vehicles
- 194 vehicles
- 05+ vehicles
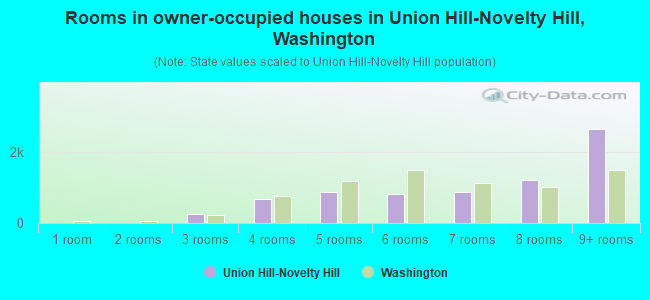
- Rooms in owner-occupied houses in Union Hill-Novelty Hill, Washington
- 01 room
- 02 rooms
- 2473 rooms
- 6874 rooms
- 8845 rooms
- 8316 rooms
- 8877 rooms
- 1,2038 rooms
- 2,6549+ rooms
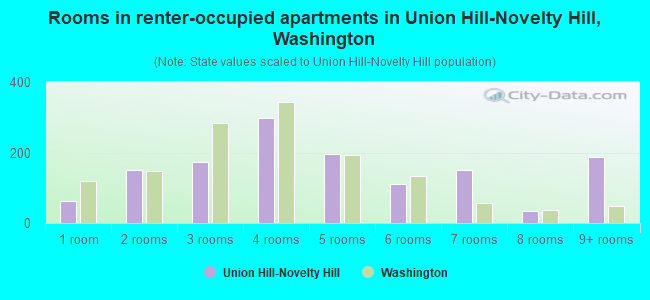
- Rooms in renter-occupied apartments in Union Hill-Novelty Hill, Washington
- 621 room
- 1502 rooms
- 1723 rooms
- 2974 rooms
- 1965 rooms
- 1126 rooms
- 1497 rooms
- 348 rooms
- 1869+ rooms
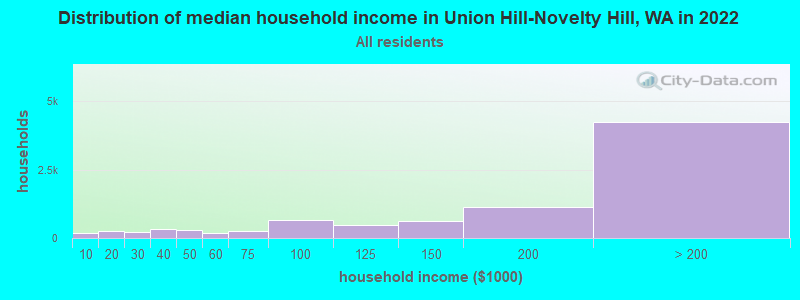
Union Hill-Novelty Hill, WA household income distribution

- 183Less than $10,000
- 262$10,000 to $19,999
- 205$20,000 to $29,999
- 346$30,000 to $39,999
- 307$40,000 to $49,999
- 185$50,000 to $59,999
- 250$60,000 to $74,999
- 660$75,000 to $99,999
- 470$100,000 to $124,999
- 621$125,000 to $149,999
- 1,126$150,000 to $199,999
- 4,239$200,000 or more
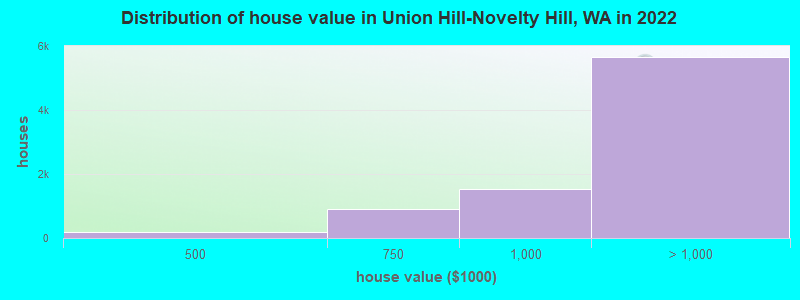
Home value of owner - occupied houses in 2022 in Union Hill-Novelty Hill, WA
-
- 32Less than $10,000
- 8$70,000 to $79,999
- 20$80,000 to $89,999
- 14$90,000 to $99,999
- 29$100,000 to $124,999
- 6$150,000 to $174,999
- 5$200,000 to $249,999
- 5$250,000 to $299,999
- 10$300,000 to $399,999
- 184$400,000 to $499,999
- 916$500,000 to $749,999
- 1,518$750,000 to $999,999
- 2,913$1,000,000 to $1,499,999
- 1,664$1,500,000 to $1,999,999
- 1,082$2,000,000 or more
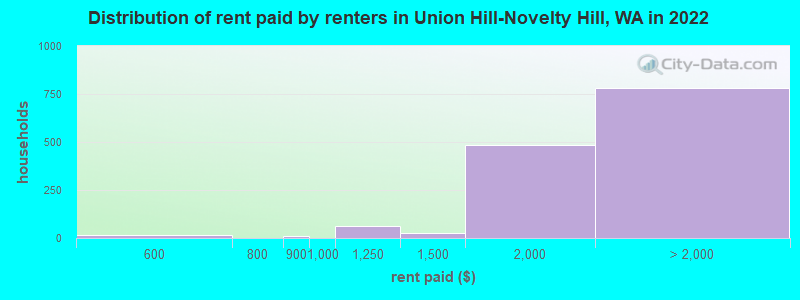
Rent paid by renters in 2022 in Union Hill-Novelty Hill, WA
-
- 16$550 to $599
- 9$800 to $899
- 61$1,000 to $1,249
- 23$1,250 to $1,499
- 485$1,500 to $1,999
- 160$2,000 to $2,499
- 149$2,500 to $2,999
- 295$3,000 to $3,499
- 84$3,500 or more
- 92No cash rent
Percentage of workers working in this county: 97.9%
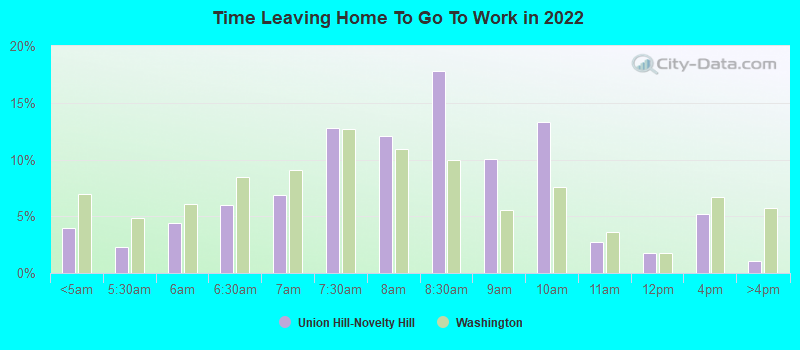
Number of people working at home: 4,719 (48.0% of all workers)
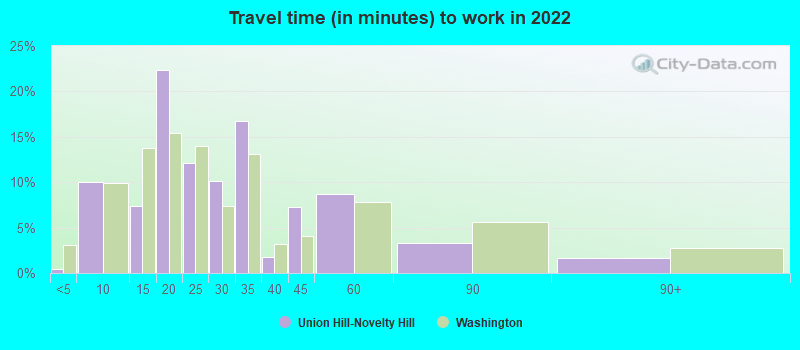
Travel time to work (commute)
- Less than 5 minutes: 41
- 5 to 9 minutes: 320
- 10 to 14 minutes: 453
- 15 to 19 minutes: 545
- 20 to 24 minutes: 823
- 25 to 29 minutes: 573
- 30 to 34 minutes: 1,283
- 35 to 39 minutes: 260
- 40 to 44 minutes: 344
- 45 to 59 minutes: 502
- 60 to 89 minutes: 294
- 90 or more minutes: 173
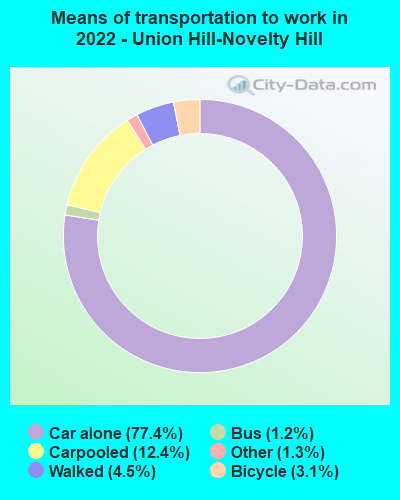
Means of transportation to work:
- Drove a car alone: 2,349 (35.5%)
- Carpooled: 362 (5.5%)
- Bus: 22 (0.3%)
- Taxi: 36 (0.5%)
- Bicycle: 87 (1.3%)
- Walked: 122 (1.8%)
- Worked at home: 4,719 (71.3%)
- Unemployment by race in 2022
- Unemployment rate for White non-Hispanic residents
- 4.5%Males
- 2.8%Females
- Unemployment rate for Black residents
- 49.6%Females
- Unemployment rate for Asian residents
- 1.8%Males
- 3.6%Females
- Unemployment rate for other race residents
- 6.6%Males
- 36.9%Females
- Unemployment rate for two or more race residents
- 12.5%Males
- Unemployment rate for Hispanic or Latino residents
- 4.4%Males
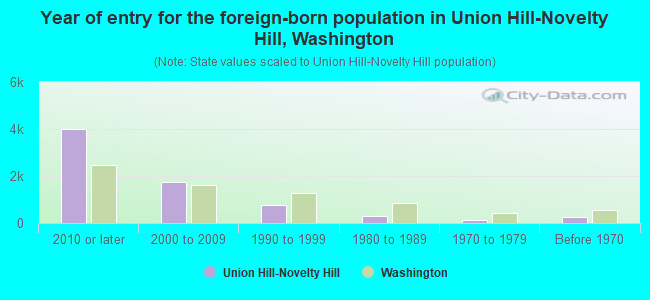
- Year of entry for the foreign-born population in Union Hill-Novelty Hill, Washington
- 3,9852010 or later
- 1,7412000 to 2009
- 7861990 to 1999
- 2921980 to 1989
- 1301970 to 1979
- 247Before 1970
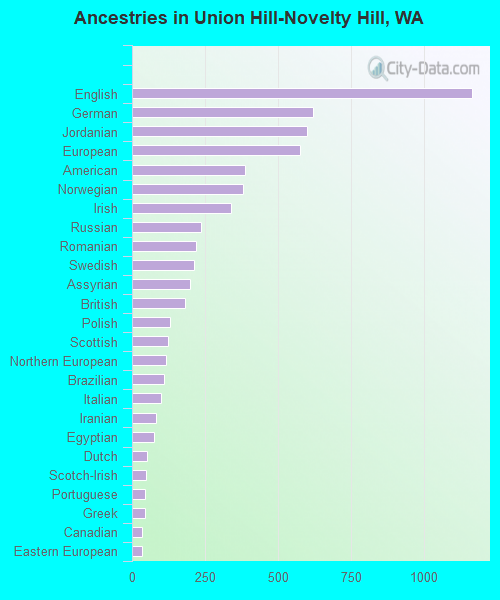
First ancestries reported:
- English: 1,166 (9.1%)
- German: 620 (4.8%)
- Jordanian: 600 (4.7%)
- European: 575 (4.5%)
- American: 387 (3.0%)
- Norwegian: 382 (3.0%)
- Irish: 340 (2.7%)
- Russian: 237 (1.8%)
- Romanian: 220 (1.7%)
- Swedish: 214 (1.7%)
- Assyrian: 200 (1.6%)
- British: 181 (1.4%)
- Polish: 131 (1.0%)
- Scottish: 124 (1.0%)
- Northern European: 118 (0.9%)
- Brazilian: 111 (0.9%)
- Italian: 100 (0.8%)
- Iranian: 82 (0.6%)
- Egyptian: 75 (0.6%)
- Dutch: 51 (0.4%)
- Scotch-Irish: 49 (0.4%)
- Portuguese: 43 (0.3%)
- Greek: 43 (0.3%)
- Canadian: 36 (0.3%)
- Eastern European: 33 (0.3%)
- Latvian: 33 (0.3%)
- Jamaican: 30 (0.2%)
- Scandinavian: 29 (0.2%)
- French: 29 (0.2%)
- Serbian: 26 (0.2%)
- Belgian: 21 (0.2%)
- French Canadian: 18 (0.1%)
- Australian: 15 (0.1%)
- Danish: 14 (0.1%)
- Austrian: 14 (0.1%)
- Swiss: 9 (0.07%)
- West Indian: 9 (0.07%)
- South African: 8 (0.06%)
- Welsh: 6 (0.05%)
- New Zealander: 5 (0.04%)
- Hungarian: 4 (0.03%)
- Finnish: 3 (0.02%)
- Estonian: 3 (0.02%)
- Icelander: 3 (0.02%)
- Ukrainian: 2 (0.02%)
- Armenian: 1 (0.01%)
Most common places of birth for foreign-born residents (%):
| Union Hill-Novelty Hill: | 43.7% (3,087) |
| Washington: | 8.9% (101,353) |
| Union Hill-Novelty Hill: | 5.8% (412) |
| Washington: | 7.4% (84,470) |
| Union Hill-Novelty Hill: | 4.5% (320) |
| Washington: | 0.1% (1,707) |
| Union Hill-Novelty Hill: | 3.4% (240) |
| Washington: | 1.9% (21,540) |
| Union Hill-Novelty Hill: | 3.3% (236) |
| Washington: | 4.3% (48,886) |
| Union Hill-Novelty Hill: | 3.1% (219) |
| Washington: | 4.1% (47,238) |
| Union Hill-Novelty Hill: | 3.0% (212) |
| Washington: | 0.8% (9,359) |
| Union Hill-Novelty Hill: | 2.1% (148) |
| Washington: | 0.7% (7,568) |
| Union Hill-Novelty Hill: | 2.0% (142) |
| Washington: | 6.3% (71,661) |
| Union Hill-Novelty Hill: | 2.0% (140) |
| Washington: | 1.0% (10,943) |
| Union Hill-Novelty Hill: | 1.5% (109) |
| Washington: | 1.5% (16,607) |
| Union Hill-Novelty Hill: | 1.5% (109) |
| Washington: | 0.3% (3,373) |
Place of birth for U.S.-born residents:
- This state: 7,933
- Other state: 8,013
- Northeast: 1,094
- Midwest: 2,061
- South: 1,257
- West: 3,610
88.6% of Union Hill-Novelty Hill residents lived in the same house 1 years ago.
Out of people who lived in different houses, 42.8% lived in this county.
Out of people who lived in different counties, 34.7% lived in Washington.
| Union Hill-Novelty Hill: | 88.6% |
| State average: | 85.2% |
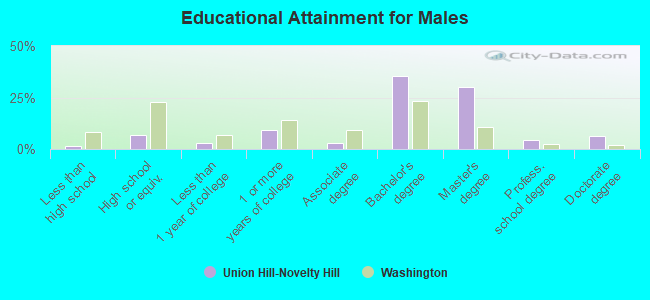
Education attainment for males 25 years and older:
- No schooling: 8
- Nursery to 4th grade: 0
- 5th and 6th grade: 0
- 7th and 8th grade: 13
- 9th grade: 0
- 10th grade: 12
- 11th grade: 8
- 12th grade, no diploma: 63
- High school graduate (or equivalency): 559
- Less than 1 year of college: 235
- Some college more than 1 year, no degree: 760
- Associate degree: 245
- Bachelor's degree: 2,840
- Master's degree: 2,442
- Professional school degree: 353
- Doctorate degree: 526
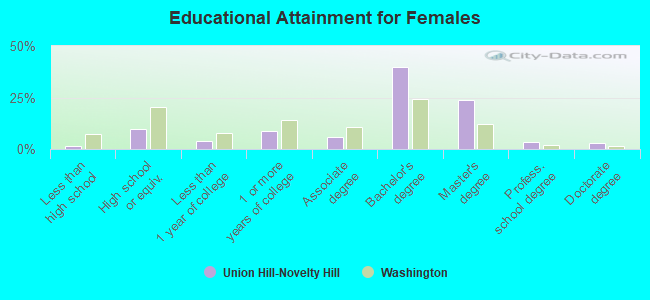
Education attainment for females 25 years and older:
- No schooling: 47
- Nursery to 4th grade: 0
- 5th and 6th grade: 12
- 7th and 8th grade: 12
- 9th grade: 10
- 10th grade: 0
- 11th grade: 14
- 12th grade, no diploma: 47
- High school graduate (or equivalency): 830
- Less than 1 year of college: 346
- Some college more than 1 year, no degree: 745
- Associate degree: 512
- Bachelor's degree: 3,451
- Master's degree: 2,065
- Professional school degree: 298
- Doctorate degree: 246


Housing units in structures:
- One, detached: 7,276
- One, attached: 859
- Two: 40
- 3 or 4: 104
- 5 to 9: 77
- 10 to 19: 156
- 20 to 49: 145
- 50 or more: 276
- Mobile homes: 96
Median worth of mobile homes: $748,810
Housing units lacking complete kitchen facilities in 2022: 0.7%
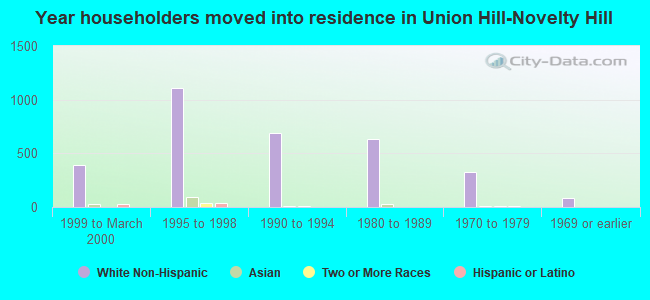
House/condo owner moved in on average 9 years ago
Renter moved in on average 1 years ago
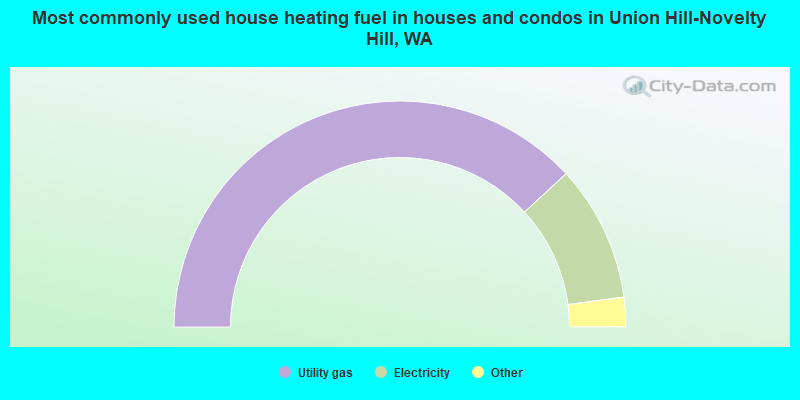
- 76.3%Utility gas
- 19.5%Electricity
- 3.1%Bottled, tank, or LP gas
- 0.8%Wood
- 0.2%Fuel oil, kerosene, etc.
- 0.1%Other fuel
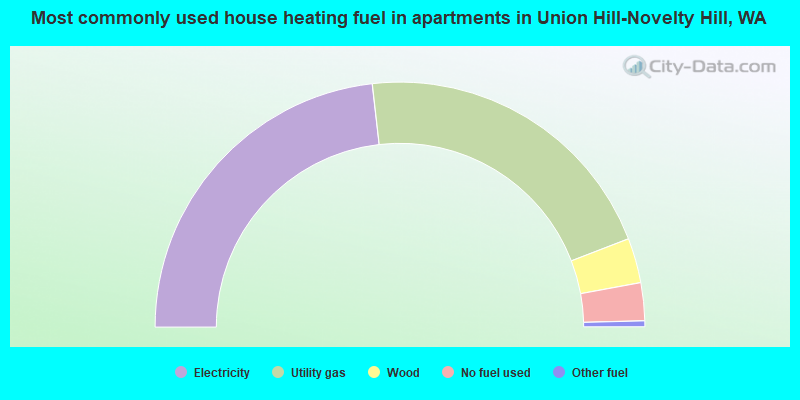
- 46.4%Electricity
- 41.9%Utility gas
- 5.9%Wood
- 5.0%No fuel used
- 0.8%Other fuel
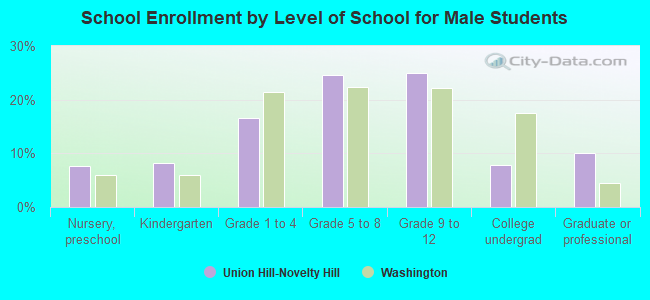
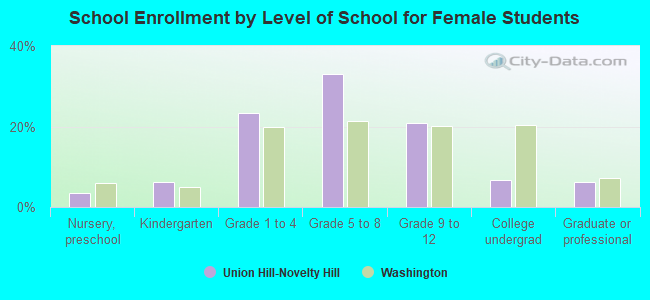
Private vs. public school enrollment:
| Here: | 10.5% |
| Washington: | 12.4% |
| Here: | 11.9% |
| Washington: | 9.2% |
| Here: | 20.0% |
| Washington: | 16.5% |