Utica, IN (Indiana) Houses and Residents
| Utica: | $204,407 |
| Indiana: | $208,700 |
Mean price in 2022:
Detached houses: $241,932
Here: $241,932 State: $257,916 Townhouses or other attached units: $398,635
Here: $398,635 State: $224,114 Mobile homes: $77,683
Here: $77,683 State: $67,116
Total population: 795 (Urban population: 540, Rural population: 40 (all nonfarm))
Houses: 435 (379 occupied: 340 owner occupied, 50 renter occupied)
| % of renters here: | 13% |
| State: | 29% |
Housing density: 1,002 houses/condos per square mile
Median price asked for vacant for-sale houses and condos in 2022: $479,290.
Median contract rent in 2022: $1,028 (lower quartile is $878, upper quartile is $1,617)
Median rent asked for vacant for-rent units in 2022: $1,278
Median gross rent in Utica, IN in 2022: $1,404
Housing units in Utica with a mortgage: 198 (8 second mortgage, 0 home equity loan, 8 both second mortgage and home equity loan)
Houses without a mortgage: 4
Median household income for houses/condos with a mortgage: $88,023
Median household income for apartments without a mortgage: $69,489
Median monthly housing costs: $1,014
Compare current foreclosures near Utica, IN:
| Photo | Address | Area | Beds / Baths | Price | Details |
|---|---|---|---|---|---|

|
#1
Cedrus Cir
Louisville, KY 40213
|
1,187 sq. feet
|
2 baths 4 beds |
$180,000
|
show details |

|
#2
Doe Run Way
New Albany, IN 47150
|
1,380 sq. feet
|
2 baths 3 beds |
$285,000
|
show details |

|
#3
Melody Way
Louisville, KY 40299
|
1,242 sq. feet
|
1 baths 3 beds |
$300,000
|
show details |

|
#4
Marshall Dr
Charlestown, IN 47111
|
1,650 sq. feet
|
1 baths 4 beds |
show details | |

|
#5
Redbud Dr
New Albany, IN 47150
|
1,080 sq. feet
|
1 baths 3 beds |
show details | |

|
#6
Nabb New Washington Rd E
Nabb, IN 47147
|
1,671 sq. feet
|
2 baths 3 beds |
show details | |

|
#7
S Bayly Ave
Louisville, KY 40206
|
2,610 sq. feet
|
2 baths 2 beds |
show details | |

|
#8
Morris Ave
Jeffersonville, IN 47130
|
1,320 sq. feet
|
1 baths 3 beds |
show details | |

|
#9
Burrell Dr
Louisville, KY 40216
|
1,170 sq. feet
|
1 baths 3 beds |
show details | |

|
#10
Fieldstone Ct
New Albany, IN 47150
|
1,276 sq. feet
|
2 baths 3 beds |
show details |
| Photo | Address | Area | Beds / Baths | Price | Details |
|---|---|---|---|---|---|

|
#11
Roosevelt Ave
Louisville, KY 40213
|
- sq. feet
|
1 baths 4 beds |
show details | |

|
#12
Eastside Ave
Sellersburg, IN 47172
|
1,266 sq. feet
|
1 baths 3 beds |
show details | |

|
#13
Breckenridge Ln
Louisville, KY 40218
|
1,472 sq. feet
|
1 baths 2 beds |
show details | |

|
#14
S Clark Blvd
Clarksville, IN 47129
|
2,304 sq. feet
|
2 baths 3 beds |
show details | |

|
#15
Cross Rd
Louisville, KY 40204
|
2,696 sq. feet
|
2 baths 2 beds |
show details | |

|
#16
Sunset Ln
Crestwood, KY 40014
|
2,574 sq. feet
|
3 baths 4 beds |
show details | |

|
#17
S 42nd St
Louisville, KY 40211
|
1,078 sq. feet
|
1 baths 1 beds |
show details | |

|
#18
Hillside Cir
Charlestown, IN 47111
|
1,322 sq. feet
|
2 baths 3 beds |
show details | |

|
#19
Jersey Park Rd
Floyds Knobs, IN 47119
|
720 sq. feet
|
1 baths 1 beds |
show details | |

|
#20
S 5th St
Louisville, KY 40214
|
1,008 sq. feet
|
1 baths 3 beds |
show details |
| Photo | Address | Area | Beds / Baths | Price | Details |
|---|---|---|---|---|---|

|
#21
W Chestnut St
Louisville, KY 40203
|
1,568 sq. feet
|
3 baths 3 beds |
show details | |

|
#22
Pierce Rd
New Washington, IN 47162
|
1,610 sq. feet
|
2 baths 3 beds |
show details | |

|
#23
Fulton St
Jeffersonville, IN 47130
|
1,072 sq. feet
|
1 baths 3 beds |
show details | |

|
#24
Brush College Rd
Floyds Knobs, IN 47119
|
1,392 sq. feet
|
1 baths 2 beds |
show details | |

|
#25
Popp Ave
Sellersburg, IN 47172
|
1,372 sq. feet
|
1 baths 3 beds |
show details | |

|
#26
Buckthorn Ct
Otisco, IN 47163
|
1,258 sq. feet
|
2 baths 3 beds |
show details | |

|
#27
Old State Road 60
Sellersburg, IN 47172
|
1,184 sq. feet
|
1 baths 2 beds |
show details | |

|
#28
E Court Ave
Jeffersonville, IN 47130
|
950 sq. feet
|
1 baths 3 beds |
show details | |

|
#29
Silver Plains Trce
Memphis, IN 47143
|
1,802 sq. feet
|
2 baths 3 beds |
show details | |

|
#30
Woodruff Ave
Louisville, KY 40215
|
809 sq. feet
|
1 baths - beds |
show details |
| Photo | Address | Area | Beds / Baths | Price | Details |
|---|---|---|---|---|---|

|
#31
Popp Ave
Sellersburg, IN 47172
|
1,402 sq. feet
|
1 baths 3 beds |
show details | |

|
#32
Edgewood Dr
Sellersburg, IN 47172
|
1,026 sq. feet
|
1 baths 3 beds |
show details | |

|
#33
Willow Dr
Jeffersonville, IN 47130
|
1,053 sq. feet
|
1 baths 3 beds |
show details | |

|
#34
N Clark Blvd
Clarksville, IN 47129
|
868 sq. feet
|
2 baths 4 beds |
show details | |

|
#35
W Charlestown Ave
Jeffersonville, IN 47130
|
1,026 sq. feet
|
1 baths 3 beds |
show details | |

|
#36
N Mckinley Ave
Clarksville, IN 47129
|
1,320 sq. feet
|
1 baths 3 beds |
show details | |

|
#37
Spicewood Dr
Clarksville, IN 47129
|
1,911 sq. feet
|
1 baths 4 beds |
show details | |

|
#38
S Elm St
Clarksville, IN 47129
|
1,358 sq. feet
|
1 baths 3 beds |
show details | |

|
#39
N Mckinley Ave
Clarksville, IN 47129
|
1,082 sq. feet
|
1 baths 3 beds |
show details | |

|
#40
Birch Dr
Clarksville, IN 47129
|
2,058 sq. feet
|
2 baths 3 beds |
show details |
| Photo | Address | Area | Beds / Baths | Price | Details |
|---|---|---|---|---|---|

|
#41
S Oak St
Clarksville, IN 47129
|
1,867 sq. feet
|
1 baths 4 beds |
show details | |

|
#42
Longfellow Dr
Clarksville, IN 47129
|
1,512 sq. feet
|
1 baths 3 beds |
show details | |

|
#43
Whittier Dr
Clarksville, IN 47129
|
1,073 sq. feet
|
1 baths 3 beds |
show details | |

|
#44
N Patterson Ave
Clarksville, IN 47129
|
1,026 sq. feet
|
1 baths 3 beds |
show details | |

|
#45
Orchard Walk
Charlestown, IN 47111
|
2,645 sq. feet
|
3 baths 3 beds |
show details | |

|
#46
Joseph Dr
Sellersburg, IN 47172
|
1,359 sq. feet
|
2 baths 3 beds |
show details | |

|
#47
Old Vincennes Rd
Floyds Knobs, IN 47119
|
968 sq. feet
|
2 baths 3 beds |
show details | |

|
#48
Victory Ct
Clarksville, IN 47129
|
840 sq. feet
|
1 baths 3 beds |
show details | |

|
#49
Ehringer Ln
Sellersburg, IN 47172
|
982 sq. feet
|
1 baths 2 beds |
show details | |

|
Check over 1 million property listings on Foreclosure.com!
|
browse all offers | |||

Latest news about housing in Utica, IN collected exclusively by city-data.com from local newspapers, TV, and radio stations

 | Many NYers in Indianapolis? (34 replies) |

Median year apartment built: 1978
Household type by relationship:
Households: 953- Male householders: 195 (74 living alone), Female householders: 174 (47 living alone)
159 spouses (159 opposite-sex spouses), 23 unmarried partners, (23 opposite-sex unmarried partners), 287 children (238 natural, 6 adopted, 42 stepchildren), 37 grandchildren, 0 brothers or sisters, 13 parents, 0 foster children, 25 other relatives, 34 non-relatives
- In group quarters: 1
Size of family households: 133 2-persons, 21 3-persons, 79 4-persons, 6 6-persons, 3 7-or-more-persons.
Size of nonfamily households: 139 1-person, 11 2-persons.
76 married couples with children.
140 single-parent households (33 men, 107 women).
91.4% of residents of Utica speak English at home.
3.0% of residents speak Spanish at home (56% speak English very well, 22% speak English well, 22% speak English not well).
5.7% of residents speak other Indo-European language at home (100% speak English very well).
Foreign born population: 43 (4.5%)
(67.4% of them are naturalized citizens)
| Here: | 6.2 |
| State: | 6.6 |
| Here: | 5.4 |
| State: | 4.3 |

- Bedrooms in owner-occupied houses and condos in Utica, Indiana
- 0no bedroom
- 111 bedroom
- 952 bedrooms
- 1723 bedrooms
- 594 bedrooms
- 35+ bedrooms

- Bedrooms in renter-occupied apartments in Utica, Indiana
- 0no bedroom
- 21 bedroom
- 172 bedrooms
- 283 bedrooms
- 34 bedrooms
- 05+ bedrooms

- Cars and other vehicles available in Utica in owner-occupied houses/condos
- 14no vehicle
- 681 vehicle
- 1612 vehicles
- 723 vehicles
- 234 vehicles
- 25+ vehicles

- Cars and other vehicles available in Utica in renter-occupied apartments
- 0no vehicle
- 131 vehicle
- 352 vehicles
- 03 vehicles
- 34 vehicles
- 05+ vehicles

- Rooms in owner-occupied houses in Utica, Indiana
- 01 room
- 22 rooms
- 03 rooms
- 774 rooms
- 685 rooms
- 496 rooms
- 667 rooms
- 368 rooms
- 439+ rooms

- Rooms in renter-occupied apartments in Utica, Indiana
- 01 room
- 02 rooms
- 93 rooms
- 04 rooms
- 125 rooms
- 156 rooms
- 127 rooms
- 38 rooms
- 09+ rooms


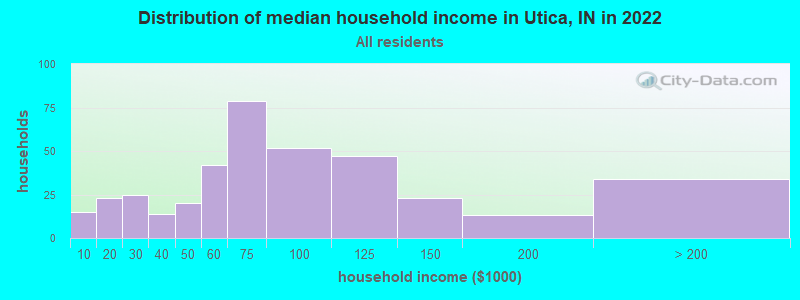
Utica, IN household income distribution

- 15Less than $10,000
- 23$10,000 to $19,999
- 25$20,000 to $29,999
- 14$30,000 to $39,999
- 20$40,000 to $49,999
- 42$50,000 to $59,999
- 79$60,000 to $74,999
- 52$75,000 to $99,999
- 47$100,000 to $124,999
- 23$125,000 to $149,999
- 13$150,000 to $199,999
- 34$200,000 or more
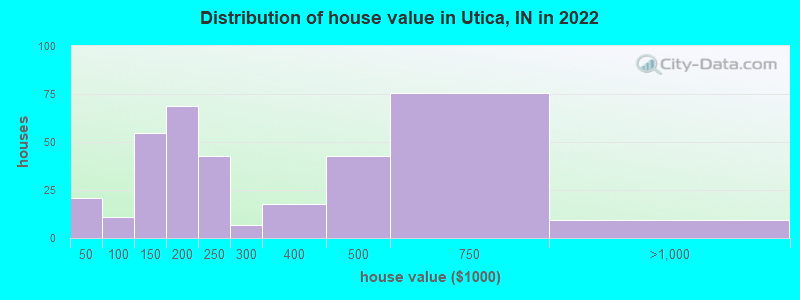
Home value of owner - occupied houses in 2022 in Utica, IN
-
- 1$10,000 to $14,999
- 6$15,000 to $19,999
- 1$20,000 to $24,999
- 11$35,000 to $39,999
- 1$50,000 to $59,999
- 7$70,000 to $79,999
- 1$80,000 to $89,999
- 32$100,000 to $124,999
- 21$125,000 to $149,999
- 31$150,000 to $174,999
- 37$175,000 to $199,999
- 42$200,000 to $249,999
- 6$250,000 to $299,999
- 17$300,000 to $399,999
- 42$400,000 to $499,999
- 75$500,000 to $749,999
- 9$750,000 to $999,999
Rent paid by renters in 2022 in Utica, IN
-
- 1$450 to $499
- 3$500 to $549
- 1$550 to $599
- 6$800 to $899
- 8$900 to $999
- 3$1,000 to $1,249
- 8$1,250 to $1,499
- 14$1,500 to $1,999
- 2No cash rent

Percentage of workers working in this county: 46.7%
Number of people working at home: 46 (10.2% of all workers)
Travel time to work (commute)
- Less than 5 minutes: 2
- 5 to 9 minutes: 39
- 10 to 14 minutes: 28
- 15 to 19 minutes: 67
- 20 to 24 minutes: 117
- 25 to 29 minutes: 27
- 30 to 34 minutes: 85
- 35 to 39 minutes: 20
- 40 to 44 minutes: 10
- 45 to 59 minutes: 5
- 60 to 89 minutes: 5
- 90 or more minutes: 10
Means of transportation to work:
- Drove a car alone: 261 (87.6%)
- Carpooled: 17 (5.7%)
- Motorcycle: 2 (0.7%)
- Walked: 3 (1.0%)
- Other means: 6 (2.0%)
- Worked at home: 9 (3.0%)
- Unemployment by race in 2022
- Unemployment rate for White non-Hispanic residents
- 4.5%Males
- Unemployment rate for Black residents
- 8.7%Males
- Unemployment rate for two or more race residents
- 62.6%Males

- Year of entry for the foreign-born population in Utica, Indiana
- 62010 or later
- 142000 to 2009
- 41990 to 1999
- 01980 to 1989
- 51970 to 1979
- 0Before 1970

First ancestries reported:
- German: 91 (18.6%)
- American: 48 (9.8%)
- Irish: 48 (9.8%)
- English: 40 (8.2%)
- French: 10 (2.0%)
- Portuguese: 10 (2.0%)
- Italian: 7 (1.4%)
- British: 6 (1.2%)
- Polish: 4 (0.8%)
- Scotch-Irish: 4 (0.8%)
- Scottish: 3 (0.6%)
- West Indian: 3 (0.6%)
- Welsh: 2 (0.4%)
Most common places of birth for foreign-born residents (%):
| Utica: | 33.3% (14) |
| Indiana: | 27.0% (101,996) |
| Utica: | 19.0% (8) |
| Indiana: | 1.7% (6,439) |
| Utica: | 19.0% (8) |
| Indiana: | 0.2% (835) |
| Utica: | 16.7% (7) |
| Indiana: | 0.7% (2,626) |
| Utica: | 7.1% (3) |
| Indiana: | 0.1% (455) |
Place of birth for U.S.-born residents:
- This state: 407
- Other state: 479
- Northeast: 23
- Midwest: 117
- South: 312
- West: 17
73.5% of Utica residents lived in the same house 1 years ago.
Out of people who lived in different houses, 12.1% lived in this county.
Out of people who lived in different counties, 31.3% lived in Indiana.
| Utica: | 73.5% |
| State average: | 87.1% |
Education attainment for males 25 years and older:
- No schooling: 0
- Nursery to 4th grade: 0
- 5th and 6th grade: 0
- 7th and 8th grade: 0
- 9th grade: 3
- 10th grade: 0
- 11th grade: 8
- 12th grade, no diploma: 7
- High school graduate (or equivalency): 77
- Less than 1 year of college: 9
- Some college more than 1 year, no degree: 68
- Associate degree: 9
- Bachelor's degree: 92
- Master's degree: 16
- Professional school degree: 9
- Doctorate degree: 6

Education attainment for females 25 years and older:
- No schooling: 1
- Nursery to 4th grade: 0
- 5th and 6th grade: 0
- 7th and 8th grade: 8
- 9th grade: 0
- 10th grade: 4
- 11th grade: 20
- 12th grade, no diploma: 5
- High school graduate (or equivalency): 60
- Less than 1 year of college: 44
- Some college more than 1 year, no degree: 49
- Associate degree: 28
- Bachelor's degree: 109
- Master's degree: 21
- Professional school degree: 1
- Doctorate degree: 0


Housing units in structures:
- One, detached: 368
- One, attached: 30
- Two: 3
- 3 or 4: 4
- Mobile homes: 29
Median worth of mobile homes: $43,718
Housing units lacking complete kitchen facilities in 2022: 2.4%
House/condo owner moved in on average 5 years ago
Renter moved in on average -1 years ago

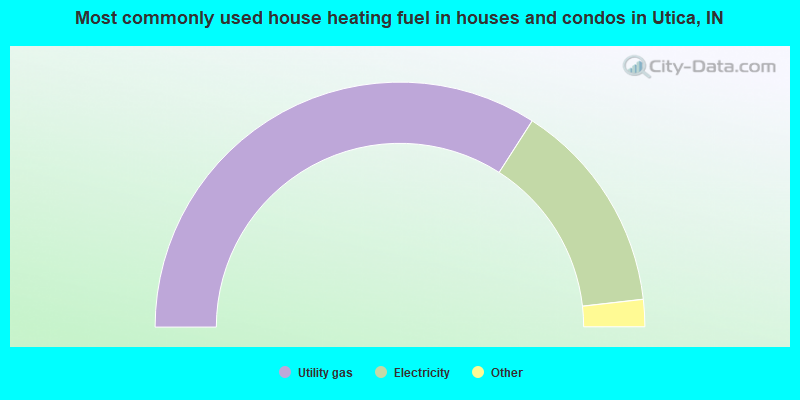
- 68.3%Utility gas
- 28.3%Electricity
- 1.9%Bottled, tank, or LP gas
- 1.3%Wood
- 0.3%Other fuel
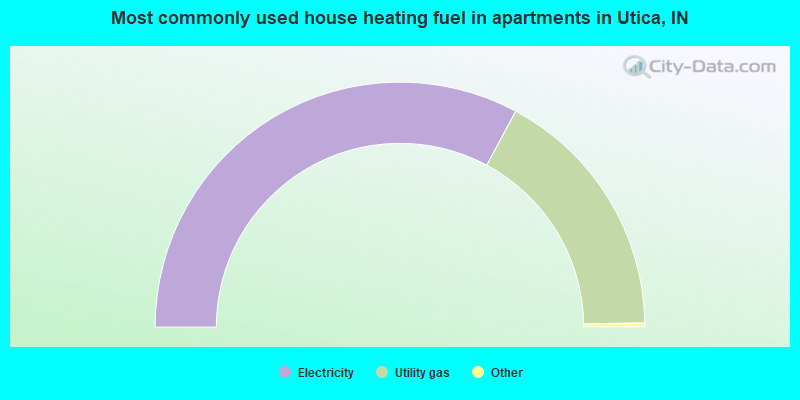
- 66.0%Electricity
- 34.0%Utility gas
Private vs. public school enrollment:
| Here: | 9.9% |
| Indiana: | 14.9% |
| Here: | 0.0% |
| Indiana: | 11.4% |
| Here: | 9.1% |
| Indiana: | 22.3% |


