Utica, NY (New York) Houses and Residents
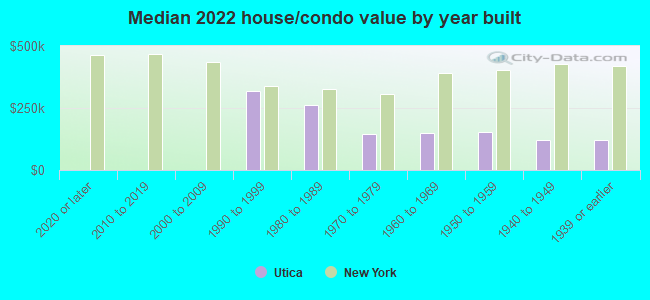
| Utica: | $131,891 |
| New York: | $400,400 |
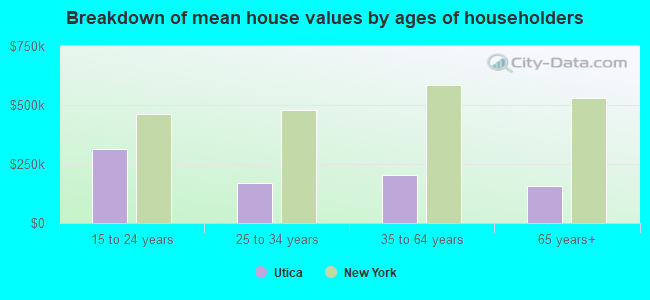
Mean price in 2022:
Detached houses: $152,500
Here: $152,500 State: $476,719 Townhouses or other attached units: $163,146
Here: $163,146 State: $699,270 In 2-unit structures: $281,932
Here: $281,932 State: $713,077 In 3-to-4-unit structures: $109,636
Here: $109,636 State: $764,568 In 5-or-more-unit structures: $861,175
Here: $861,175 State: $912,009 Mobile homes: $58,687
Here: $58,687 State: $88,925
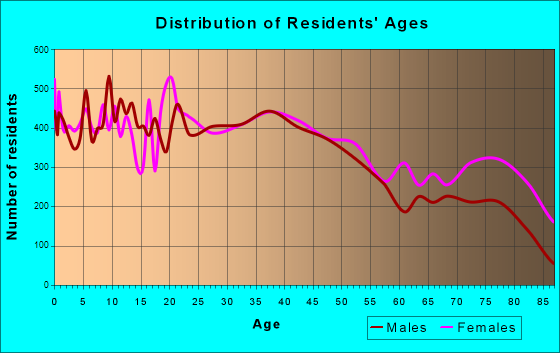
Total population: 61,332 (Urban population: 60,676, Rural population: 3 (all nonfarm))
Houses: 28,471 (24,731 occupied: 12,859 owner occupied, 13,167 renter occupied)
| % of renters here: | 51% |
| State: | 46% |
Housing density: 1,742 houses/condos per square mile
Median price asked for vacant for-sale houses and condos in 2022: $205,403.
Median contract rent in 2022: $716 (lower quartile is $534, upper quartile is $923)
Median rent asked for vacant for-rent units in 2022: $562
Median gross rent in Utica, NY in 2022: $882
Housing units in Utica with a mortgage: 6,346 (546 second mortgage, 102 home equity loan, 443 both second mortgage and home equity loan)
Houses without a mortgage: 495
Median household income for houses/condos with a mortgage: $80,715
Median household income for apartments without a mortgage: $55,316
Median monthly housing costs: $881
Compare current foreclosures in Utica, NY:
| Photo | Address | Area | Beds / Baths | Price | Details |
|---|---|---|---|---|---|

|
#1
Reels Dr
Utica, NY 13502
|
925 sq. feet
|
1 baths 3 beds |
show details | |

|
#2
Sinclair Ave
Utica, NY 13502
|
1,728 sq. feet
|
1 baths 4 beds |
show details | |

|
#3
Downer Ave
Utica, NY 13502
|
1,547 sq. feet
|
2 baths 3 beds |
show details | |

|
#4
Arlington Ter
Utica, NY 13501
|
1,968 sq. feet
|
2 baths 4 beds |
show details | |

|
#5
Miller St
Utica, NY 13501
|
1,900 sq. feet
|
1 baths 3 beds |
show details | |

|
#6
Marnie St
Utica, NY 13502
|
1,485 sq. feet
|
1 baths 3 beds |
show details | |

|
#7
Saint Vincent St
Utica, NY 13501
|
1,527 sq. feet
|
1 baths 3 beds |
show details | |

|
#8
High St
Utica, NY 13501
|
1,864 sq. feet
|
2 baths 3 beds |
show details | |

|
#9
Shelly Pl
Utica, NY 13502
|
988 sq. feet
|
1 baths 3 beds |
show details | |

|
#10
Caroline St
Utica, NY 13502
|
2,470 sq. feet
|
2 baths 3 beds |
show details |
| Photo | Address | Area | Beds / Baths | Price | Details |
|---|---|---|---|---|---|

|
#11
Smith Hill Rd
Utica, NY 13502
|
1,080 sq. feet
|
1 baths 3 beds |
show details | |

|
#12
Elmhurst Rd
Utica, NY 13502
|
1,746 sq. feet
|
2 baths 3 beds |
show details | |

|
#13
Sherman Dr
Utica, NY 13501
|
1,534 sq. feet
|
1 baths 3 beds |
show details | |

|
#14
Rockhaven Rd
Utica, NY 13502
|
1,349 sq. feet
|
1 baths 4 beds |
show details | |

|
#15
Sinclair Ave
Utica, NY 13502
|
1,332 sq. feet
|
1 baths 3 beds |
show details | |

|
#16
Hedgewood Pl
Utica, NY 13502
|
1,152 sq. feet
|
1 baths 3 beds |
show details | |

|
#17
Mcvean St
Utica, NY 13502
|
1,760 sq. feet
|
1 baths 4 beds |
show details | |

|
#18
Floyd Ave
Utica, NY 13502
|
936 sq. feet
|
1 baths 3 beds |
show details | |

|
#19
Highland Ave
Utica, NY 13502
|
1,352 sq. feet
|
1 baths 4 beds |
show details | |

|
#20
Lynch Ave
Utica, NY 13502
|
1,869 sq. feet
|
2 baths 4 beds |
show details |
| Photo | Address | Area | Beds / Baths | Price | Details |
|---|---|---|---|---|---|

|
#21
Linda View Ln
Utica, NY 13502
|
1,066 sq. feet
|
1 baths 3 beds |
show details | |

|
#22
Brody Dr
Utica, NY 13502
|
912 sq. feet
|
1 baths 3 beds |
show details | |

|
#23
Lee Blvd
Utica, NY 13502
|
864 sq. feet
|
1 baths 3 beds |
show details | |

|
#24
Wilbain Dr W
Utica, NY 13502
|
1,376 sq. feet
|
1 baths 3 beds |
show details | |

|
#25
Rutger St
Utica, NY 13501
|
1,428 sq. feet
|
2 baths 4 beds |
show details | |

|
#26
Keyes Rd
Utica, NY 13502
|
1,200 sq. feet
|
1 baths 3 beds |
show details | |

|
#27
Tamarack St
Utica, NY 13502
|
1,400 sq. feet
|
1 baths 3 beds |
show details | |

|
#28
Amy Ave
Utica, NY 13502
|
2,600 sq. feet
|
3 baths 5 beds |
show details | |

|
#29
Van Rensselaer Rd
Utica, NY 13502
|
1,215 sq. feet
|
1 baths 3 beds |
show details | |

|
#30
Walker Rd
Utica, NY 13502
|
1,660 sq. feet
|
1 baths 3 beds |
show details |
| Photo | Address | Area | Beds / Baths | Price | Details |
|---|---|---|---|---|---|

|
#31
Van Roen Rd
Utica, NY 13502
|
1,376 sq. feet
|
2 baths 5 beds |
show details | |

|
#32
Herkimer Rd
Utica, NY 13502
|
1,220 sq. feet
|
1 baths 3 beds |
show details | |

|
#33
Mohawk St
Utica, NY 13501
|
1,440 sq. feet
|
1 baths 3 beds |
show details | |

|
#34
Lee Blvd
Utica, NY 13502
|
864 sq. feet
|
1 baths 3 beds |
show details | |

|
#35
Van Dyke Rd
Utica, NY 13502
|
1,206 sq. feet
|
1 baths 3 beds |
show details | |

|
#36
Pinnacle Dr
Utica, NY 13501
|
1,804 sq. feet
|
2 baths 4 beds |
show details | |

|
#37
Mathews Ave
Utica, NY 13502
|
1,848 sq. feet
|
2 baths 4 beds |
show details | |

|
#38
Burth Pl
Utica, NY 13502
|
1,380 sq. feet
|
1 baths 3 beds |
show details | |

|
#39
Woodburne Dr
Utica, NY 13502
|
1,475 sq. feet
|
1 baths 4 beds |
show details | |

|
#40
Mary St
Utica, NY 13501
|
2,096 sq. feet
|
2 baths 4 beds |
show details |
| Photo | Address | Area | Beds / Baths | Price | Details |
|---|---|---|---|---|---|

|
#41
Brookside Ave
Utica, NY 13501
|
1,392 sq. feet
|
1 baths 3 beds |
show details | |

|
#42
Sunnyside Dr
Utica, NY 13501
|
1,260 sq. feet
|
1 baths 3 beds |
show details | |

|
#43
Marnie St
Utica, NY 13502
|
1,685 sq. feet
|
1 baths 4 beds |
show details | |

|
#44
Northwood Dr
Utica, NY 13502
|
1,656 sq. feet
|
1 baths 4 beds |
show details | |

|
#45
Kenyon Ct
Utica, NY 13501
|
1,232 sq. feet
|
1 baths 3 beds |
show details | |

|
#46
Rose Pl
Utica, NY 13502
|
2,160 sq. feet
|
2 baths 4 beds |
show details | |

|
#47
Tabor Pl
Utica, NY 13502
|
792 sq. feet
|
1 baths 2 beds |
show details | |

|
#48
Ferris Ave
Utica, NY 13501
|
2,516 sq. feet
|
2 baths 5 beds |
show details | |

|
#49
Saint Agnes Ave
Utica, NY 13501
|
2,100 sq. feet
|
2 baths 3 beds |
show details | |

|
Check over 1 million property listings on Foreclosure.com!
|
browse all offers | |||

Latest news about housing in Utica, NY collected exclusively by city-data.com from local newspapers, TV, and radio stations


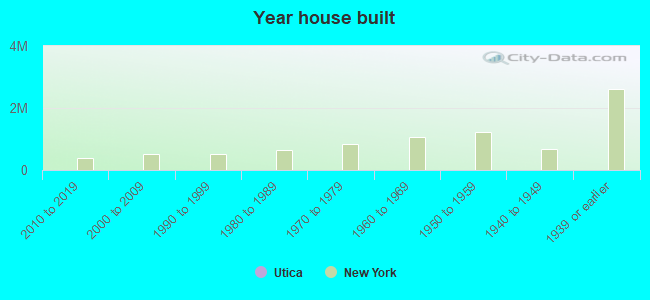
Median year apartment built: 1950
Household type by relationship:
Households: 64,109- Male householders: 11,908 (4,160 living alone), Female householders: 12,473 (4,082 living alone)
8,309 spouses (8,256 opposite-sex spouses), 2,331 unmarried partners, (2,172 opposite-sex unmarried partners), 20,434 children (19,847 natural, 386 adopted, 201 stepchildren), 1,765 grandchildren, 582 brothers or sisters, 976 parents, 57 foster children, 956 other relatives, 1,497 non-relatives
- In group quarters: 2,814
Size of family households: 5,579 2-persons, 3,580 3-persons, 2,796 4-persons, 1,997 5-persons, 490 6-persons, 831 7-or-more-persons.
Size of nonfamily households: 8,782 1-person, 1,635 2-persons, 126 3-persons, 184 4-persons, 55 5-persons.
7,644 married couples with children.
6,575 single-parent households (763 men, 5,812 women).
65.9% of residents of Utica speak English at home.
11.7% of residents speak Spanish at home (56% speak English very well, 31% speak English well, 9% speak English not well, 4% don't speak English at all).
9.8% of residents speak other Indo-European language at home (50% speak English very well, 18% speak English well, 26% speak English not well, 6% don't speak English at all).
8.2% of residents speak Asian or Pacific Island language at home (38% speak English very well, 30% speak English well, 20% speak English not well, 12% don't speak English at all).
4.1% of residents speak other language at home (63% speak English very well, 23% speak English well, 13% speak English not well, 1% don't speak English at all).
Foreign born population: 14,249 (22.2%)
(59.3% of them are naturalized citizens)
| Here: | 6.5 |
| State: | 6.3 |
| Here: | 4.8 |
| State: | 3.8 |
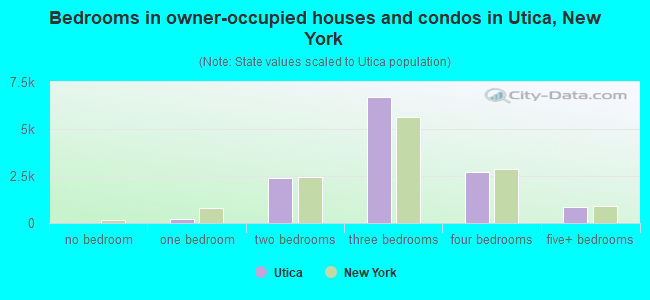
- Bedrooms in owner-occupied houses and condos in Utica, New York
- 19no bedroom
- 2381 bedroom
- 2,3732 bedrooms
- 6,7053 bedrooms
- 2,6934 bedrooms
- 8325+ bedrooms
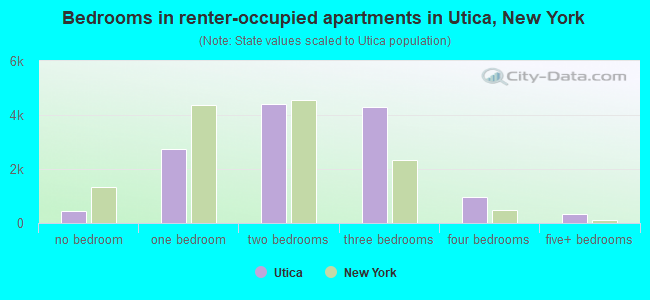
- Bedrooms in renter-occupied apartments in Utica, New York
- 443no bedroom
- 2,7261 bedroom
- 4,4002 bedrooms
- 4,3013 bedrooms
- 9584 bedrooms
- 3395+ bedrooms
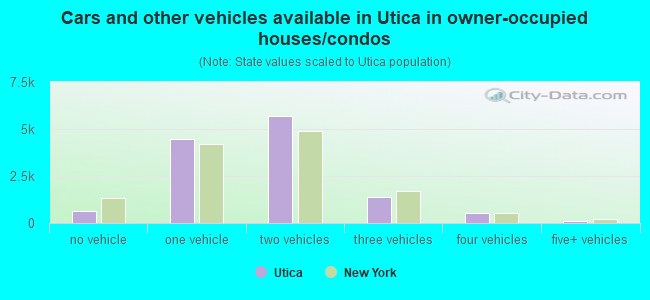
- Cars and other vehicles available in Utica in owner-occupied houses/condos
- 625no vehicle
- 4,4781 vehicle
- 5,7152 vehicles
- 1,3953 vehicles
- 5214 vehicles
- 1275+ vehicles
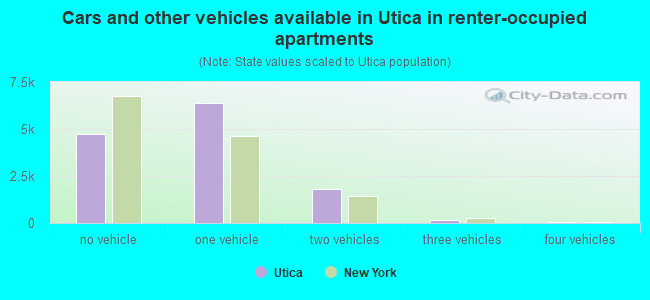
- Cars and other vehicles available in Utica in renter-occupied apartments
- 4,718no vehicle
- 6,3591 vehicle
- 1,8112 vehicles
- 1863 vehicles
- 594 vehicles
- 345+ vehicles
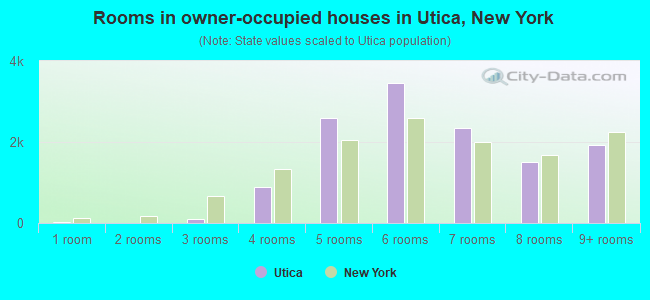
- Rooms in owner-occupied houses in Utica, New York
- 191 room
- 62 rooms
- 923 rooms
- 8924 rooms
- 2,5905 rooms
- 3,4696 rooms
- 2,3517 rooms
- 1,5118 rooms
- 1,9289+ rooms
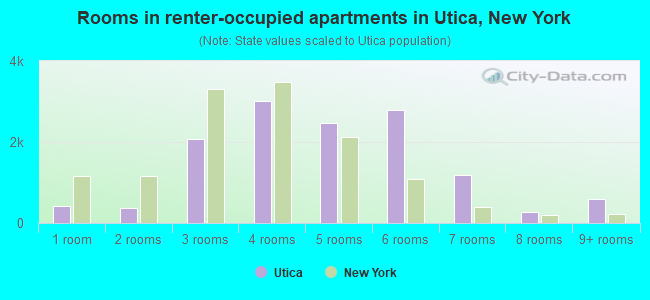
- Rooms in renter-occupied apartments in Utica, New York
- 4081 room
- 3592 rooms
- 2,0843 rooms
- 3,0204 rooms
- 2,4605 rooms
- 2,7886 rooms
- 1,1817 rooms
- 2698 rooms
- 5989+ rooms
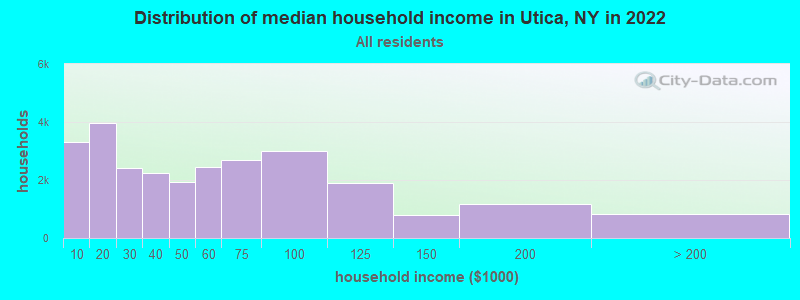
Utica, NY household income distribution

- 3,299Less than $10,000
- 3,973$10,000 to $19,999
- 2,409$20,000 to $29,999
- 2,249$30,000 to $39,999
- 1,915$40,000 to $49,999
- 2,458$50,000 to $59,999
- 2,699$60,000 to $74,999
- 2,989$75,000 to $99,999
- 1,890$100,000 to $124,999
- 789$125,000 to $149,999
- 1,179$150,000 to $199,999
- 826$200,000 or more
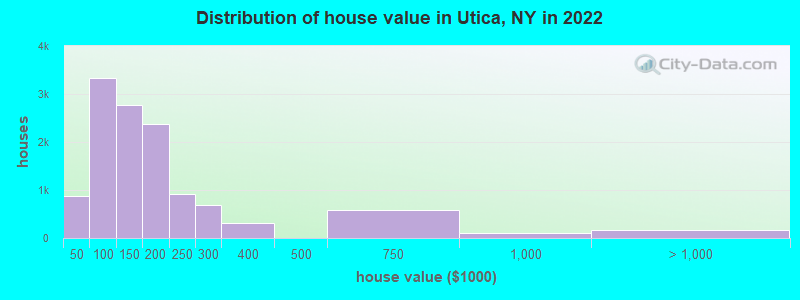
Home value of owner - occupied houses in 2022 in Utica, NY
-
- 119Less than $10,000
- 95$10,000 to $14,999
- 51$15,000 to $19,999
- 140$20,000 to $24,999
- 44$25,000 to $29,999
- 104$30,000 to $34,999
- 82$35,000 to $39,999
- 244$40,000 to $49,999
- 285$50,000 to $59,999
- 361$60,000 to $69,999
- 734$70,000 to $79,999
- 909$80,000 to $89,999
- 788$90,000 to $99,999
- 1,790$100,000 to $124,999
- 990$125,000 to $149,999
- 1,658$150,000 to $174,999
- 721$175,000 to $199,999
- 918$200,000 to $249,999
- 694$250,000 to $299,999
- 320$300,000 to $399,999
- 580$500,000 to $749,999
- 98$750,000 to $999,999
- 14$1,000,000 to $1,499,999
- 25$1,500,000 to $1,999,999
- 136$2,000,000 or more
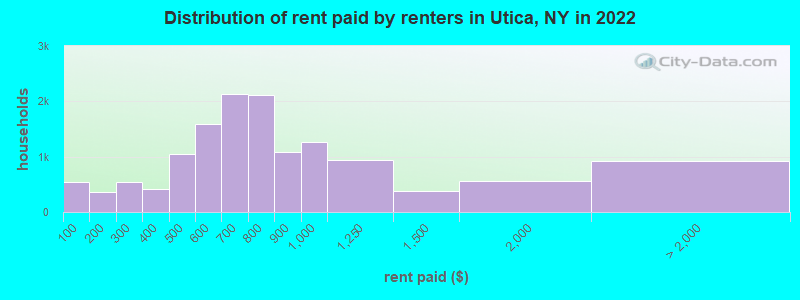
Rent paid by renters in 2022 in Utica, NY
-
- 540Less than $100
- 51$100 to $149
- 304$150 to $199
- 388$200 to $249
- 156$250 to $299
- 265$300 to $349
- 143$350 to $399
- 231$400 to $449
- 813$450 to $499
- 874$500 to $549
- 713$550 to $599
- 797$600 to $649
- 1,329$650 to $699
- 1,006$700 to $749
- 1,109$750 to $799
- 1,077$800 to $899
- 1,261$900 to $999
- 948$1,000 to $1,249
- 376$1,250 to $1,499
- 563$1,500 to $1,999
- 261$2,000 to $2,499
- 109$2,500 to $2,999
- 41$3,000 to $3,499
- 73$3,500 or more
- 439No cash rent
Percentage of workers working in this county: 90.1%
Number of people working at home: 2,356 (9.6% of all workers)
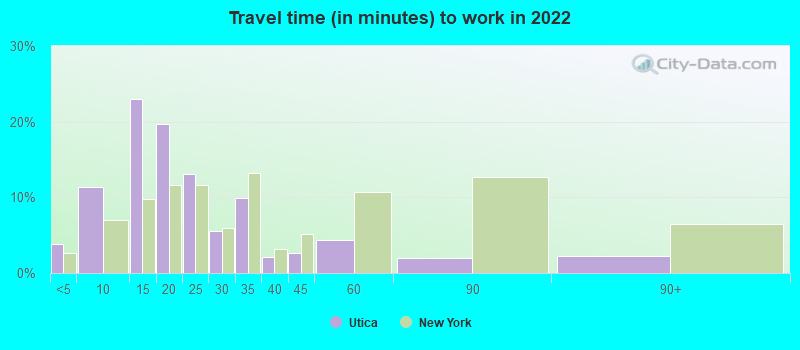
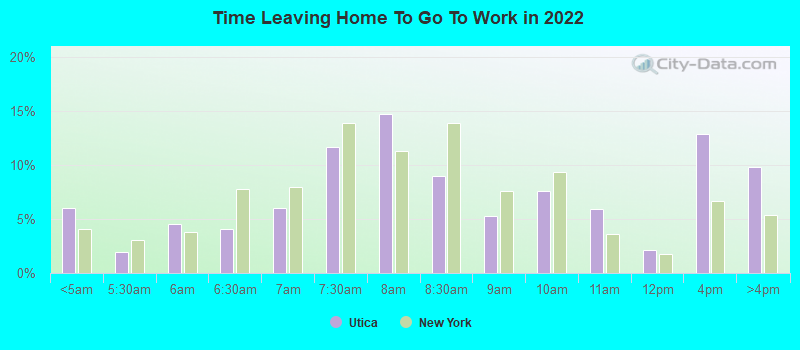
Travel time to work (commute)
- Less than 5 minutes: 1,079
- 5 to 9 minutes: 2,848
- 10 to 14 minutes: 5,570
- 15 to 19 minutes: 4,548
- 20 to 24 minutes: 2,321
- 25 to 29 minutes: 667
- 30 to 34 minutes: 1,874
- 35 to 39 minutes: 222
- 40 to 44 minutes: 814
- 45 to 59 minutes: 968
- 60 to 89 minutes: 602
- 90 or more minutes: 279
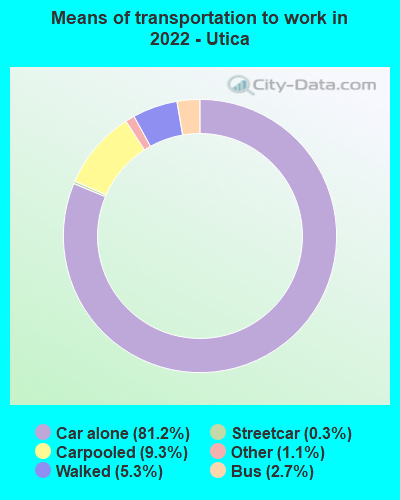
Means of transportation to work:
- Drove a car alone: 23,035 (75.6%)
- Carpooled: 2,160 (7.1%)
- Bus: 791 (2.6%)
- Subway or elevated rail: 83 (0.3%)
- Ferryboat: 11 (0.0%)
- Taxi: 270 (0.9%)
- Bicycle: 16 (0.1%)
- Walked: 1,274 (4.2%)
- Worked at home: 2,356 (7.7%)
- Unemployment by race in 2022
- Unemployment rate for White non-Hispanic residents
- 4.6%Males
- 3.4%Females
- Unemployment rate for Black residents
- 10.5%Males
- 13.1%Females
- Unemployment rate for American Indian and Alaska Native residents
- 5.2%Males
- Unemployment rate for Asian residents
- 2.8%Males
- 2.6%Females
- Unemployment rate for other race residents
- 5.1%Males
- 6.4%Females
- Unemployment rate for two or more race residents
- 7.2%Males
- 8.1%Females
- Unemployment rate for Hispanic or Latino residents
- 7.4%Males
- 4.6%Females
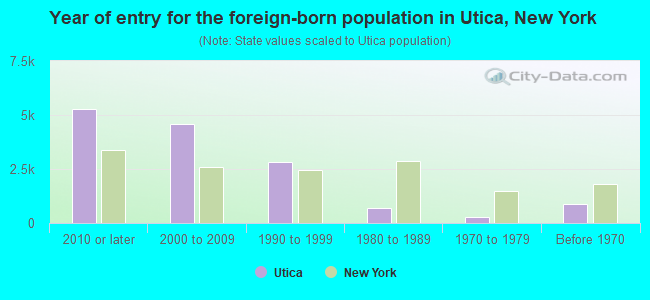
- Year of entry for the foreign-born population in Utica, New York
- 5,2632010 or later
- 4,6062000 to 2009
- 2,8221990 to 1999
- 6911980 to 1989
- 2661970 to 1979
- 872Before 1970
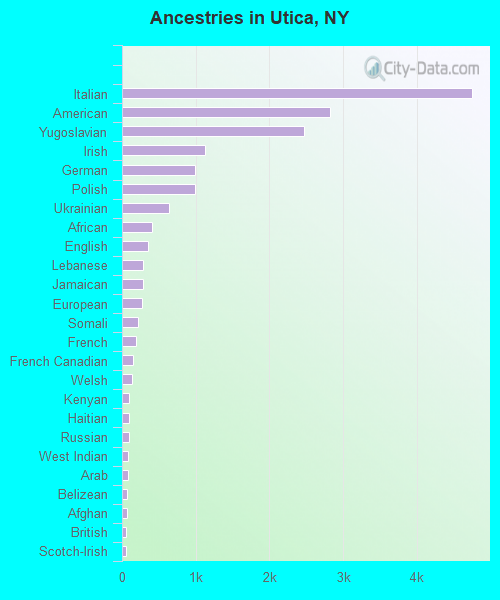
First ancestries reported:
- Italian: 4,743 (13.0%)
- American: 2,827 (7.8%)
- Yugoslavian: 2,467 (6.8%)
- Irish: 1,126 (3.1%)
- German: 994 (2.7%)
- Polish: 987 (2.7%)
- Ukrainian: 641 (1.8%)
- African: 413 (1.1%)
- English: 357 (1.0%)
- Lebanese: 286 (0.8%)
- Jamaican: 279 (0.8%)
- European: 267 (0.7%)
- Somali: 211 (0.6%)
- French: 186 (0.5%)
- French Canadian: 149 (0.4%)
- Welsh: 139 (0.4%)
- Kenyan: 99 (0.3%)
- Haitian: 99 (0.3%)
- Russian: 96 (0.3%)
- West Indian: 85 (0.2%)
- Arab: 83 (0.2%)
- Belizean: 66 (0.2%)
- Afghan: 63 (0.2%)
- British: 58 (0.2%)
- Scotch-Irish: 58 (0.2%)
- Dutch: 42 (0.1%)
- Scottish: 39 (0.1%)
- Croatian: 36 (0.10%)
- Barbadian: 35 (0.10%)
- Portuguese: 33 (0.09%)
- Norwegian: 32 (0.09%)
- Lithuanian: 29 (0.08%)
- Guyanese: 29 (0.08%)
- Swedish: 29 (0.08%)
- Syrian: 28 (0.08%)
- Slavic: 27 (0.07%)
- Trinidadian and Tobagonian: 26 (0.07%)
- Eastern European: 25 (0.07%)
- Pennsylvania German: 25 (0.07%)
- Sudanese: 22 (0.06%)
- Northern European: 21 (0.06%)
- Cajun: 21 (0.06%)
- Hungarian: 15 (0.04%)
- Ethiopian: 14 (0.04%)
- Romanian: 14 (0.04%)
- Iranian: 13 (0.04%)
- Turkish: 10 (0.03%)
- Serbian: 8 (0.02%)
- Scandinavian: 4 (0.01%)
- Ghanaian: 2 (0.01%)
Most common places of birth for foreign-born residents (%):
| Utica: | 15.6% (2,217) |
| New York: | 0.2% (9,472) |
| Utica: | 14.2% (2,021) |
| New York: | 0.4% (16,179) |
| Utica: | 8.9% (1,261) |
| New York: | 0.3% (14,037) |
| Utica: | 8.7% (1,233) |
| New York: | 11.1% (501,040) |
| Utica: | 4.5% (638) |
| New York: | 0.6% (25,517) |
| Utica: | 3.5% (496) |
| New York: | 0.1% (3,044) |
| Utica: | 3.2% (460) |
| New York: | 0.3% (14,772) |
| Utica: | 2.5% (359) |
| New York: | 0.4% (17,813) |
| Utica: | 2.3% (321) |
| New York: | 5.0% (227,557) |
| Utica: | 2.2% (317) |
| New York: | 1.7% (78,421) |
| Utica: | 2.1% (292) |
| New York: | 0.1% (3,340) |
| Utica: | 1.8% (259) |
| New York: | 0.1% (6,042) |
| Utica: | 1.8% (258) |
| New York: | 0.4% (19,133) |
| Utica: | 1.6% (223) |
| New York: | 9.1% (410,910) |
| Utica: | 1.5% (218) |
| New York: | 0.7% (30,173) |
Place of birth for U.S.-born residents:
- This state: 41,795
- Other state: 5,736
- Northeast: 1,805
- Midwest: 917
- South: 1,980
- West: 996
83.3% of Utica residents lived in the same house 1 years ago.
Out of people who lived in different houses, 39.3% lived in this county.
Out of people who lived in different counties, 86.0% lived in New York.
| Utica: | 83.3% |
| State average: | 89.6% |
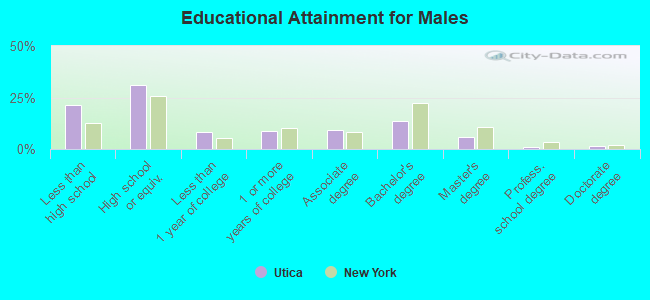
Education attainment for males 25 years and older:
- No schooling: 1,156
- Nursery to 4th grade: 296
- 5th and 6th grade: 77
- 7th and 8th grade: 455
- 9th grade: 262
- 10th grade: 573
- 11th grade: 314
- 12th grade, no diploma: 974
- High school graduate (or equivalency): 5,986
- Less than 1 year of college: 1,576
- Some college more than 1 year, no degree: 1,717
- Associate degree: 1,823
- Bachelor's degree: 2,610
- Master's degree: 1,107
- Professional school degree: 218
- Doctorate degree: 272
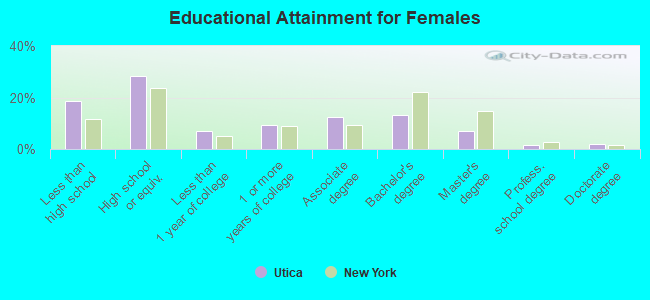
Education attainment for females 25 years and older:
- No schooling: 1,439
- Nursery to 4th grade: 538
- 5th and 6th grade: 289
- 7th and 8th grade: 487
- 9th grade: 179
- 10th grade: 180
- 11th grade: 438
- 12th grade, no diploma: 373
- High school graduate (or equivalency): 5,977
- Less than 1 year of college: 1,501
- Some college more than 1 year, no degree: 1,984
- Associate degree: 2,640
- Bachelor's degree: 2,800
- Master's degree: 1,497
- Professional school degree: 302
- Doctorate degree: 371
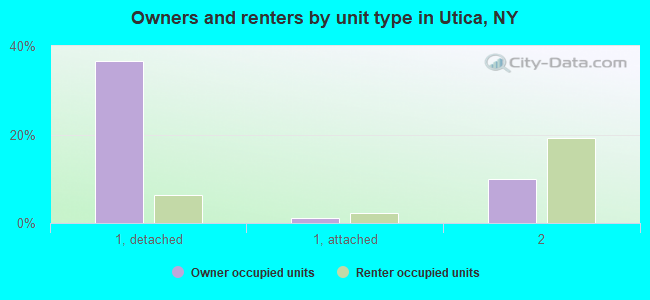
Housing units in structures:
- One, detached: 12,109
- One, attached: 952
- Two: 7,365
- 3 or 4: 3,000
- 5 to 9: 1,480
- 10 to 19: 730
- 20 to 49: 654
- 50 or more: 1,997
- Mobile homes: 181
Housing units lacking complete kitchen facilities in 2022: 2.6%
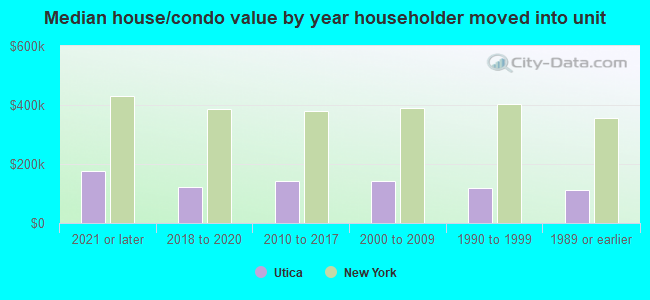
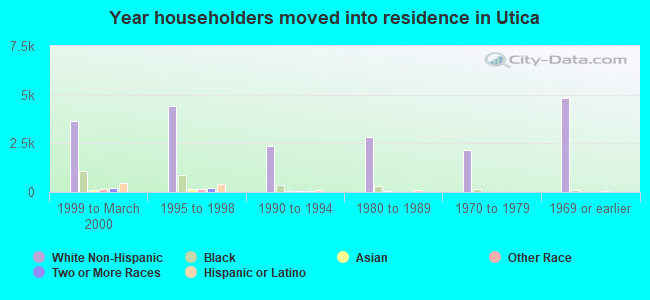
House/condo owner moved in on average 14 years ago
Renter moved in on average 3 years ago
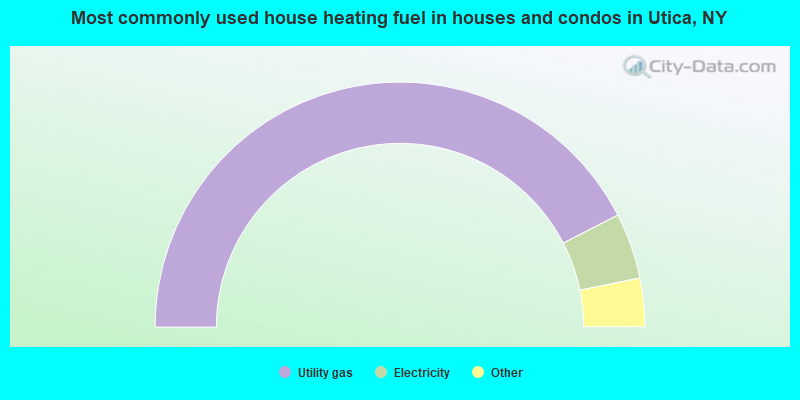
- 84.9%Utility gas
- 8.7%Electricity
- 2.7%Fuel oil, kerosene, etc.
- 2.3%Bottled, tank, or LP gas
- 0.5%Wood
- 0.3%No fuel used
- 0.3%Coal or coke
- 0.2%Other fuel
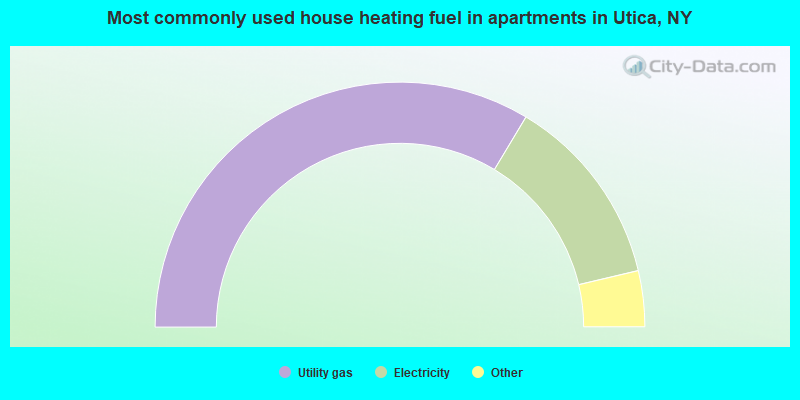
- 67.2%Utility gas
- 25.4%Electricity
- 3.2%Bottled, tank, or LP gas
- 2.4%Fuel oil, kerosene, etc.
- 0.8%Other fuel
- 0.7%No fuel used
- 0.2%Solar energy
- 0.2%Wood
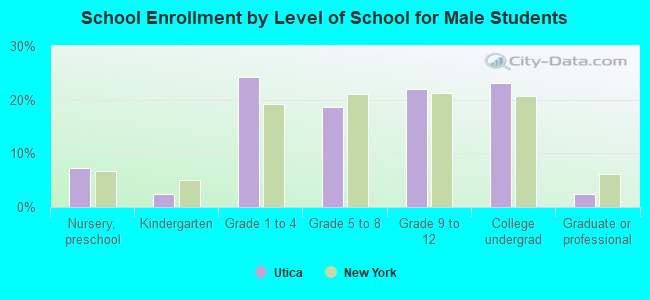
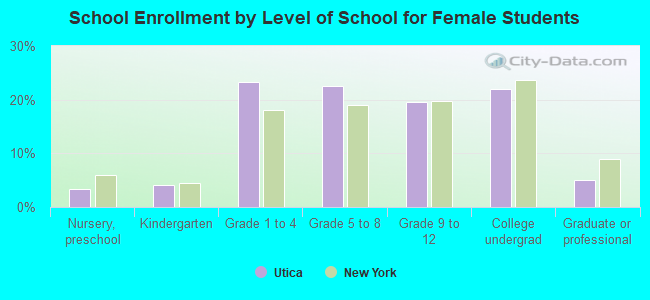
Private vs. public school enrollment:
| Here: | 3.9% |
| New York: | 15.6% |
| Here: | 13.2% |
| New York: | 15.0% |
| Here: | 36.4% |
| New York: | 39.2% |