Utopia, FL (Florida) Houses and Residents
| Utopia: | $136,172 |
| Florida: | $354,100 |
Total population: 805 (Urban population: 725, Rural population: 0)
Houses: 259 (238 occupied: 52 owner occupied, 186 renter occupied)
| % of renters here: | 78% |
| State: | 33% |
Housing density: 844 houses/condos per square mile
Median price asked for vacant for-sale houses and condos in 2022 in this county: $336,527.
Median contract rent in 2022: $1,412 (lower quartile is $1,049, upper quartile is $1,624)
Median gross rent in Utopia, FL in 2022: $1,559
Housing units in Utopia with a mortgage: 20 (0 second mortgage, 0 home equity loan, 0 both second mortgage and home equity loan)
Houses without a mortgage: 0


Latest news about housing in Utopia, FL collected exclusively by city-data.com from local newspapers, TV, and radio stations


Household type by relationship:
Households: 373,826- In family households: 290,242 (78,274 male householders, 28,678 female householders)
85,735 spouses, 73,525 children (67,604 natural, 2,015 adopted, 3,906 stepchildren), 5,586 grandchildren, 2,635 brothers or sisters, 3,125 parents, foster children, 3,176 other relatives, 7,552 non-relatives
- In nonfamily households: 83,584 (28,398 male householders (21,399 living alone)), 40,396 female householders (34,995 living alone)), 14,790 nonrelatives
- In group quarters: 5,622 (3,442 institutionalized population)
34,851 married couples with children.
12,998 single-parent households (2,905 men, 10,093 women).
77.8% of residents of Utopia speak English at home.
20.7% of residents speak Spanish at home (44% speak English very well, 4% speak English well, 34% speak English not well, 18% don't speak English at all).
1.5% of residents speak other Indo-European language at home (100% speak English well).
Foreign born population: 474 (46.1%)
(82.1% of them are naturalized citizens)
| Here: | 4.6 |
| State: | 5.9 |
| Here: | 3.2 |
| State: | 4.2 |

- Bedrooms in owner-occupied houses and condos in Utopia, Florida
- 0no bedroom
- 221 bedroom
- 162 bedrooms
- 83 bedrooms
- 04 bedrooms
- 65+ bedrooms

- Bedrooms in renter-occupied apartments in Utopia, Florida
- 18no bedroom
- 581 bedroom
- 912 bedrooms
- 193 bedrooms
- 04 bedrooms
- 05+ bedrooms

- Cars and other vehicles available in Utopia in owner-occupied houses/condos
- 16no vehicle
- 151 vehicle
- 172 vehicles
- 03 vehicles
- 44 vehicles
- 05+ vehicles

- Cars and other vehicles available in Utopia in renter-occupied apartments
- 63no vehicle
- 921 vehicle
- 222 vehicles
- 93 vehicles
- 04 vehicles
- 05+ vehicles

- Rooms in owner-occupied houses in Utopia, Florida
- 01 room
- 162 rooms
- 63 rooms
- 04 rooms
- 155 rooms
- 96 rooms
- 07 rooms
- 08 rooms
- 69+ rooms
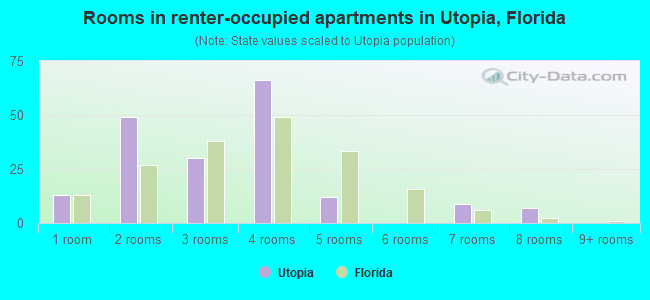
- Rooms in renter-occupied apartments in Utopia, Florida
- 131 room
- 492 rooms
- 303 rooms
- 664 rooms
- 125 rooms
- 06 rooms
- 97 rooms
- 78 rooms
- 09+ rooms


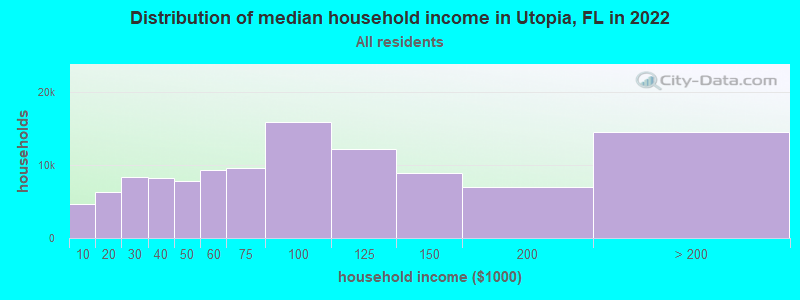
Utopia, FL household income distribution

- 4,680Less than $10,000
- 6,278$10,000 to $19,999
- 8,300$20,000 to $29,999
- 8,211$30,000 to $39,999
- 7,855$40,000 to $49,999
- 9,312$50,000 to $59,999
- 9,629$60,000 to $74,999
- 15,873$75,000 to $99,999
- 12,204$100,000 to $124,999
- 8,935$125,000 to $149,999
- 7,006$150,000 to $199,999
- 14,517$200,000 or more
Percentage of workers working in this county: 90.3%
Number of people working at home: 63 (18.5% of all workers)
Travel time to work (commute)
- Less than 5 minutes: 0
- 5 to 9 minutes: 18
- 10 to 14 minutes: 17
- 15 to 19 minutes: 83
- 20 to 24 minutes: 17
- 25 to 29 minutes: 16
- 30 to 34 minutes: 56
- 35 to 39 minutes: 19
- 40 to 44 minutes: 0
- 45 to 59 minutes: 15
- 60 to 89 minutes: 0
- 90 or more minutes: 0
Means of transportation to work:
- Drove a car alone: 189 (78.4%)
- Carpooled: 14 (5.8%)
- Bus or trolley bus: 32 (13.3%)
- Walked: 6 (2.5%)

- Year of entry for the foreign-born population in Utopia, Florida
- 441995 to March 2000
- 611990 to 1994
- 571985 to 1989
- 361980 to 1984
- 301975 to 1979
- 01970 to 1974
- 01965 to 1969
- 0Before 1965

First ancestries reported:
- Other: 478 (68.4%)
- West Indian: 148 (21.2%)
- United States: 59 (8.4%)
- English: 8 (1.1%)
- French: 6 (0.9%)
Most common places of birth for foreign-born residents (%):
| Utopia: | 41.7% (95) |
| Florida: | 5.3% (141,182) |
| Utopia: | 20.2% (46) |
| Florida: | 24.1% (642,951) |
| Utopia: | 12.7% (29) |
| Florida: | 1.4% (38,484) |
| Utopia: | 11.8% (27) |
| Florida: | 5.9% (157,371) |
| Utopia: | 5.7% (13) |
| Florida: | 0.5% (13,152) |
| Utopia: | 5.3% (12) |
| Florida: | 2.5% (66,690) |
| Utopia: | 2.6% (6) |
| Florida: | 1.1% (28,788) |
Place of birth for U.S.-born residents:
- This state: 393
- Other state: 80
- Northeast: 28
- Midwest: 22
- South: 30
- West: 0
49% of Utopia residents lived in the same house 5 years ago.
Out of people who lived in different houses, 67% lived in this county.
Out of people who lived in different counties, 64% lived in Florida.
Education attainment for males 25 years and older:
- No schooling: 5
- Nursery to 4th grade: 0
- 5th and 6th grade: 6
- 7th and 8th grade: 0
- 9th grade: 10
- 10th grade: 0
- 11th grade: 33
- 12th grade, no diploma: 35
- High school graduate (or equivalency): 64
- Less than 1 year of college: 0
- Some college more than 1 year, no degree: 14
- Associate degree: 15
- Bachelor's degree: 20
- Master's degree: 0
- Professional school degree: 0
- Doctorate degree: 0

Education attainment for females 25 years and older:
- No schooling: 12
- Nursery to 4th grade: 9
- 5th and 6th grade: 0
- 7th and 8th grade: 12
- 9th grade: 0
- 10th grade: 12
- 11th grade: 9
- 12th grade, no diploma: 19
- High school graduate (or equivalency): 93
- Less than 1 year of college: 0
- Some college more than 1 year, no degree: 28
- Associate degree: 5
- Bachelor's degree: 0
- Master's degree: 0
- Professional school degree: 0
- Doctorate degree: 0


Housing units in structures:
- One, detached: 60
- One, attached: 9
- Two: 89
- 3 or 4: 42
- 10 to 19: 13
- Mobile homes: 46
Median worth of mobile homes: $55,821

Private vs. public school enrollment:
| Here: | 0.0% |
| Florida: | 11.7% |
| Here: | 0.0% |
| Florida: | 9.7% |
| Here: | 72.0% |
| Florida: | 21.0% |


