Housing density: 1,307 houses/condos per square mile
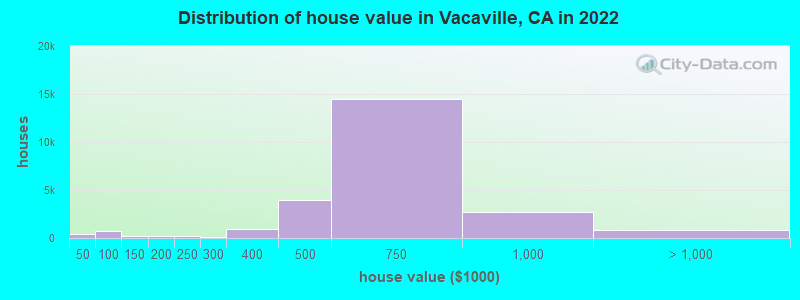
Median price asked for vacant for-sale houses and condos in 2022: $383,086.
Median contract rent in 2022: $1,983 (lower quartile is $1,454, upper quartile is over $2,000)
Median rent asked for vacant for-rent units in 2022: $2,430
Median gross rent in Vacaville, CA in 2022: over $2,000
Housing units in Vacaville with a mortgage: 17,146 (1,401 second mortgage, 47 home equity loan, 1,225 both second mortgage and home equity loan) Houses without a mortgage: 124
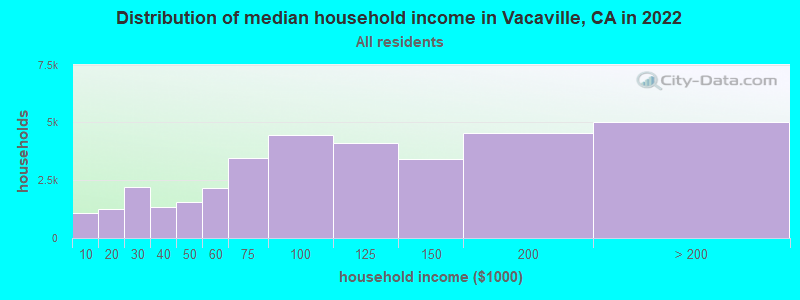
Median household income for houses/condos with a mortgage: $129,902
Median household income for apartments without a mortgage: $72,973
15,918 married couples with children.
3,780 single-parent households (617 men, 3,163 women).
77.2% of residents of Vacaville speak English at home.
13.2% of residents speak Spanish at home (65% speak English very well, 19% speak English well, 13% speak English not well, 3% don't speak English at all).
2.4% of residents speak other Indo-European language at home (69% speak English very well, 20% speak English well, 11% speak English not well).
5.5% of residents speak Asian or Pacific Island language at home (59% speak English very well, 30% speak English well, 9% speak English not well, 3% don't speak English at all).
0.3% of residents speak other language at home (48% speak English very well, 44% speak English well, 8% speak English not well).
Foreign born population: 11,314 (11.1%)
(68.1% of them are naturalized citizens)
Percentage of workers working in this county: 74.6% Number of people working at home: 5,942 (13.3% of all workers)
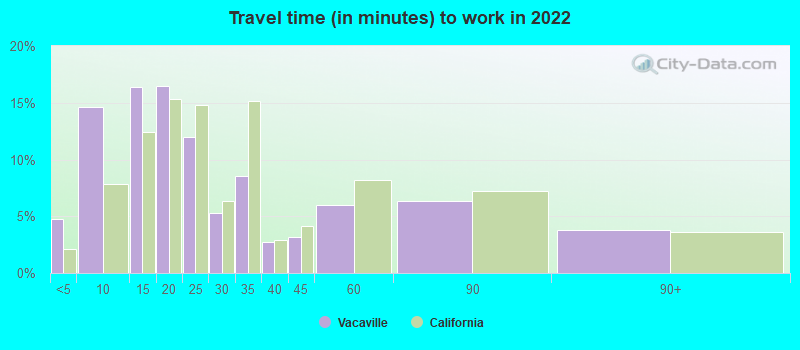
Travel time to work (commute)
Less than 5 minutes: 1,859
5 to 9 minutes: 4,924
10 to 14 minutes: 5,706
15 to 19 minutes: 5,512
20 to 24 minutes: 4,241
25 to 29 minutes: 1,282
30 to 34 minutes: 2,850
35 to 39 minutes: 1,599
40 to 44 minutes: 1,551
45 to 59 minutes: 3,865
60 to 89 minutes: 3,114
90 or more minutes: 1,936
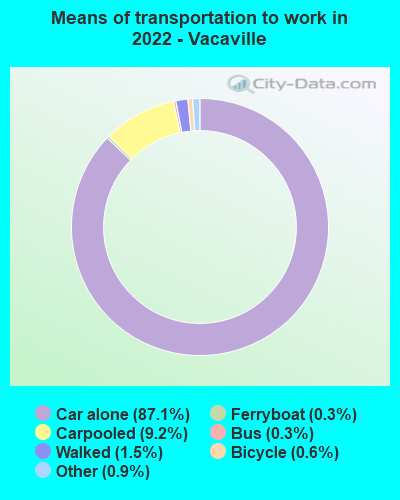
Means of transportation to work:
Drove a car alone: 29,571 (72.8%)
Carpooled: 3,723 (9.2%)
Bus: 93 (0.2%)
Subway or elevated rail: 7 (0.0%)
Light rail, streetcar or trolley: 12 (0.0%)
Ferryboat: 115 (0.3%)
Taxi: 286 (0.7%)
Bicycle: 239 (0.6%)
Walked: 457 (1.1%)
Worked at home: 5,942 (14.6%)
Unemployment by race in 2022
Unemployment rate for White non-Hispanic residents
4.1%Males
1.6%Females
Unemployment rate for Black residents
1.9%Males
3.1%Females
Unemployment rate for Asian residents
6.2%Males
Unemployment rate for other race residents
16.2%Males
25.0%Females
Unemployment rate for two or more race residents
20.2%Males
21.3%Females
Unemployment rate for Hispanic or Latino residents
19.5%Males
14.5%Females
Year of entry for the foreign-born population in Vacaville, California
2,7132010 or later
2,6022000 to 2009
2,3451990 to 1999
2,0871980 to 1989
1,4211970 to 1979
1,968Before 1970
First ancestries reported:
European: 10,468 (18.6%)
Italian: 1,837 (3.3%)
Irish: 1,712 (3.0%)
German: 1,674 (3.0%)
English: 1,543 (2.7%)
American: 1,477 (2.6%)
African: 1,221 (2.2%)
Norwegian: 528 (0.9%)
Portuguese: 396 (0.7%)
French: 274 (0.5%)
Greek: 248 (0.4%)
Scottish: 216 (0.4%)
Scotch-Irish: 199 (0.4%)
Polish: 164 (0.3%)
British: 155 (0.3%)
Dutch: 150 (0.3%)
Welsh: 125 (0.2%)
Danish: 124 (0.2%)
Swedish: 119 (0.2%)
French Canadian: 114 (0.2%)
Scandinavian: 99 (0.2%)
Nigerian: 91 (0.2%)
Jamaican: 88 (0.2%)
Canadian: 69 (0.1%)
Jordanian: 64 (0.1%)
Northern European: 64 (0.1%)
Egyptian: 59 (0.1%)
Lithuanian: 58 (0.1%)
Liberian: 58 (0.1%)
Ukrainian: 56 (0.10%)
Afghan: 48 (0.09%)
Iranian: 46 (0.08%)
Belizean: 46 (0.08%)
Croatian: 43 (0.08%)
Macedonian: 36 (0.06%)
Eastern European: 33 (0.06%)
Romanian: 32 (0.06%)
Hungarian: 31 (0.06%)
Czech: 30 (0.05%)
Serbian: 30 (0.05%)
Finnish: 29 (0.05%)
Russian: 28 (0.05%)
Pennsylvania German: 26 (0.05%)
Yugoslavian: 22 (0.04%)
Austrian: 21 (0.04%)
Ethiopian: 19 (0.03%)
Slovak: 17 (0.03%)
South African: 17 (0.03%)
Guyanese: 16 (0.03%)
Haitian: 16 (0.03%)
Arab: 15 (0.03%)
Cajun: 15 (0.03%)
Armenian: 12 (0.02%)
Celtic: 8 (0.01%)
Swiss: 8 (0.01%)
Lebanese: 6 (0.01%)
Palestinian: 6 (0.01%)
Moroccan: 6 (0.01%)
Czechoslovakian: 5 (0.01%)
Most common places of birth for foreign-born residents (%):
Mexico
Vacaville:
28.7% (3,436)
California:
37.2% (3,881,193)
Philippines
Vacaville:
18.6% (2,228)
California:
7.8% (818,297)
India
Vacaville:
5.7% (685)
California:
5.2% (539,184)
China, excluding Hong Kong and Taiwan
Vacaville:
4.6% (553)
California:
6.6% (684,672)
Japan
Vacaville:
4.0% (476)
California:
1.0% (103,575)
Cuba
Vacaville:
2.4% (289)
California:
0.3% (30,441)
Korea
Vacaville:
2.3% (279)
California:
3.0% (315,248)
Guatemala
Vacaville:
2.2% (261)
California:
2.8% (290,436)
Vietnam
Vacaville:
1.9% (233)
California:
4.9% (512,335)
Canada
Vacaville:
1.8% (214)
California:
1.2% (127,477)
Taiwan
Vacaville:
1.8% (212)
California:
1.7% (176,274)
El Salvador
Vacaville:
1.6% (192)
California:
4.2% (440,287)
Place of birth for U.S.-born residents:
This state: 67,532
Other state: 20,719
Northeast: 4,661
Midwest: 5,239
South: 5,800
West: 5,019
88.5% of Vacaville residents lived in the same house 1 years ago. Out of people who lived in different houses, 37.4% lived in this county. Out of people who lived in different counties, 80.9% lived in California.
Vacaville:
88.5%
State average:
88.9%
Education attainment for males 25 years and older:
No schooling: 100
Nursery to 4th grade: 66
5th and 6th grade: 147
7th and 8th grade: 236
9th grade: 439
10th grade: 495
11th grade: 963
12th grade, no diploma: 611
High school graduate (or equivalency): 9,523
Less than 1 year of college: 3,384
Some college more than 1 year, no degree: 7,215
Associate degree: 4,283
Bachelor's degree: 6,929
Master's degree: 1,760
Professional school degree: 461
Doctorate degree: 284
Education attainment for females 25 years and older:
No schooling: 306
Nursery to 4th grade: 0
5th and 6th grade: 52
7th and 8th grade: 122
9th grade: 266
10th grade: 436
11th grade: 170
12th grade, no diploma: 564
High school graduate (or equivalency): 7,506
Less than 1 year of college: 2,699
Some college more than 1 year, no degree: 6,117
Associate degree: 5,491
Bachelor's degree: 7,665
Master's degree: 1,896
Professional school degree: 761
Doctorate degree: 111
Housing units in structures:
One, detached: 25,834
One, attached: 826
Two: 872
3 or 4: 973
5 to 9: 1,043
10 to 19: 2,284
20 to 49: 32
50 or more: 2,403
Mobile homes: 1,131
Median worth of mobile homes: $110,346
Housing units lacking complete plumbing facilities in 2022: 0.2%
Housing units lacking complete kitchen facilities in 2022: 1.0%
House/condo owner moved in on average 12 years ago