Val Verde, CA (California) Houses and Residents
| Val Verde: | $514,915 |
| California: | $715,900 |
Mean price in 2022:
Detached houses: $753,183
Here: $753,183 State: $988,808 Mobile homes: $280,840
Here: $280,840 State: $184,506
Total population: 2,468 (Urban population: 1,587 (all inside urban clusters), Rural population: 0)
Houses: 926 (886 occupied: 765 owner occupied, 123 renter occupied)
| % of renters here: | 14% |
| State: | 44% |
Housing density: 2,786 houses/condos per square mile
Median price asked for vacant for-sale houses and condos in 2022 in this county: $1,291,802.
Median contract rent in 2022: $1,376 (lower quartile is $1,247, upper quartile is $1,488)
Median gross rent in Val Verde, CA in 2022: $1,728
Housing units in Val Verde with a mortgage: 562 (18 second mortgage, 0 home equity loan, 10 both second mortgage and home equity loan)
Houses without a mortgage: 6
Median household income for houses/condos with a mortgage: $119,284
Median household income for apartments without a mortgage: $93,647
Median monthly housing costs: $1,856
Compare current foreclosures near Val Verde, CA:
| Photo | Address | Area | Beds / Baths | Price | Details |
|---|---|---|---|---|---|

|
#1
Campus Park Dr Apt A
Moorpark, CA 93021
|
1,029 sq. feet
|
2 baths 2 beds |
show details | |

|
#2
Doss Ct
Granada Hills, CA 91344
|
2,493 sq. feet
|
3 baths 5 beds |
show details | |

|
#3
Alamo St Unit 1
Simi Valley, CA 93063
|
531 sq. feet
|
1 baths 1 beds |
show details | |

|
#4
Hacienda Ranch Ct
Valencia, CA 91354
|
4,005 sq. feet
|
5 baths 5 beds |
show details | |

|
#5
Louise Ave
Granada Hills, CA 91344
|
3,407 sq. feet
|
3 baths 4 beds |
show details | |

|
#6
Bergstrom Pl
Sylmar, CA 91342
|
2,269 sq. feet
|
3 baths 4 beds |
show details | |

|
#7
Wolfe Cir
Stevenson Ranch, CA 91381
|
2,363 sq. feet
|
3 baths 4 beds |
show details | |

|
#8
Francisco Way
Valencia, CA 91354
|
3,152 sq. feet
|
3 baths 5 beds |
show details | |

|
#9
Harmony Way
Santa Clarita, CA 91390
|
3,354 sq. feet
|
3 baths 4 beds |
show details | |

|
#10
Citronia St
North Hills, CA 91343
|
1,408 sq. feet
|
2 baths 2 beds |
show details |
| Photo | Address | Area | Beds / Baths | Price | Details |
|---|---|---|---|---|---|

|
#11
Coulter Ct
Simi Valley, CA 93065
|
1,596 sq. feet
|
2 baths 5 beds |
show details | |

|
#12
Loire Valley Dr
Simi Valley, CA 93065
|
5,100 sq. feet
|
5 baths 4 beds |
show details | |

|
#13
Hammond Ct
Valencia, CA 91354
|
2,071 sq. feet
|
3 baths 4 beds |
show details | |

|
#14
Rex St
Sylmar, CA 91342
|
2,405 sq. feet
|
4 baths 5 beds |
show details | |

|
#15
Roosevelt Ct
Simi Valley, CA 93065
|
3,691 sq. feet
|
3 baths 4 beds |
show details | |

|
#16
Sycamore Dr
Santa Clarita, CA 91350
|
1,867 sq. feet
|
3 baths 4 beds |
show details | |

|
#17
Susan Beth Way Unit C
Santa Clarita, CA 91350
|
- sq. feet
|
1 baths 2 beds |
show details | |

|
#18
Lenope Pl
Chatsworth, CA 91311
|
5,307 sq. feet
|
6 baths 5 beds |
show details | |

|
#19
Newcastle Ave
Granada Hills, CA 91344
|
3,450 sq. feet
|
5 baths 4 beds |
show details | |

|
#20
Vicky Ave
Canoga Park, CA 91304
|
1,639 sq. feet
|
3 baths 4 beds |
show details |
| Photo | Address | Area | Beds / Baths | Price | Details |
|---|---|---|---|---|---|

|
#21
Laramie Ave
Chatsworth, CA 91311
|
1,479 sq. feet
|
2 baths 4 beds |
show details | |

|
#22
Prairie St
Northridge, CA 91325
|
5,375 sq. feet
|
5 baths 5 beds |
show details | |

|
#23
Kilfinan St
Northridge, CA 91326
|
2,814 sq. feet
|
3 baths 4 beds |
show details | |

|
#24
Cherry Ridge Drive
Newhall, CA 91321
|
2,547 sq. feet
|
3 baths 4 beds |
show details | |

|
#25
Sundowner Way
Canyon Country, CA 91387
|
844 sq. feet
|
2 baths 3 beds |
show details | |

|
#26
Simonds St
Granada Hills, CA 91344
|
1,782 sq. feet
|
2 baths 3 beds |
show details | |

|
#27
Rinaldi St
Granada Hills, CA 91344
|
1,774 sq. feet
|
2 baths 4 beds |
show details | |

|
#28
Borden Ave
Sylmar, CA 91342
|
1,080 sq. feet
|
2 baths 3 beds |
show details | |

|
#29
Birchwood Ct
Sylmar, CA 91342
|
2,277 sq. feet
|
3 baths 4 beds |
show details | |

|
#30
Foothill Blvd Unit 28
Sylmar, CA 91342
|
1,233 sq. feet
|
2 baths 3 beds |
show details |
| Photo | Address | Area | Beds / Baths | Price | Details |
|---|---|---|---|---|---|

|
#31
Cherry St
Newhall, CA 91321
|
2,352 sq. feet
|
3 baths 4 beds |
show details | |

|
#32
Shoshone Ave
Northridge, CA 91325
|
2,687 sq. feet
|
3 baths 4 beds |
show details | |

|
#33
Des Moines Ave
Northridge, CA 91326
|
2,501 sq. feet
|
3 baths 5 beds |
show details | |

|
#34
Covello St
West Hills, CA 91307
|
2,504 sq. feet
|
3 baths 5 beds |
show details | |

|
#35
Dearborn St
Northridge, CA 91325
|
3,024 sq. feet
|
4 baths 5 beds |
show details | |

|
#36
Violet Hills Dr
Canyon Country, CA 91387
|
1,322 sq. feet
|
2 baths 4 beds |
show details | |

|
#37
Quartz Ln
Castaic, CA 91384
|
1,536 sq. feet
|
2 baths 3 beds |
show details | |

|
#38
Church St
Simi Valley, CA 93065
|
1,303 sq. feet
|
2 baths 3 beds |
show details | |

|
#39
N. Lima Way
Sylmar, CA 91342
|
- sq. feet
|
2 baths 4 beds |
show details | |

|
#40
Monogram Ave
North Hills, CA 91343
|
1,224 sq. feet
|
2 baths 3 beds |
show details |
| Photo | Address | Area | Beds / Baths | Price | Details |
|---|---|---|---|---|---|

|
#41
Aaron Ct
Santa Clarita, CA 91350
|
2,032 sq. feet
|
3 baths 4 beds |
show details | |

|
#42
Thorn Ridge Ct
Simi Valley, CA 93063
|
4,346 sq. feet
|
4 baths 5 beds |
show details | |

|
#43
Kinzie St
Northridge, CA 91325
|
2,776 sq. feet
|
3 baths 4 beds |
show details | |

|
#44
Katherine St
Simi Valley, CA 93063
|
1,835 sq. feet
|
2 baths 4 beds |
show details | |

|
#45
Bryce Dr
Castaic, CA 91384
|
1,897 sq. feet
|
3 baths 4 beds |
show details | |

|
#46
Walnut Ave
Simi Valley, CA 93063
|
2,275 sq. feet
|
2 baths 4 beds |
show details | |

|
#47
Bridlewood Dr
Castaic, CA 91384
|
2,230 sq. feet
|
3 baths 4 beds |
show details | |

|
#48
Muledeer Ln
Castaic, CA 91384
|
1,736 sq. feet
|
3 baths 4 beds |
show details | |

|
#49
June Rose Ct
Castaic, CA 91384
|
2,957 sq. feet
|
3 baths 4 beds |
show details | |

|
Check over 1 million property listings on Foreclosure.com!
|
browse all offers | |||


 | Buying Home in Walnut Creek (Work in Santa Clara) (64 replies) |
| What California school district(s) are YOU a product of? (20 replies) |
| Questions About Fillmore (5 replies) |
| How is the "Quality of Life" in and around L.A. ? (105 replies) |
| Lancaster, CA area (87 replies) |
| Nonwhite youth population growing in California and nation, report finds (30 replies) |

Median year apartment built: 1984
Household type by relationship:
Households: 3,220- Male householders: 506 (27 living alone), Female householders: 350 (43 living alone)
596 spouses (596 opposite-sex spouses), 28 unmarried partners, (28 opposite-sex unmarried partners), 1,214 children (1,089 natural, 68 adopted, 55 stepchildren), 68 grandchildren, 60 brothers or sisters, 196 parents, 0 foster children, 57 other relatives, 140 non-relatives
Size of family households: 157 2-persons, 124 3-persons, 224 4-persons, 123 5-persons, 77 6-persons, 22 7-or-more-persons.
Size of nonfamily households: 75 1-person, 58 2-persons, 10 3-persons.
709 married couples with children.
30 single-parent households (14 men, 16 women).
45.0% of residents of Val Verde speak English at home.
50.3% of residents speak Spanish at home (61% speak English very well, 15% speak English well, 13% speak English not well, 11% don't speak English at all).
0.5% of residents speak other Indo-European language at home (100% speak English very well).
2.7% of residents speak Asian or Pacific Island language at home (50% speak English very well, 14% speak English well, 36% speak English not well).
0.5% of residents speak other language at home (100% speak English very well).
Foreign born population: 873 (27.1%)
(62.7% of them are naturalized citizens)
| Here: | 5.7 |
| State: | 6.0 |
| Here: | 4.6 |
| State: | 3.9 |

- Bedrooms in owner-occupied houses and condos in Val Verde, California
- 6no bedroom
- 31 bedroom
- 532 bedrooms
- 4813 bedrooms
- 1984 bedrooms
- 245+ bedrooms

- Bedrooms in renter-occupied apartments in Val Verde, California
- 0no bedroom
- 01 bedroom
- 682 bedrooms
- 563 bedrooms
- 04 bedrooms
- 05+ bedrooms

- Cars and other vehicles available in Val Verde in owner-occupied houses/condos
- 3no vehicle
- 861 vehicle
- 2712 vehicles
- 2053 vehicles
- 1104 vehicles
- 905+ vehicles

- Cars and other vehicles available in Val Verde in renter-occupied apartments
- 0no vehicle
- 01 vehicle
- 492 vehicles
- 673 vehicles
- 84 vehicles
- 05+ vehicles

- Rooms in owner-occupied houses in Val Verde, California
- 61 room
- 02 rooms
- 33 rooms
- 684 rooms
- 2235 rooms
- 2646 rooms
- 1117 rooms
- 498 rooms
- 429+ rooms

- Rooms in renter-occupied apartments in Val Verde, California
- 01 room
- 02 rooms
- 03 rooms
- 604 rooms
- 165 rooms
- 196 rooms
- 237 rooms
- 58 rooms
- 09+ rooms


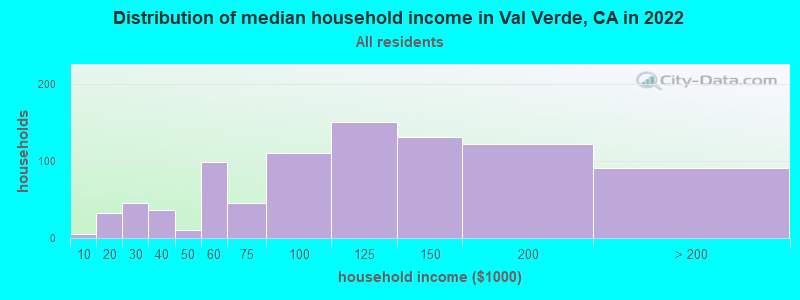
Val Verde, CA household income distribution

- 5Less than $10,000
- 32$10,000 to $19,999
- 46$20,000 to $29,999
- 36$30,000 to $39,999
- 11$40,000 to $49,999
- 99$50,000 to $59,999
- 46$60,000 to $74,999
- 110$75,000 to $99,999
- 151$100,000 to $124,999
- 131$125,000 to $149,999
- 122$150,000 to $199,999
- 91$200,000 or more
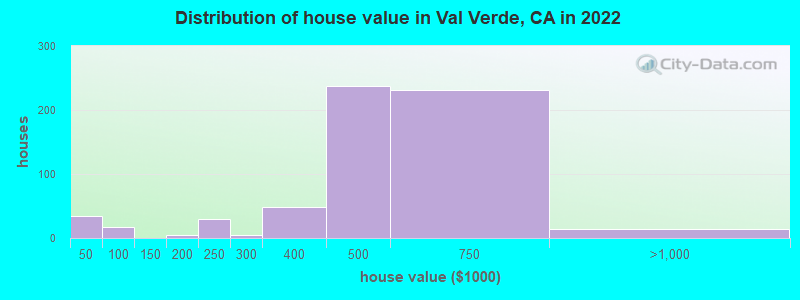
Home value of owner - occupied houses in 2022 in Val Verde, CA
-
- 17Less than $10,000
- 16$40,000 to $49,999
- 4$150,000 to $174,999
- 29$200,000 to $249,999
- 3$250,000 to $299,999
- 47$300,000 to $399,999
- 238$400,000 to $499,999
- 231$500,000 to $749,999
- 13$750,000 to $999,999
Rent paid by renters in 2022 in Val Verde, CA
-
- 10$600 to $649
- 21$1,000 to $1,249
- 61$1,250 to $1,499
- 14$1,500 to $1,999
- 7$2,000 to $2,499
- 6$2,500 to $2,999


Percentage of workers working in this county: 96.8%
Number of people working at home: 119 (8.1% of all workers)
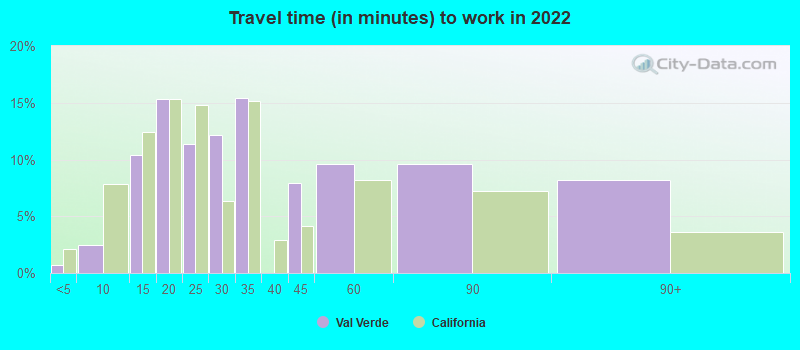
Travel time to work (commute)
- Less than 5 minutes: 0
- 5 to 9 minutes: 63
- 10 to 14 minutes: 232
- 15 to 19 minutes: 145
- 20 to 24 minutes: 95
- 25 to 29 minutes: 38
- 30 to 34 minutes: 247
- 35 to 39 minutes: 88
- 40 to 44 minutes: 70
- 45 to 59 minutes: 279
- 60 to 89 minutes: 43
- 90 or more minutes: 15
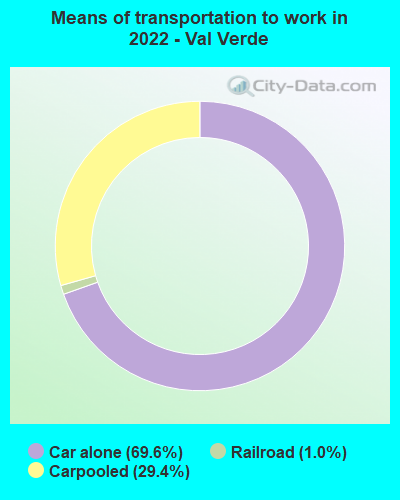
Means of transportation to work:
- Drove a car alone: 542 (61.3%)
- Carpooled: 196 (22.2%)
- Railroad: 3 (0.3%)
- Worked at home: 146 (16.5%)

- Unemployment by race in 2022
- Unemployment rate for White non-Hispanic residents
- 4.9%Males
- 1.3%Females
- Unemployment rate for Asian residents
- 13.3%Males
- Unemployment rate for other race residents
- 3.7%Males
- 4.7%Females
- Unemployment rate for two or more race residents
- 10.5%Males
- Unemployment rate for Hispanic or Latino residents
- 6.7%Males
- 2.9%Females

- Year of entry for the foreign-born population in Val Verde, California
- 1092010 or later
- 752000 to 2009
- 3141990 to 1999
- 1021980 to 1989
- 1921970 to 1979
- 12Before 1970
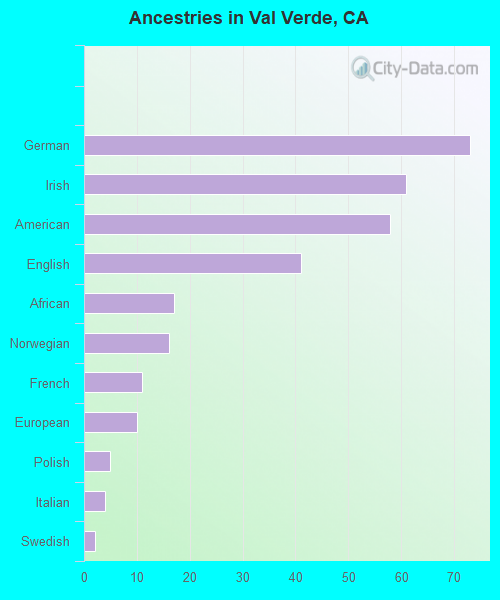
First ancestries reported:
- German: 73 (3.4%)
- Irish: 61 (2.8%)
- American: 58 (2.7%)
- English: 41 (1.9%)
- African: 17 (0.8%)
- Norwegian: 16 (0.7%)
- French: 11 (0.5%)
- European: 10 (0.5%)
- Polish: 5 (0.2%)
- Italian: 4 (0.2%)
- Swedish: 2 (0.09%)
Most common places of birth for foreign-born residents (%):
| Val Verde: | 72.9% (636) |
| California: | 37.2% (3,881,193) |
| Val Verde: | 5.2% (45) |
| California: | 0.6% (58,161) |
| Val Verde: | 4.9% (43) |
| California: | 7.8% (818,297) |
| Val Verde: | 2.6% (23) |
| California: | 0.6% (65,335) |
| Val Verde: | 2.2% (19) |
| California: | 4.9% (512,335) |
| Val Verde: | 1.9% (17) |
| California: | 0.1% (12,503) |
| Val Verde: | 1.7% (15) |
| California: | 0.7% (73,304) |
| Val Verde: | 1.7% (15) |
| California: | 0.1% (15,357) |
Place of birth for U.S.-born residents:
- This state: 2,092
- Other state: 221
- Northeast: 86
- Midwest: 56
- South: 53
- West: 25
95.3% of Val Verde residents lived in the same house 1 years ago.
Out of people who lived in different houses, 37.8% lived in this county.
Out of people who lived in different counties, 45.2% lived in California.
| Val Verde: | 95.3% |
| State average: | 88.9% |
Education attainment for males 25 years and older:
- No schooling: 32
- Nursery to 4th grade: 28
- 5th and 6th grade: 73
- 7th and 8th grade: 8
- 9th grade: 5
- 10th grade: 0
- 11th grade: 4
- 12th grade, no diploma: 19
- High school graduate (or equivalency): 314
- Less than 1 year of college: 117
- Some college more than 1 year, no degree: 227
- Associate degree: 73
- Bachelor's degree: 116
- Master's degree: 22
- Professional school degree: 10
- Doctorate degree: 0

Education attainment for females 25 years and older:
- No schooling: 66
- Nursery to 4th grade: 32
- 5th and 6th grade: 113
- 7th and 8th grade: 0
- 9th grade: 6
- 10th grade: 0
- 11th grade: 3
- 12th grade, no diploma: 30
- High school graduate (or equivalency): 150
- Less than 1 year of college: 101
- Some college more than 1 year, no degree: 126
- Associate degree: 102
- Bachelor's degree: 191
- Master's degree: 79
- Professional school degree: 0
- Doctorate degree: 8


Housing units in structures:
- One, detached: 868
- One, attached: 32
- Mobile homes: 26
Housing units lacking complete kitchen facilities in 2022: 2.2%
House/condo owner moved in on average 12 years ago
Renter moved in on average 6 years ago

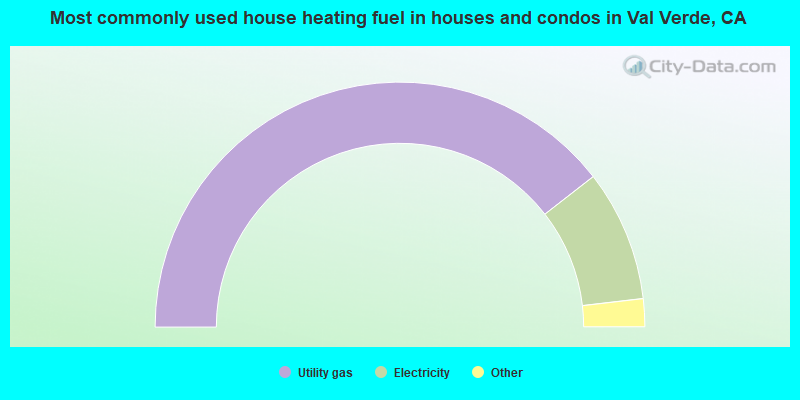
- 79.2%Utility gas
- 17.4%Electricity
- 1.6%No fuel used
- 1.3%Solar energy
- 0.5%Bottled, tank, or LP gas
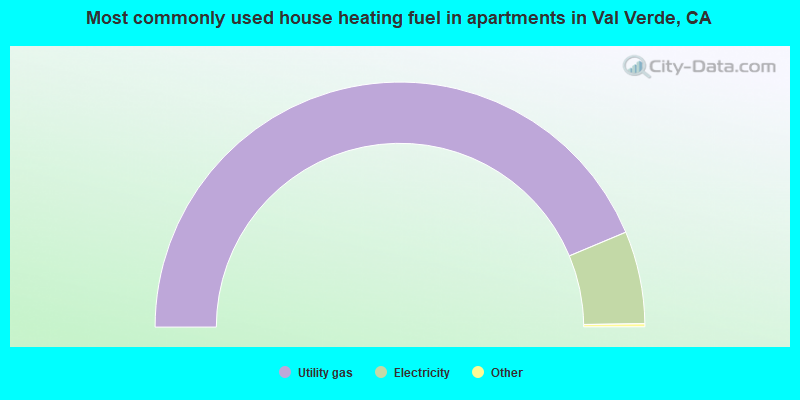
- 87.7%Utility gas
- 12.3%Electricity
Private vs. public school enrollment:
| Here: | 5.3% |
| California: | 10.5% |
| Here: | 0.0% |
| California: | 8.5% |
| Here: | 18.1% |
| California: | 15.9% |


