Valle Vista, CA (California) Houses and Residents
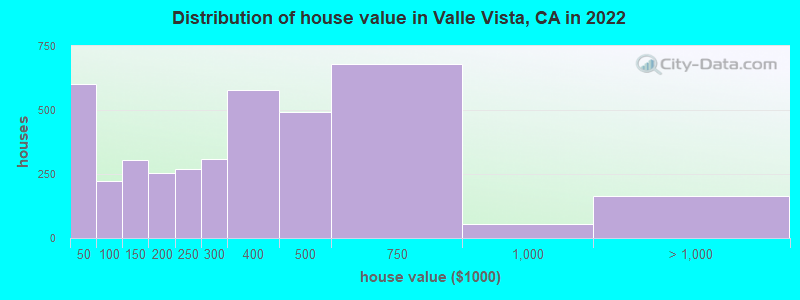
Estimated median house or condo value in 2022: $338,111 (it was $76,500 in 2000 )
Valle Vista:
$338,111California:
$715,900
Lower value quartile - upper value quartile: $177,740 - $451,950Total population: 14,578 (Urban population: 10,612, Rural population: 0)
Houses: 7,039 (6,572 occupied: 4,985 owner occupied, 1,631 renter occupied )
% of renters here:
25%State:
44%
Housing density: 2,194 houses/condos per square mile
Median price asked for vacant for-sale houses and condos in 2022: $222,229.
Median contract rent in 2022: $1,337 (lower quartile is $933, upper quartile is $1,566)
Median rent asked for vacant for-rent units in 2022: $4,407
Median gross rent in Valle Vista, CA in 2022: $1,583
Housing units in Valle Vista with a mortgage: 2,877 (113 second mortgage, 0 home equity loan, 117 both second mortgage and home equity loan )Houses without a mortgage: 38
Median household income for houses/condos with a mortgage: $81,897
Median household income for apartments without a mortgage: $37,184
Median monthly housing costs: $1,361
Data:
Median house or condo value ($)
Median house or condo value ($ change since 2000)
Median house or condo value ($) - White
Median house or condo value ($) - Black or African American
Median house or condo value ($) - Asian
Median house or condo value ($) - Hispanic or Latino
Median house or condo value ($) - American Indian and Alaska Native
Median house or condo value ($) - Multirace
Median house or condo value ($) - Other Race
Median price asked for mobile homes ($)
Household density (households per square mile)
Mean house or condo value by units in structure - 1, detached ($)
Mean house or condo value by units in structure - 1, attached ($)
Mean house or condo value by units in structure - 2 ($)
Mean house or condo value by units in structure by units in structure - 3 or 4 ($)
Mean house or condo value by units in structure - 5 or more ($)
Mean house or condo value by units in structure - Boat, RV, van, etc. ($)
Mean house or condo value by units in structure - Mobile home ($)
Median contract rent ($)
Median contract rent - Lower quartile ($)
Median contract rent - Upper quartile ($)
Median gross rent ($)
Urban houses (%)
Rural houses (%)
Houses occupied (%)
Houses occupied (% change since 2000)
Houses owner occupied (%)
Houses owner occupied (% change since 2000)
Houses renter occupied (%)
Houses renter occupied (% change since 2000)
Vacant housing units - For rent (%)
Vacant housing units - For rent (% change since 2000)
Vacant housing units - For sale only (%)
Vacant housing units - For sale only (% change since 2000)
Vacant housing units - Rented or sold, not occupied (%)
Vacant housing units - Rented or sold, not occupied (% change since 2000)
Vacant housing units - For seasonal, recreational, or occasional use (%)
Vacant housing units - For seasonal, recreational, or occasional use (% change since 2000)
Vacant housing units - For migrant workers (%)
Vacant housing units - For migrant workers (% change since 2000)
Vacant housing units - Other vacant (%)
Vacant housing units - Other vacant (% change since 2000)
Median monthly housing costs ($)
Median household income for houses/condos with a mortgage ($)
Median household income for houses/condos without a mortgage ($)
Median household income ($)
Median household income ($) - White
Median household income ($) - Black or African American
Median household income ($) - Asian
Median household income ($) - Hispanic or Latino
Median household income ($) - American Indian and Alaska Native
Median household income ($) - Multirace
Median household income ($) - Other Race
Mortgage status - with mortgage (%)
Mortgage status - with second mortgage (%)
Mortgage status - with home equity loan (%)
Mortgage status - with both second mortgage and home equity loan (%)
Mortgage status - without a mortgage (%)
Median year house/condo built
Median year apartment built
Household type by relationship - Male householder living alone (%)
Household type by relationship - Male householder not living alone (%)
Household type by relationship - Female householder living alone (%)
Household type by relationship - Female householder not living alone (%)
Household type by relationship - Opposite-Sex spouse (%)
Household type by relationship - Same-Sex spouse (%)
Household type by relationship - Opposite-Sex unmarried partner (%)
Household type by relationship - Same-Sex unmarried partner (%)
Household type by relationship - In group quarters (%)
Size of family households - 2-person household (%)
Size of family households - 3-person household (%)
Size of family households - 4-person household (%)
Size of family households - 5-person household (%)
Size of family households - 6-person household (%)
Size of family households - 7-or-more-person household (%)
Size of nonfamily households - 1-person household (%)
Size of nonfamily households - 2-person household (%)
Size of nonfamily households - 3-person household (%)
Size of nonfamily households - 4-person household (%)
Size of nonfamily households - 5-person household (%)
Size of nonfamily households - 6-person household (%)
Size of nonfamily households - 7-or-moreperson household (%)
Year house built - Built 2010 or later (%)
Year house built - Built 2000 to 2009 (%)
Year house built - Built 1990 to 1999 (%)
Year house built - Built 1980 to 1989 (%)
Year house built - Built 1970 to 1979 (%)
Year house built - Built 1960 to 1969 (%)
Year house built - Built 1950 to 1959 (%)
Year house built - Built 1940 to 1949 (%)
Year house built - Built 1939 or earlier (%)
Median number of rooms in houses and condos
Median number of rooms in apartments
Median number of bedrooms in owner occupied houses
Mean number of bedrooms in owner occupied houses
Median number of bedrooms in renter occupied houses
Mean number of bedrooms in renter occupied houses
Median number of vehichles in owner occupied houses
Mean number of vehichles in owner occupied houses
Median number of vehichles in renter occupied houses
Mean number of vehichles in renter occupied houses
Rooms in owner-occupied houses - 1 room (%)
Rooms in owner-occupied houses - 2 rooms (%)
Rooms in owner-occupied houses - 3 rooms (%)
Rooms in owner-occupied houses - 4 rooms (%)
Rooms in owner-occupied houses - 5 rooms (%)
Rooms in owner-occupied houses - 6 rooms (%)
Rooms in owner-occupied houses - 7 rooms (%)
Rooms in owner-occupied houses - 8 rooms (%)
Rooms in owner-occupied houses - 9+ rooms (%)
Rooms in renter-occupied houses - 1 room (%)
Rooms in renter-occupied houses - 2 rooms (%)
Rooms in renter-occupied houses - 3 rooms (%)
Rooms in renter-occupied houses - 4 rooms (%)
Rooms in renter-occupied houses - 5 rooms (%)
Rooms in renter-occupied houses - 6 rooms (%)
Rooms in renter-occupied houses - 7 rooms (%)
Rooms in renter-occupied houses - 8 rooms (%)
Rooms in renter-occupied houses - 9+ rooms (%)
Bedrooms in owner-occupied houses - no bedrooms (%)
Bedrooms in owner-occupied houses - 1 bedroom (%)
Bedrooms in owner-occupied houses - 2 bedrooms (%)
Bedrooms in owner-occupied houses - 3 bedrooms (%)
Bedrooms in owner-occupied houses - 4 bedrooms (%)
Bedrooms in owner-occupied houses - 5+ bedrooms (%)
Bedrooms in renter-occupied houses - no bedrooms (%)
Bedrooms in renter-occupied houses - 1 bedroom (%)
Bedrooms in renter-occupied houses - 2 bedrooms (%)
Bedrooms in renter-occupied houses - 3 bedrooms (%)
Bedrooms in renter-occupied houses - 4 bedrooms (%)
Bedrooms in renter-occupied houses - 5+ bedrooms (%)
Vehicles available in owner-occupied houses - no vehicle available (%)
Vehicles available in owner-occupied houses - 1 vehicle available(%)
Vehicles available in owner-occupied houses - 2 Vehicles available (%)
Vehicles available in owner-occupied houses - 3 Vehicles available (%)
Vehicles available in owner-occupied houses - 4 Vehicles available (%)
Vehicles available in owner-occupied houses - 5+ Vehicles available (%)
Vehicles available in renter-occupied houses - no vehicle available (%)
Vehicles available in renter-occupied houses - 1 vehicle available (%)
Vehicles available in renter-occupied houses - 2 Vehicles available (%)
Vehicles available in renter-occupied houses - 3 Vehicles available (%)
Vehicles available in renter-occupied houses - 4 Vehicles available (%)
Vehicles available in renter-occupied houses - 5+ Vehicles available (%)
Housing units in structures - 1, detached (%)
Housing units in structures - 1, attached (%)
Housing units in structures - 2 (%)
Housing units in structures - 3 or 4 (%)
Housing units in structures - 5 to 9 (%)
Housing units in structures - 10 to 19 (%)
Housing units in structures - 20 to 49 (%)
Housing units in structures - 50 or more (%)
Housing units in structures - Mobile home (%)
Housing units in structures - Boat, RV, van, etc. (%)
Housing units in structures - Owners - 1, detached (%)
Housing units in structures - Owners - 1, attached (%)
Housing units in structures - Owners - 2 (%)
Housing units in structures - Owners - 3 or 4 (%)
Housing units in structures - Owners - 5 to 9 (%)
Housing units in structures - Owners - 10 to 19 (%)
Housing units in structures - Owners - 20 to 49 (%)
Housing units in structures - Owners - 50 or more (%)
Housing units in structures - Owners - Mobile home (%)
Housing units in structures - Owners - Boat, RV, van, etc. (%)
Housing units in structures - Renters - 1, detached (%)
Housing units in structures - Renters - 1, attached (%)
Housing units in structures - Renters - 2 (%)
Housing units in structures - Renters - 3 or 4 (%)
Housing units in structures - Renters - 5 to 9 (%)
Housing units in structures - Renters - 10 to 19 (%)
Housing units in structures - Renters - 20 to 49 (%)
Housing units in structures - Renters - 50 or more (%)
Housing units in structures - Renters - Mobile home (%)
Housing units in structures - Renters - Boat, RV, van, etc. (%)
House/condo owner moved in on average (years ago)
Renter moved in on average (years ago)
Year householder moved into unit - Moved in 1999 to March 2000 (%)
Year householder moved into unit - Moved in 1999 to March 2000 (%) - White
Year householder moved into unit - Moved in 1999 to March 2000 (%) - Black or African American
Year householder moved into unit - Moved in 1999 to March 2000 (%) - Asian
Year householder moved into unit - Moved in 1999 to March 2000 (%) - Hispanic or Latino
Year householder moved into unit - Moved in 1999 to March 2000 (%) - American Indian and Alaska Native
Year householder moved into unit - Moved in 1999 to March 2000 (%) - Multirace
Year householder moved into unit - Moved in 1999 to March 2000 (%) - Other Race
Year householder moved into unit - Moved in 1995 to 1998 (%)
Year householder moved into unit - Moved in 1995 to 1998 (%) - White
Year householder moved into unit - Moved in 1995 to 1998 (%) - Black or African American
Year householder moved into unit - Moved in 1995 to 1998 (%) - Asian
Year householder moved into unit - Moved in 1995 to 1998 (%) - Hispanic or Latino
Year householder moved into unit - Moved in 1995 to 1998 (%) - American Indian and Alaska Native
Year householder moved into unit - Moved in 1995 to 1998 (%) - Multirace
Year householder moved into unit - Moved in 1995 to 1998 (%) - Other Race
Year householder moved into unit - Moved in 1990 to 1994 (%)
Year householder moved into unit - Moved in 1990 to 1994 (%) - White
Year householder moved into unit - Moved in 1990 to 1994 (%) - Black or African American
Year householder moved into unit - Moved in 1990 to 1994 (%) - Asian
Year householder moved into unit - Moved in 1990 to 1994 (%) - Hispanic or Latino
Year householder moved into unit - Moved in 1990 to 1994 (%) - American Indian and Alaska Native
Year householder moved into unit - Moved in 1990 to 1994 (%) - Multirace
Year householder moved into unit - Moved in 1990 to 1994 (%) - Other Race
Year householder moved into unit - Moved in 1980 to 1989 (%)
Year householder moved into unit - Moved in 1980 to 1989 (%) - White
Year householder moved into unit - Moved in 1980 to 1989 (%) - Black or African American
Year householder moved into unit - Moved in 1980 to 1989 (%) - Asian
Year householder moved into unit - Moved in 1980 to 1989 (%) - Hispanic or Latino
Year householder moved into unit - Moved in 1980 to 1989 (%) - American Indian and Alaska Native
Year householder moved into unit - Moved in 1980 to 1989 (%) - Multirace
Year householder moved into unit - Moved in 1980 to 1989 (%) - Other Race
Year householder moved into unit - Moved in 1970 to 1979 (%)
Year householder moved into unit - Moved in 1970 to 1979 (%) - White
Year householder moved into unit - Moved in 1970 to 1979 (%) - Black or African American
Year householder moved into unit - Moved in 1970 to 1979 (%) - Asian
Year householder moved into unit - Moved in 1970 to 1979 (%) - Hispanic or Latino
Year householder moved into unit - Moved in 1970 to 1979 (%) - American Indian and Alaska Native
Year householder moved into unit - Moved in 1970 to 1979 (%) - Multirace
Year householder moved into unit - Moved in 1970 to 1979 (%) - Other Race
Year householder moved into unit - Moved in 1969 or earlier (%)
Year householder moved into unit - Moved in 1969 or earlier (%) - White
Year householder moved into unit - Moved in 1969 or earlier (%) - Black or African American
Year householder moved into unit - Moved in 1969 or earlier (%) - Asian
Year householder moved into unit - Moved in 1969 or earlier (%) - Hispanic or Latino
Year householder moved into unit - Moved in 1969 or earlier (%) - American Indian and Alaska Native
Year householder moved into unit - Moved in 1969 or earlier (%) - Multirace
Year householder moved into unit - Moved in 1969 or earlier (%) - Other Race
Housing units lacking complete plumbing facilities (%)
Housing units lacking complete kitchen facilities (%)
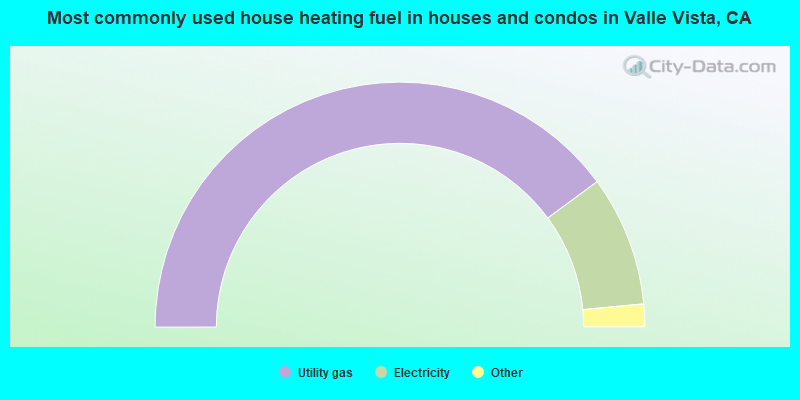
House heating fuel used in houses and condos - Utility gas (%)
House heating fuel used in houses and condos - Bottled, tank, or LP gas (%)
House heating fuel used in houses and condos - Electricity (%)
House heating fuel used in houses and condos - Fuel oil, kerosene, etc. (%)
House heating fuel used in houses and condos - Coal or coke (%)
House heating fuel used in houses and condos - Wood (%)
House heating fuel used in houses and condos - Solar energy (%)
House heating fuel used in houses and condos - Other fuel (%)
House heating fuel used in houses and condos - No fuel used (%)
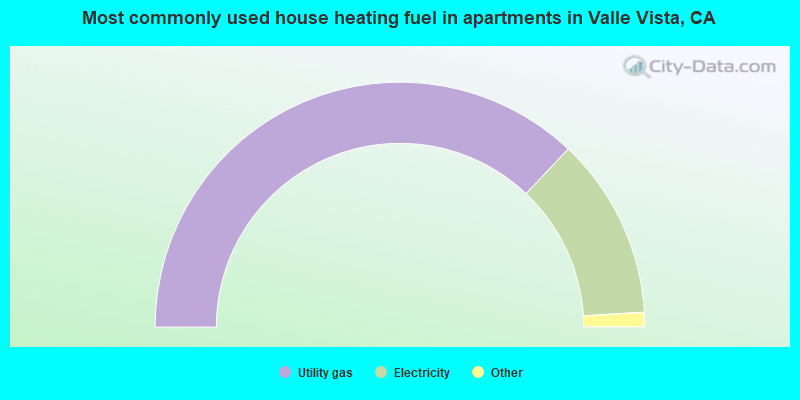
House heating fuel used in apartments - Utility gas (%)
House heating fuel used in apartments - Bottled, tank, or LP gas (%)
House heating fuel used in apartments - Electricity (%)
House heating fuel used in apartments - Fuel oil, kerosene, etc. (%)
House heating fuel used in apartments - Coal or coke (%)
House heating fuel used in apartments - Wood (%)
House heating fuel used in apartments - Solar energy (%)
House heating fuel used in apartments - Other fuel (%)
House heating fuel used in apartments - No fuel used (%)
Median year house/condo built: 1982Median year apartment built: 1978Household type by relationship:
Households: 19,603
Male householders: 3,128 (800 living alone ), Female householders: 3,438 (738 living alone )3,562 spouses (3,510 opposite-sex spouses ), 403 unmarried partners , (369 opposite-sex unmarried partners ), 6,437 children (5,957 natural , 47 adopted , 431 stepchildren ), 552 grandchildren , 276 brothers or sisters , 344 parents , 0 foster children , 647 other relatives , 796 non-relatives In group quarters: 15
Size of family households: 1,793 2-persons , 809 3-persons , 776 4-persons , 797 5-persons , 528 6-persons , 46 7-or-more-persons .
Size of nonfamily households: 1,491 1-person , 350 2-persons , 3 3-persons .
2,958 married couples with children. single-parent households (201 men , 1,029 women ).
72.6% of residents of Valle Vista speak English at home. of residents speak Spanish at home (66% speak English very well , 23% speak English well , 9% speak English not well , 2% don't speak English at all ).of residents speak other Indo-European language at home (52% speak English very well , 36% speak English well , 12% speak English not well ).of residents speak Asian or Pacific Island language at home (85% speak English very well , 15% speak English well ).of residents speak other language at home (41% speak English very well , 59% speak English well ).
Foreign born population: 2,535 (12.9%)of them are naturalized citizens )
Median number of rooms in houses and condos:
Median number of rooms in apartments
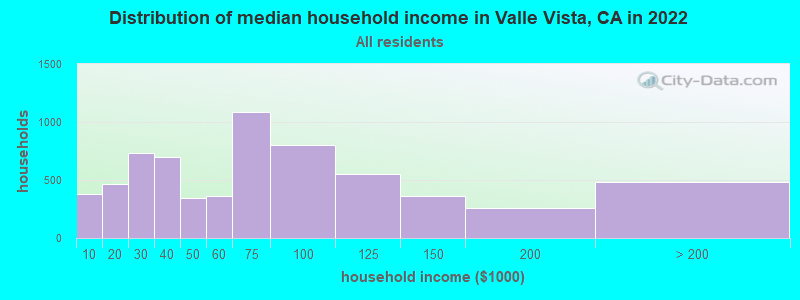
Valle Vista, CA household income distribution 377 Less than $10,000468 $10,000 to $19,999729 $20,000 to $29,999694 $30,000 to $39,999342 $40,000 to $49,999366 $50,000 to $59,9991,089 $60,000 to $74,999805 $75,000 to $99,999556 $100,000 to $124,999360 $125,000 to $149,999257 $150,000 to $199,999485 $200,000 or more
Home value of owner - occupied houses in 2022 in Valle Vista, CA 195 Less than $10,00041 $10,000 to $14,99933 $15,000 to $19,99959 $20,000 to $24,99951 $25,000 to $29,999117 $30,000 to $34,99949 $35,000 to $39,99952 $40,000 to $49,99914 $50,000 to $59,99925 $60,000 to $69,99948 $70,000 to $79,99951 $80,000 to $89,99931 $90,000 to $99,999217 $100,000 to $124,99988 $125,000 to $149,999133 $150,000 to $174,999121 $175,000 to $199,999269 $200,000 to $249,999308 $250,000 to $299,999577 $300,000 to $399,999491 $400,000 to $499,999680 $500,000 to $749,99954 $750,000 to $999,99977 $1,000,000 to $1,499,99985 $2,000,000 or moreRent paid by renters in 2022 in Valle Vista, CA 16 $250 to $29915 $350 to $3994 $450 to $49963 $500 to $54939 $550 to $59915 $600 to $6494 $650 to $69921 $700 to $74931 $750 to $79985 $800 to $899138 $900 to $999177 $1,000 to $1,249377 $1,250 to $1,499311 $1,500 to $1,99940 $2,000 to $2,499139 No cash rent
Percentage of workers working in this county: 84.4%Number of people working at home: 754 (9.9% of all workers )
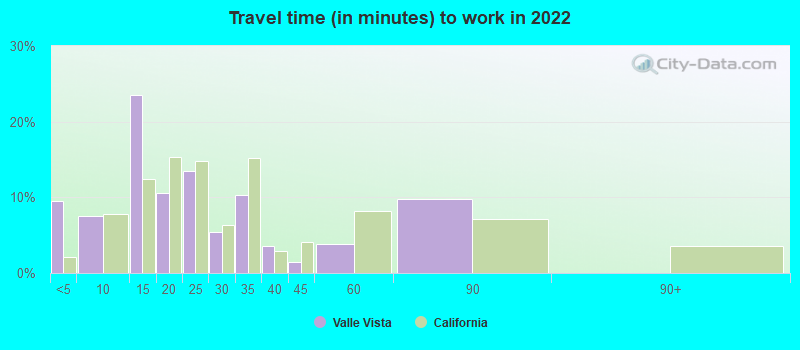
Travel time to work (commute)
Less than 5 minutes: 2045 to 9 minutes: 43610 to 14 minutes: 60015 to 19 minutes: 87420 to 24 minutes: 56125 to 29 minutes: 39630 to 34 minutes: 1,03935 to 39 minutes: 39240 to 44 minutes: 40745 to 59 minutes: 62460 to 89 minutes: 94090 or more minutes: 333
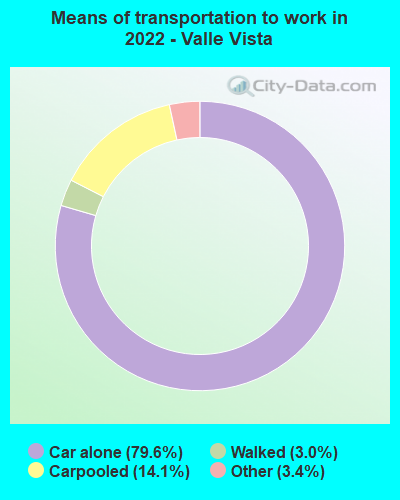
Means of transportation to work:
Drove a car alone: 1,071 (53.4%)Carpooled: 205 (10.2%)Taxi: 47 (2.3%)Walked: 40 (2.0%)Worked at home: 754 (37.6%)
Unemployment by race in 2022
Unemployment rate for White non-Hispanic residents 6.2% Males3.9% FemalesUnemployment rate for Black residents 24.0% MalesUnemployment rate for other race residents 17.7% Males4.9% FemalesUnemployment rate for two or more race residents 2.6% Males4.6% FemalesUnemployment rate for Hispanic or Latino residents 8.9% Males7.5% Females
Year of entry for the foreign-born population in Valle Vista, California
705 2010 or later 405 2000 to 2009 473 1990 to 1999 244 1980 to 1989 99 1970 to 1979 317 Before 1970
First ancestries reported:
German: 899 (9.0%)
English: 470 (4.7%)
American: 199 (2.0%)
Scotch-Irish: 168 (1.7%)
Irish: 156 (1.6%)
Italian: 144 (1.4%)
Ghanaian: 130 (1.3%)
Syrian: 94 (0.9%)
Scottish: 93 (0.9%)
Portuguese: 67 (0.7%)
Hungarian: 42 (0.4%)
Norwegian: 38 (0.4%)
Belgian: 35 (0.4%)
Slovak: 27 (0.3%)
European: 25 (0.3%)
Polish: 23 (0.2%)
Scandinavian: 20 (0.2%)
British: 19 (0.2%)
Dutch: 19 (0.2%)
Canadian: 16 (0.2%)
Iranian: 16 (0.2%)
Swedish: 16 (0.2%)
Swiss: 13 (0.1%)
Welsh: 9 (0.09%)
Danish: 8 (0.08%)
French: 7 (0.07%)
South African: 7 (0.07%)
French Canadian: 5 (0.05%) Most common places of birth for foreign-born residents (%): Mexico Valle Vista:
58.3% (1,478)California:
37.2% (3,881,193)
Nicaragua Valle Vista:
13.3% (338)California:
0.6% (58,161)
Syria Valle Vista:
6.8% (173)California:
0.3% (30,949)
Ghana Valle Vista:
5.4% (137)California:
0.1% (8,814)
Philippines Valle Vista:
2.2% (55)California:
7.8% (818,297)
Germany Valle Vista:
1.9% (49)California:
0.7% (73,304)
Peru Valle Vista:
1.6% (41)California:
0.7% (74,025)
Place of birth for U.S.-born residents:
This state: 13,571Other state: 3,053Northeast: 637Midwest: 993South: 836West: 586 91.5% of Valle Vista residents lived in the same house 1 years ago.
Out of people who lived in different houses, 39.2% lived in this county.
Out of people who lived in different counties, 84.8% lived in California.
Valle Vista:
91.5%State average:
88.9%
Education attainment for males 25 years and older:
No schooling: 267Nursery to 4th grade: 115th and 6th grade: 757th and 8th grade: 1109th grade: 19010th grade: 16911th grade: 27612th grade, no diploma: 498High school graduate (or equivalency): 1,832Less than 1 year of college: 570Some college more than 1 year, no degree: 802Associate degree: 447Bachelor's degree: 590Master's degree: 244Professional school degree: 139Doctorate degree: 41
Education attainment for females 25 years and older:
No schooling: 79Nursery to 4th grade: 05th and 6th grade: 1107th and 8th grade: 989th grade: 7510th grade: 17511th grade: 44012th grade, no diploma: 206High school graduate (or equivalency): 1,953Less than 1 year of college: 797Some college more than 1 year, no degree: 965Associate degree: 509Bachelor's degree: 620Master's degree: 506Professional school degree: 0Doctorate degree: 10
Housing units in structures:
One, detached: 3,924One, attached: 58Two: 493 or 4: 975 to 9: 13510 to 19: 15020 to 49: 4650 or more: 5Mobile homes: 2,570Median worth of mobile homes: $140,796
Housing units lacking complete plumbing facilities in 2022: 0.7%Housing units lacking complete kitchen facilities in 2022: 1.3%House/condo owner moved in on average 7 years ago
Renter moved in on average 3 years ago
Private vs. public school enrollment:
Students in private schools in grades 1 to 8 (elementary and middle school): 143 Here:
5.7%California:
10.5%
Students in private schools in grades 9 to 12 (high school): 56 Students in private undergraduate colleges: 254 Here:
26.3%California:
15.9%