Housing density: 533 houses/condos per square mile
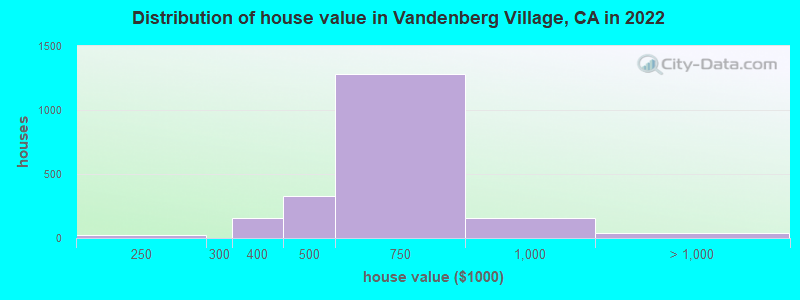
Median price asked for vacant for-sale houses and condos in 2022 in this county: $300,986.
Median contract rent in 2022: $1,831 (lower quartile is $1,585, upper quartile is over $2,000)
Median rent asked for vacant for-rent units in 2022: $1,592
Median gross rent in Vandenberg Village, CA in 2022: $1,902
Housing units in Vandenberg Village with a mortgage: 1,344 (130 second mortgage, 0 home equity loan, 77 both second mortgage and home equity loan) Houses without a mortgage: 24
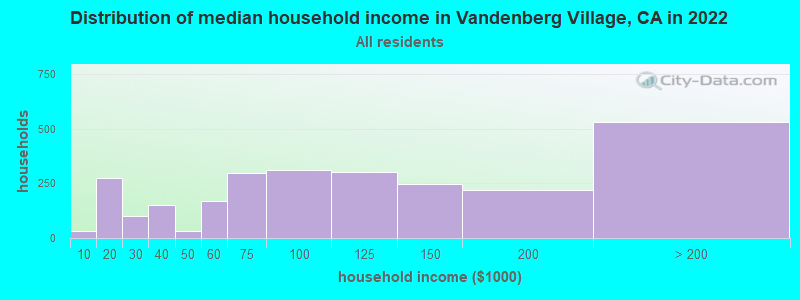
Median household income for houses/condos with a mortgage: $147,268
Median household income for apartments without a mortgage: $59,269
Median monthly housing costs: $1,849
Compare current foreclosures near Vandenberg Village, CA:
Size of family households: 993 2-persons, 266 3-persons, 289 4-persons, 187 5-persons, 51 6-persons, 39 7-or-more-persons.
Size of nonfamily households: 708 1-person, 105 2-persons, 18 4-persons.
1,057 married couples with children.
35 single-parent households (0 men, 35 women).
76.0% of residents of Vandenberg Village speak English at home.
19.0% of residents speak Spanish at home (55% speak English very well, 31% speak English well, 14% speak English not well).
1.5% of residents speak other Indo-European language at home (71% speak English very well, 17% speak English well, 12% speak English not well).
3.3% of residents speak Asian or Pacific Island language at home (91% speak English very well, 9% speak English well).
1.3% of residents speak other language at home (58% speak English very well, 42% speak English well).
Foreign born population: 800 (12.0%)
(69.2% of them are naturalized citizens)
Percentage of workers working in this county: 94.4% Number of people working at home: 322 (10.2% of all workers)
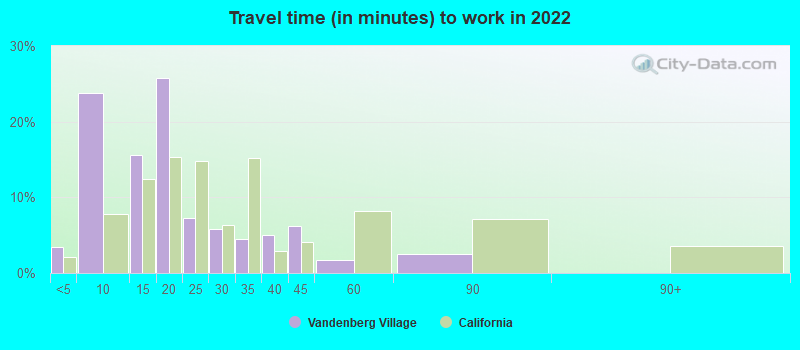
Travel time to work (commute)
Less than 5 minutes: 154
5 to 9 minutes: 356
10 to 14 minutes: 604
15 to 19 minutes: 473
20 to 24 minutes: 233
25 to 29 minutes: 297
30 to 34 minutes: 227
35 to 39 minutes: 101
40 to 44 minutes: 57
45 to 59 minutes: 27
60 to 89 minutes: 291
90 or more minutes: 44
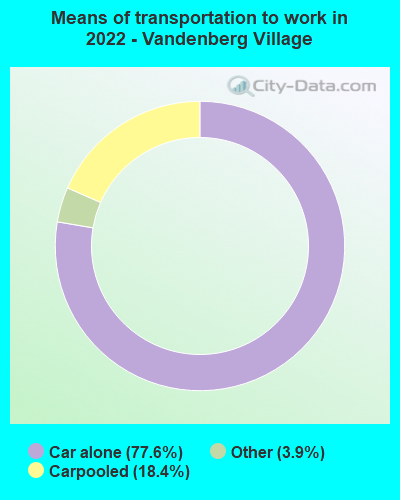
Means of transportation to work:
Drove a car alone: 548 (54.2%)
Carpooled: 147 (14.5%)
Taxi: 25 (2.5%)
Worked at home: 572 (56.6%)
Unemployment by race in 2022
Unemployment rate for White non-Hispanic residents
2.8%Females
Unemployment rate for Black residents
64.2%Females
Unemployment rate for other race residents
21.2%Males
7.2%Females
Unemployment rate for two or more race residents
51.8%Females
Unemployment rate for Hispanic or Latino residents
11.9%Males
20.4%Females
Year of entry for the foreign-born population in Vandenberg Village, California
1102010 or later
1482000 to 2009
921990 to 1999
541980 to 1989
611970 to 1979
337Before 1970
First ancestries reported:
American: 338 (10.5%)
English: 303 (9.4%)
German: 218 (6.8%)
European: 162 (5.0%)
Irish: 120 (3.7%)
Italian: 76 (2.4%)
French: 75 (2.3%)
Syrian: 61 (1.9%)
Scottish: 54 (1.7%)
Portuguese: 42 (1.3%)
Greek: 38 (1.2%)
Danish: 36 (1.1%)
Dutch: 30 (0.9%)
French Canadian: 30 (0.9%)
Polish: 30 (0.9%)
British: 27 (0.8%)
Northern European: 16 (0.5%)
Swiss: 16 (0.5%)
Norwegian: 15 (0.5%)
Swedish: 13 (0.4%)
Welsh: 10 (0.3%)
Scotch-Irish: 9 (0.3%)
Most common places of birth for foreign-born residents (%):
Mexico
Vandenberg Village:
15.9% (134)
California:
37.2% (3,881,193)
Syria
Vandenberg Village:
14.8% (125)
California:
0.3% (30,949)
Philippines
Vandenberg Village:
10.0% (84)
California:
7.8% (818,297)
Guatemala
Vandenberg Village:
10.0% (84)
California:
2.8% (290,436)
England
Vandenberg Village:
7.5% (63)
California:
0.6% (57,953)
Ireland
Vandenberg Village:
6.6% (56)
California:
0.2% (16,042)
Canada
Vandenberg Village:
5.3% (45)
California:
1.2% (127,477)
Australia
Vandenberg Village:
4.9% (41)
California:
0.2% (23,338)
France
Vandenberg Village:
4.4% (37)
California:
0.4% (40,224)
Japan
Vandenberg Village:
3.8% (32)
California:
1.0% (103,575)
Laos
Vandenberg Village:
3.2% (27)
California:
0.5% (48,911)
Denmark
Vandenberg Village:
3.0% (25)
California:
0.1% (6,555)
Honduras
Vandenberg Village:
1.9% (16)
California:
0.6% (66,590)
India
Vandenberg Village:
1.8% (15)
California:
5.2% (539,184)
Portugal
Vandenberg Village:
1.7% (14)
California:
0.2% (25,462)
Chile
Vandenberg Village:
1.7% (14)
California:
0.1% (15,357)
Place of birth for U.S.-born residents:
This state: 3,897
Other state: 1,806
Northeast: 483
Midwest: 517
South: 319
West: 444
84.8% of Vandenberg Village residents lived in the same house 1 years ago. Out of people who lived in different houses, 41.3% lived in this county. Out of people who lived in different counties, 67.3% lived in California.
Vandenberg Village:
84.8%
State average:
88.9%
Education attainment for males 25 years and older:
No schooling: 96
Nursery to 4th grade: 0
5th and 6th grade: 0
7th and 8th grade: 0
9th grade: 7
10th grade: 45
11th grade: 12
12th grade, no diploma: 27
High school graduate (or equivalency): 630
Less than 1 year of college: 179
Some college more than 1 year, no degree: 340
Associate degree: 380
Bachelor's degree: 395
Master's degree: 230
Professional school degree: 72
Doctorate degree: 8
Education attainment for females 25 years and older:
No schooling: 0
Nursery to 4th grade: 0
5th and 6th grade: 23
7th and 8th grade: 8
9th grade: 12
10th grade: 15
11th grade: 8
12th grade, no diploma: 43
High school graduate (or equivalency): 416
Less than 1 year of college: 107
Some college more than 1 year, no degree: 396
Associate degree: 228
Bachelor's degree: 734
Master's degree: 266
Professional school degree: 15
Doctorate degree: 13
Housing units in structures:
One, detached: 2,321
One, attached: 180
Two: 15
3 or 4: 128
5 to 9: 29
10 to 19: 51
20 to 49: 56
Housing units lacking complete kitchen facilities in 2022: 3.8%
House/condo owner moved in on average 14 years ago