Vandling, PA (Pennsylvania) Houses and Residents
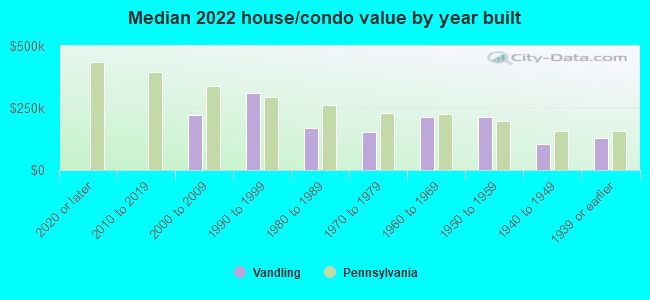
| Vandling: | $175,484 |
| Pennsylvania: | $245,500 |
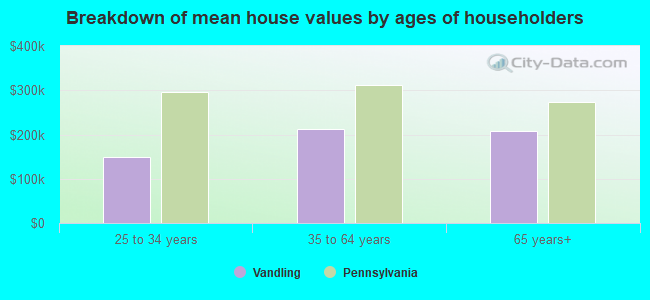
Mean price in 2022:
Detached houses: $198,832
Here: $198,832 State: $317,202
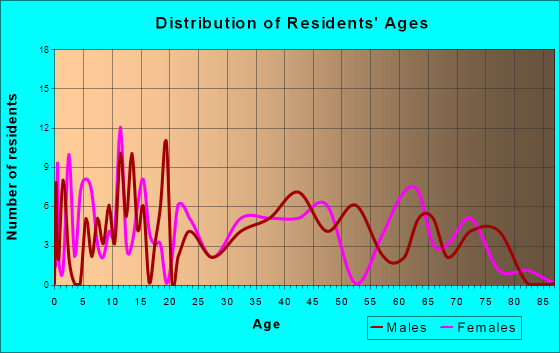
Total population: 739 (Urban population: 662, Rural population: 71 (all nonfarm))
Houses: 385 (346 occupied: 276 owner occupied, 75 renter occupied)
| % of renters here: | 21% |
| State: | 31% |
Housing density: 295 houses/condos per square mile
Median price asked for vacant for-sale houses and condos in 2022: $659,343.
Median contract rent in 2022: $597 (lower quartile is $518, upper quartile is $742)
Median rent asked for vacant for-rent units in 2022: $788
Median gross rent in Vandling, PA in 2022: $788
Housing units in Vandling with a mortgage: 102 (1 second mortgage, 0 home equity loan, 1 both second mortgage and home equity loan)
Houses without a mortgage: 24
Median household income for houses/condos with a mortgage: $87,115
Median household income for apartments without a mortgage: $66,695
Median monthly housing costs: $752
Compare current foreclosures near Vandling, PA:
| Photo | Address | Area | Beds / Baths | Price | Details |
|---|---|---|---|---|---|

|
#1
Burcher Ave
Clarks Summit, PA 18411
|
1,800 sq. feet
|
2 baths 3 beds |
$445,500
|
show details |

|
#2
Rachel Dr
Archbald, PA 18403
|
2,050 sq. feet
|
2 baths 3 beds |
show details | |

|
#3
Spring St
Carbondale, PA 18407
|
1,276 sq. feet
|
1 baths 3 beds |
show details | |

|
#4
Carbondale Rd
Waymart, PA 18472
|
2,187 sq. feet
|
2 baths 4 beds |
show details | |

|
#5
S Church St
Carbondale, PA 18407
|
3,100 sq. feet
|
3 baths 4 beds |
show details | |

|
#6
E Scott St
Olyphant, PA 18447
|
1,648 sq. feet
|
2 baths 2 beds |
show details | |

|
#7
Petrilak Rd
Carbondale, PA 18407
|
1,400 sq. feet
|
1 baths 3 beds |
show details | |

|
#8
S Main St
Archbald, PA 18403
|
1,529 sq. feet
|
2 baths 3 beds |
show details | |

|
#9
Lower Powderly St
Carbondale, PA 18407
|
- sq. feet
|
2 baths 3 beds |
show details | |

|
#10
Main St
Peckville, PA 18452
|
1,768 sq. feet
|
1 baths 4 beds |
show details |
| Photo | Address | Area | Beds / Baths | Price | Details |
|---|---|---|---|---|---|

|
#11
Shady Lane Rd
Clarks Summit, PA 18411
|
2,648 sq. feet
|
2 baths 5 beds |
show details | |

|
#12
Whitmore Ave
Jermyn, PA 18433
|
870 sq. feet
|
1 baths 2 beds |
show details | |

|
#13
5th St
Jermyn, PA 18433
|
2,100 sq. feet
|
1 baths 3 beds |
show details | |

|
#14
Opeil Rd
Jermyn, PA 18433
|
- sq. feet
|
2 baths 4 beds |
show details | |

|
#15
Van Leuven Rd
Lake Ariel, PA 18436
|
- sq. feet
|
2 baths 3 beds |
show details | |

|
#16
Poplar St
Dickson City, PA 18519
|
1,160 sq. feet
|
1 baths 3 beds |
show details | |

|
#17
Laurel Creek Dr
Dickson City, PA 18519
|
2,099 sq. feet
|
2 baths 4 beds |
show details | |

|
#18
Oak Dr
Hawley, PA 18428
|
1,066 sq. feet
|
1 baths 3 beds |
show details | |

|
#19
Grace St
Scranton, PA 18509
|
1,220 sq. feet
|
2 baths 4 beds |
show details | |

|
#20
Sanderson Ave
Olyphant, PA 18447
|
- sq. feet
|
1 baths 3 beds |
show details |
| Photo | Address | Area | Beds / Baths | Price | Details |
|---|---|---|---|---|---|

|
#21
Wilson St
Jessup, PA 18434
|
1,548 sq. feet
|
2 baths 3 beds |
show details | |

|
#22
Hamlin Hwy
Hamlin, PA 18427
|
1,180 sq. feet
|
1 baths 3 beds |
show details | |

|
#23
Elkview Dr
Forest City, PA 18421
|
1,080 sq. feet
|
1 baths 3 beds |
show details | |

|
#24
Reservoir St
Carbondale, PA 18407
|
- sq. feet
|
2 baths 6 beds |
show details | |

|
#25
Equinunk Creek Rd
Lakewood, PA 18439
|
1,650 sq. feet
|
2 baths 4 beds |
show details | |

|
#26
Holly Dr
Honesdale, PA 18431
|
1,920 sq. feet
|
2 baths 4 beds |
show details | |

|
#27
Main St
Archbald, PA 18403
|
- sq. feet
|
- baths - beds |
$24,900
|
show details |

|
#28
Woodcrest Ln
Lake Ariel, PA 18436
|
1,212 sq. feet
|
2 baths 4 beds |
show details | |

|
#29
Thomas St
Archbald, PA 18403
|
- sq. feet
|
2 baths 2 beds |
show details | |

|
#30
Prompton Rd
Prompton, PA 18456
|
1,610 sq. feet
|
1 baths 3 beds |
show details |
| Photo | Address | Area | Beds / Baths | Price | Details |
|---|---|---|---|---|---|

|
#31
Carney Rd
Honesdale, PA 18431
|
1,632 sq. feet
|
2 baths 4 beds |
show details | |

|
#32
Old Willow Ave
Honesdale, PA 18431
|
1,308 sq. feet
|
1 baths 3 beds |
show details | |

|
#33
Ridge St
Honesdale, PA 18431
|
1,004 sq. feet
|
1 baths 2 beds |
show details | |

|
#34
Samson Rd
Lake Ariel, PA 18436
|
1,560 sq. feet
|
1 baths 4 beds |
show details | |

|
#35
Salem View Dr
Waymart, PA 18472
|
1,664 sq. feet
|
2 baths 3 beds |
show details | |

|
#36
Volunteer Way
Waymart, PA 18472
|
1,008 sq. feet
|
1 baths 3 beds |
show details | |

|
#37
Creek Dr
Prompton, PA 18456
|
960 sq. feet
|
1 baths 3 beds |
show details | |

|
#38
The Hideout
Lake Ariel, PA 18436
|
952 sq. feet
|
2 baths 2 beds |
show details | |

|
#39
Skycrest Rd
Hawley, PA 18428
|
1,650 sq. feet
|
2 baths 3 beds |
show details | |

|
#40
Griffin Pond Rd
Clarks Summit, PA 18411
|
- sq. feet
|
2 baths 3 beds |
show details |
| Photo | Address | Area | Beds / Baths | Price | Details |
|---|---|---|---|---|---|

|
#41
Easy Rd
Moscow, PA 18444
|
1,433 sq. feet
|
2 baths 4 beds |
show details | |

|
#42
Willow Ln
Lake Ariel, PA 18436
|
1,330 sq. feet
|
1 baths 4 beds |
show details | |

|
#43
Grace St
Scranton, PA 18509
|
- sq. feet
|
- baths - beds |
$39,900
|
show details |

|
#44
The Hideout
Lake Ariel, PA 18436
|
1,590 sq. feet
|
3 baths 3 beds |
show details | |

|
#45
Cypress St
Scranton, PA 18512
|
- sq. feet
|
1 baths 3 beds |
show details | |

|
#46
Johnson Rd
Clarks Summit, PA 18411
|
- sq. feet
|
- baths - beds |
show details | |

|
#47
White Birch Park
Lake Ariel, PA 18436
|
- sq. feet
|
- baths - beds |
show details | |

|
#48
Rr 2 Box 2285
Lake Ariel, PA 18436
|
- sq. feet
|
- baths - beds |
show details | |

|
#49
Lake Ariel Hwy # B
Lake Ariel, PA 18436
|
- sq. feet
|
- baths - beds |
show details | |

|
Check over 1 million property listings on Foreclosure.com!
|
browse all offers | |||

Latest news about housing in Vandling, PA collected exclusively by city-data.com from local newspapers, TV, and radio stations

 | carbondale pa.......how is it? (81 replies) |
| Need to Sell (37 replies) |
| What Does Scranton Need to Undergo a Renaissance? (91 replies) |
| Forest City Info? (18 replies) |
| Looking for a Weekend Getaway (6 replies) |
| Analyzing Lackawanna County's Census Statistics (1990, 2000, 2008) (2 replies) |
Median year apartment built: 1967
Household type by relationship:
Households: 793- Male householders: 209 (58 living alone), Female householders: 135 (41 living alone)
177 spouses (177 opposite-sex spouses), 48 unmarried partners, (48 opposite-sex unmarried partners), 164 children (151 natural, 2 adopted, 9 stepchildren), 8 grandchildren, 0 brothers or sisters, 0 parents, 0 foster children, 41 other relatives, 4 non-relatives
Size of family households: 114 2-persons, 37 3-persons, 24 4-persons, 13 5-persons, 3 6-persons, 6 7-or-more-persons.
Size of nonfamily households: 106 1-person, 37 2-persons.
88 married couples with children.
31 single-parent households (9 men, 22 women).
97.1% of residents of Vandling speak English at home.
1.5% of residents speak Spanish at home (100% speak English very well).
0.8% of residents speak other language at home (100% speak English very well).
Foreign born population: 27 (3.4%)
(44.4% of them are naturalized citizens)
| Here: | 6.6 |
| State: | 6.8 |
| Here: | 6.1 |
| State: | 4.3 |
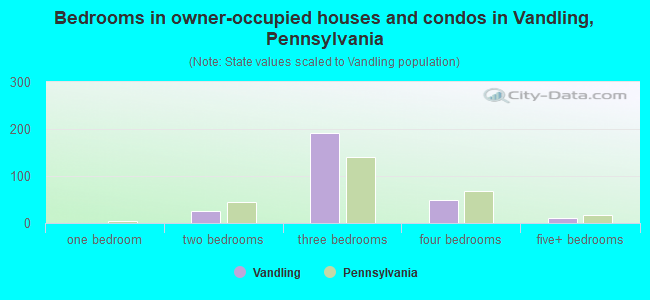
- Bedrooms in owner-occupied houses and condos in Vandling, Pennsylvania
- 0no bedroom
- 01 bedroom
- 252 bedrooms
- 1913 bedrooms
- 504 bedrooms
- 105+ bedrooms
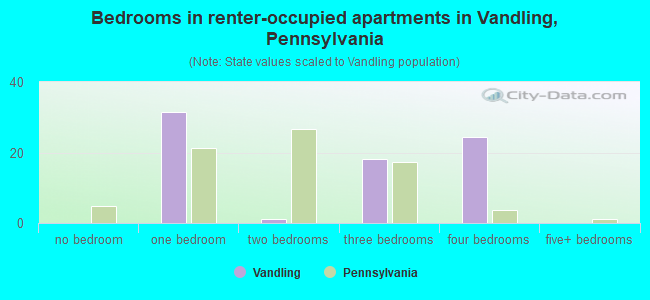
- Bedrooms in renter-occupied apartments in Vandling, Pennsylvania
- 0no bedroom
- 311 bedroom
- 12 bedrooms
- 183 bedrooms
- 244 bedrooms
- 05+ bedrooms
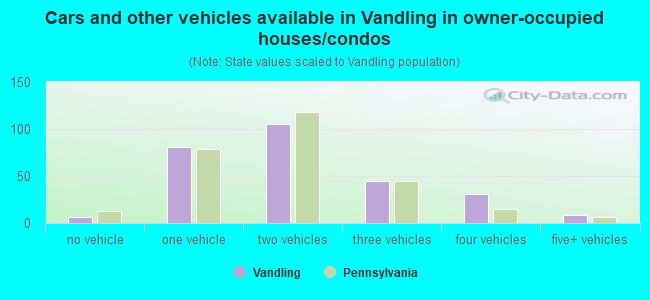
- Cars and other vehicles available in Vandling in owner-occupied houses/condos
- 6no vehicle
- 811 vehicle
- 1052 vehicles
- 453 vehicles
- 314 vehicles
- 85+ vehicles
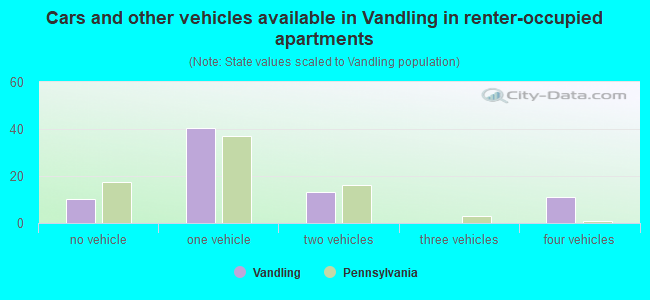
- Cars and other vehicles available in Vandling in renter-occupied apartments
- 10no vehicle
- 411 vehicle
- 132 vehicles
- 03 vehicles
- 114 vehicles
- 05+ vehicles
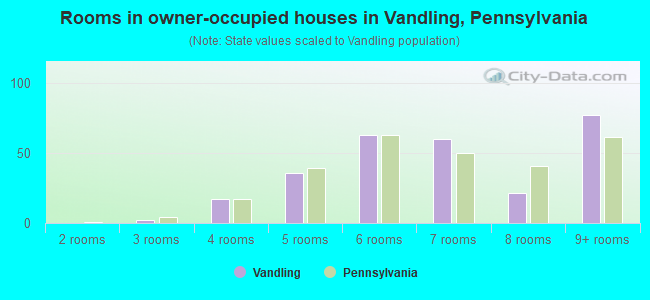
- Rooms in owner-occupied houses in Vandling, Pennsylvania
- 01 room
- 02 rooms
- 23 rooms
- 174 rooms
- 365 rooms
- 636 rooms
- 607 rooms
- 218 rooms
- 779+ rooms
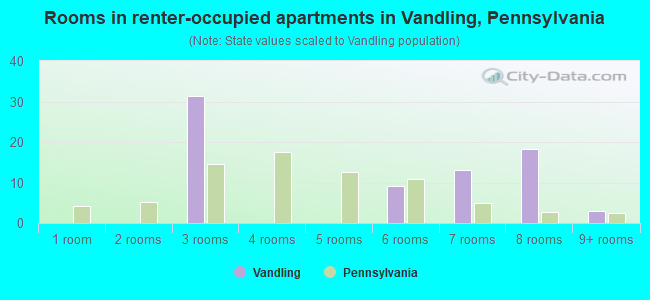
- Rooms in renter-occupied apartments in Vandling, Pennsylvania
- 01 room
- 02 rooms
- 313 rooms
- 04 rooms
- 05 rooms
- 96 rooms
- 137 rooms
- 188 rooms
- 39+ rooms
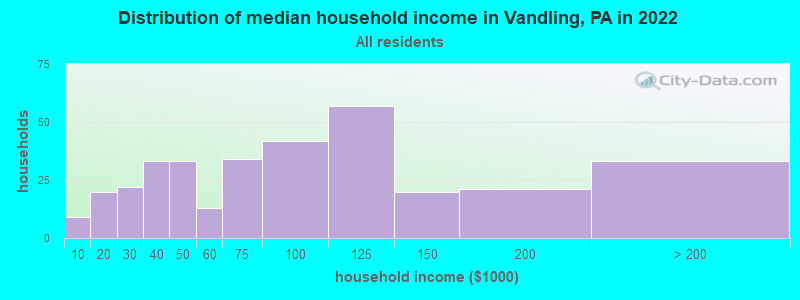
Vandling, PA household income distribution

- 9Less than $10,000
- 20$10,000 to $19,999
- 22$20,000 to $29,999
- 33$30,000 to $39,999
- 33$40,000 to $49,999
- 13$50,000 to $59,999
- 34$60,000 to $74,999
- 42$75,000 to $99,999
- 57$100,000 to $124,999
- 20$125,000 to $149,999
- 21$150,000 to $199,999
- 33$200,000 or more
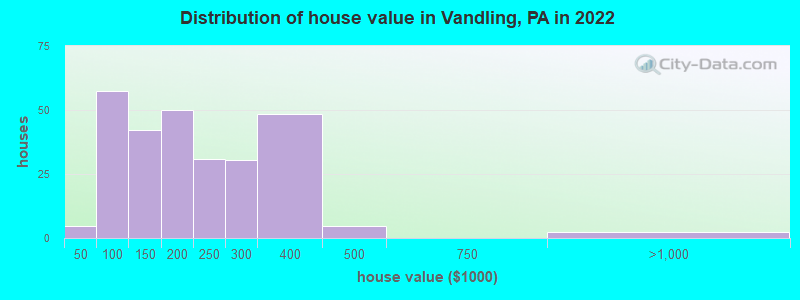
Home value of owner - occupied houses in 2022 in Vandling, PA
-
- 2$25,000 to $29,999
- 1$40,000 to $49,999
- 2$50,000 to $59,999
- 19$60,000 to $69,999
- 5$70,000 to $79,999
- 13$80,000 to $89,999
- 15$90,000 to $99,999
- 29$100,000 to $124,999
- 12$125,000 to $149,999
- 35$150,000 to $174,999
- 13$175,000 to $199,999
- 30$200,000 to $249,999
- 30$250,000 to $299,999
- 48$300,000 to $399,999
- 4$400,000 to $499,999
- 2$750,000 to $999,999
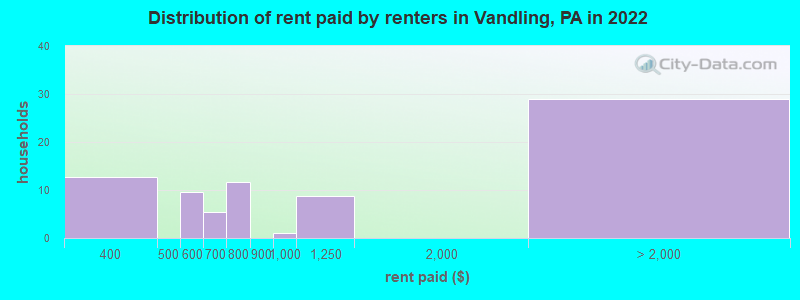
Rent paid by renters in 2022 in Vandling, PA
-
- 12$350 to $399
- 9$550 to $599
- 5$600 to $649
- 11$700 to $749
- 1$900 to $999
- 8$1,000 to $1,249
- 28No cash rent
Percentage of workers working in this county: 61.6%
Number of people working at home: 45 (11.7% of all workers)
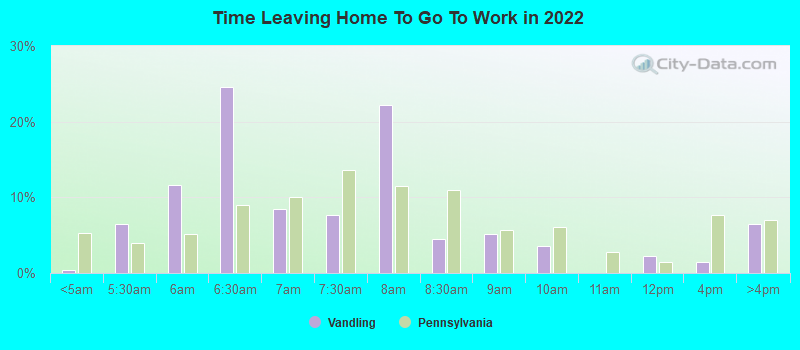
Travel time to work (commute)
- Less than 5 minutes: 26
- 5 to 9 minutes: 37
- 10 to 14 minutes: 15
- 15 to 19 minutes: 38
- 20 to 24 minutes: 7
- 25 to 29 minutes: 5
- 30 to 34 minutes: 55
- 35 to 39 minutes: 63
- 40 to 44 minutes: 0
- 45 to 59 minutes: 38
- 60 to 89 minutes: 32
- 90 or more minutes: 19
Means of transportation to work:
- Drove a car alone: 274 (83.0%)
- Carpooled: 47 (14.2%)
- Walked: 2 (0.6%)
- Worked at home: 7 (2.1%)
- Unemployment by race in 2022
- Unemployment rate for White non-Hispanic residents
- 5.1%Females
- Unemployment rate for two or more race residents
- 19.3%Males
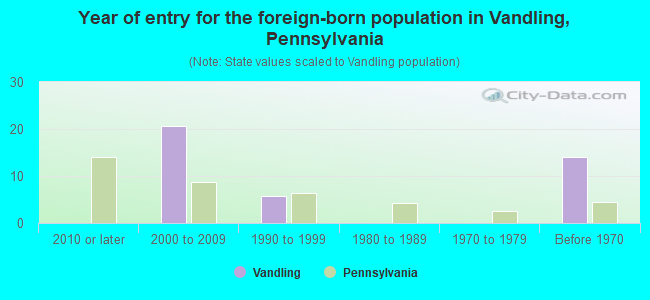
- Year of entry for the foreign-born population in Vandling, Pennsylvania
- 02010 or later
- 212000 to 2009
- 61990 to 1999
- 01980 to 1989
- 01970 to 1979
- 14Before 1970
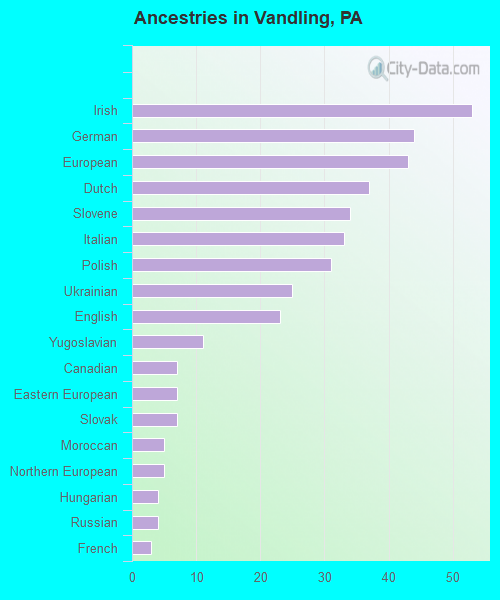
First ancestries reported:
- Irish: 53 (12.9%)
- German: 44 (10.7%)
- European: 43 (10.5%)
- Dutch: 37 (9.0%)
- Slovene: 34 (8.3%)
- Italian: 33 (8.0%)
- Polish: 31 (7.6%)
- Ukrainian: 25 (6.1%)
- English: 23 (5.6%)
- Yugoslavian: 11 (2.7%)
- Canadian: 7 (1.7%)
- Eastern European: 7 (1.7%)
- Slovak: 7 (1.7%)
- Moroccan: 5 (1.2%)
- Northern European: 5 (1.2%)
- Hungarian: 4 (1.0%)
- Russian: 4 (1.0%)
- French: 3 (0.7%)
Most common places of birth for foreign-born residents (%):
| Vandling: | 35.7% (10) |
| Pennsylvania: | 0.9% (8,463) |
| Vandling: | 35.7% (10) |
| Pennsylvania: | 1.8% (17,032) |
| Vandling: | 14.3% (4) |
| Pennsylvania: | 0.5% (4,483) |
Place of birth for U.S.-born residents:
- This state: 642
- Other state: 118
- Northeast: 71
- Midwest: 10
- South: 24
- West: 11
86.8% of Vandling residents lived in the same house 1 years ago.
Out of people who lived in different houses, 21.8% lived in this county.
Out of people who lived in different counties, 100.0% lived in Pennsylvania.
| Vandling: | 86.8% |
| State average: | 89.3% |
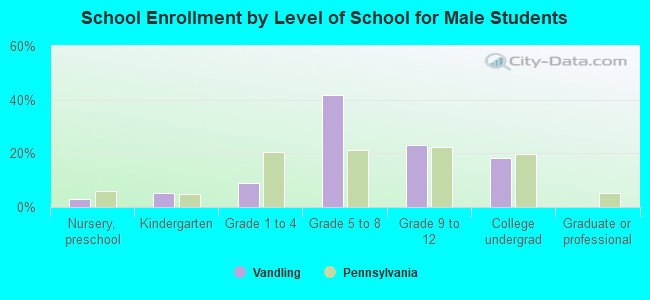
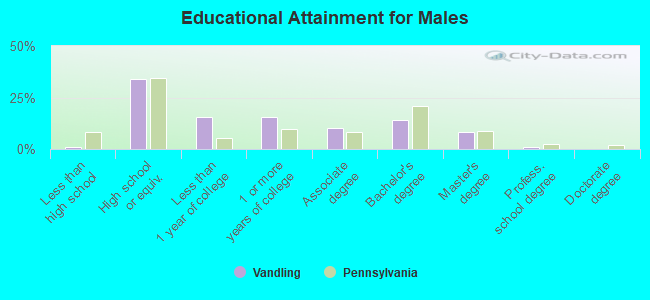
Education attainment for males 25 years and older:
- No schooling: 0
- Nursery to 4th grade: 0
- 5th and 6th grade: 0
- 7th and 8th grade: 1
- 9th grade: 0
- 10th grade: 2
- 11th grade: 0
- 12th grade, no diploma: 0
- High school graduate (or equivalency): 106
- Less than 1 year of college: 49
- Some college more than 1 year, no degree: 49
- Associate degree: 31
- Bachelor's degree: 44
- Master's degree: 26
- Professional school degree: 3
- Doctorate degree: 0
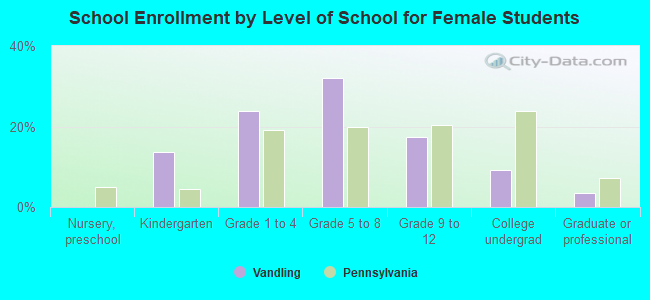
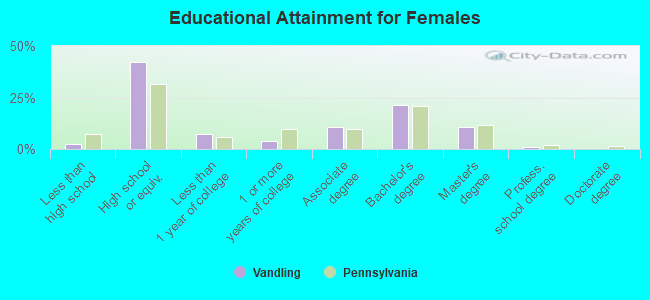
Education attainment for females 25 years and older:
- No schooling: 3
- Nursery to 4th grade: 0
- 5th and 6th grade: 0
- 7th and 8th grade: 0
- 9th grade: 0
- 10th grade: 0
- 11th grade: 0
- 12th grade, no diploma: 4
- High school graduate (or equivalency): 116
- Less than 1 year of college: 20
- Some college more than 1 year, no degree: 11
- Associate degree: 30
- Bachelor's degree: 59
- Master's degree: 30
- Professional school degree: 3
- Doctorate degree: 0

Housing units in structures:
- One, detached: 317
- One, attached: 11
- Two: 2
- 3 or 4: 6
- 5 to 9: 42
- Mobile homes: 6
Housing units lacking complete kitchen facilities in 2022: 3.6%
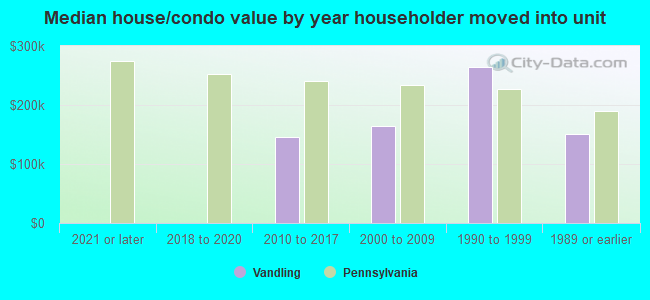
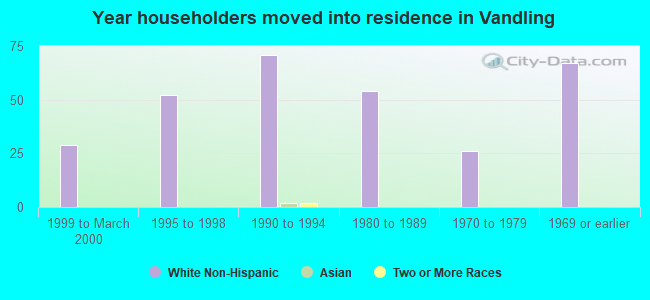
House/condo owner moved in on average 24 years ago
Renter moved in on average 1 years ago
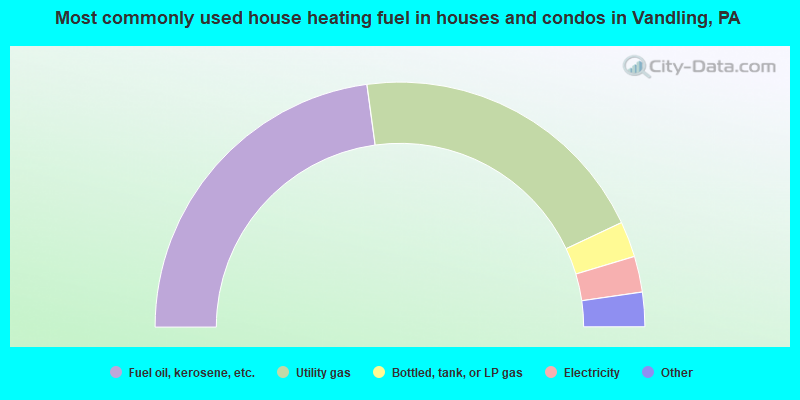
- 46.3%Fuel oil, kerosene, etc.
- 40.8%Utility gas
- 4.8%Bottled, tank, or LP gas
- 4.8%Electricity
- 2.6%Other fuel
- 0.7%Wood
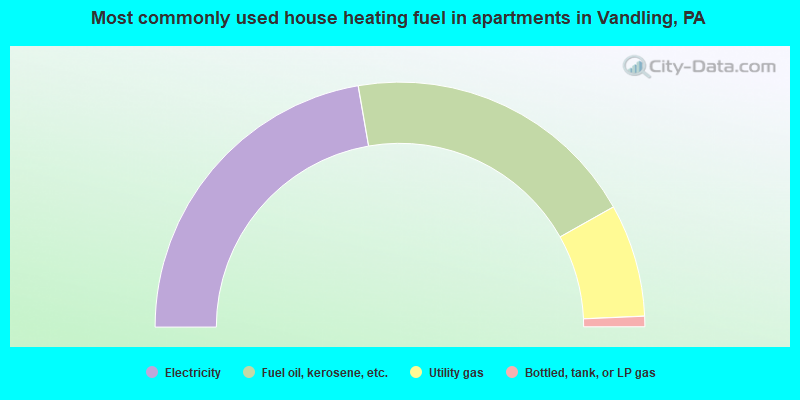
- 44.6%Electricity
- 39.2%Fuel oil, kerosene, etc.
- 14.9%Utility gas
- 1.4%Bottled, tank, or LP gas
Private vs. public school enrollment:
| Here: | 54.1% |
| Pennsylvania: | 15.7% |
| Here: | 34.5% |
| Pennsylvania: | 13.4% |
| Here: | 30.4% |
| Pennsylvania: | 39.8% |