Vermillion, SD (South Dakota) Houses and Residents
Estimated median house or condo value in 2022: $214,752 (it was $73,300 in 2000 )
Vermillion:
$214,752South Dakota:
$245,000
Lower value quartile - upper value quartile: $164,528 - $297,915Mean price in 2022: Detached houses: $237,052 Here:
$237,052State:
$303,134
Townhouses or other attached units: $343,986 Here:
$343,986State:
$292,182
Mobile homes: $186,049 Here:
$186,049State:
$82,732
Total population: 10,699 (Urban population: 9,649 (all inside urban clusters), Rural population: 79 (all nonfarm) )
Houses: 4,613 (4,153 occupied: 1,734 owner occupied, 2,500 renter occupied )
% of renters here:
59%State:
30%
Housing density: 1,204 houses/condos per square mile
Median price asked for vacant for-sale houses and condos in 2022 in this county: $297,008.
Median contract rent in 2022: $662 (lower quartile is $497, upper quartile is $806)
Median rent asked for vacant for-rent units in 2022: $862
Median gross rent in Vermillion, SD in 2022: $735
Housing units in Vermillion with a mortgage: 1,073 (136 second mortgage, 0 home equity loan, 84 both second mortgage and home equity loan )Houses without a mortgage: 0
Median household income for houses/condos with a mortgage: $104,828
Median household income for apartments without a mortgage: $79,655
Median monthly housing costs: $828
Data:
Median house or condo value ($)
Median house or condo value ($ change since 2000)
Median house or condo value ($) - White
Median house or condo value ($) - Black or African American
Median house or condo value ($) - Asian
Median house or condo value ($) - Hispanic or Latino
Median house or condo value ($) - American Indian and Alaska Native
Median house or condo value ($) - Multirace
Median house or condo value ($) - Other Race
Median price asked for mobile homes ($)
Household density (households per square mile)
Mean house or condo value by units in structure - 1, detached ($)
Mean house or condo value by units in structure - 1, attached ($)
Mean house or condo value by units in structure - 2 ($)
Mean house or condo value by units in structure by units in structure - 3 or 4 ($)
Mean house or condo value by units in structure - 5 or more ($)
Mean house or condo value by units in structure - Boat, RV, van, etc. ($)
Mean house or condo value by units in structure - Mobile home ($)
Median contract rent ($)
Median contract rent - Lower quartile ($)
Median contract rent - Upper quartile ($)
Median gross rent ($)
Urban houses (%)
Rural houses (%)
Houses occupied (%)
Houses occupied (% change since 2000)
Houses owner occupied (%)
Houses owner occupied (% change since 2000)
Houses renter occupied (%)
Houses renter occupied (% change since 2000)
Vacant housing units - For rent (%)
Vacant housing units - For rent (% change since 2000)
Vacant housing units - For sale only (%)
Vacant housing units - For sale only (% change since 2000)
Vacant housing units - Rented or sold, not occupied (%)
Vacant housing units - Rented or sold, not occupied (% change since 2000)
Vacant housing units - For seasonal, recreational, or occasional use (%)
Vacant housing units - For seasonal, recreational, or occasional use (% change since 2000)
Vacant housing units - For migrant workers (%)
Vacant housing units - For migrant workers (% change since 2000)
Vacant housing units - Other vacant (%)
Vacant housing units - Other vacant (% change since 2000)
Median monthly housing costs ($)
Median household income for houses/condos with a mortgage ($)
Median household income for houses/condos without a mortgage ($)
Median household income ($)
Median household income ($) - White
Median household income ($) - Black or African American
Median household income ($) - Asian
Median household income ($) - Hispanic or Latino
Median household income ($) - American Indian and Alaska Native
Median household income ($) - Multirace
Median household income ($) - Other Race
Mortgage status - with mortgage (%)
Mortgage status - with second mortgage (%)
Mortgage status - with home equity loan (%)
Mortgage status - with both second mortgage and home equity loan (%)
Mortgage status - without a mortgage (%)
Median year house/condo built
Median year apartment built
Household type by relationship - Male householder living alone (%)
Household type by relationship - Male householder not living alone (%)
Household type by relationship - Female householder living alone (%)
Household type by relationship - Female householder not living alone (%)
Household type by relationship - Opposite-Sex spouse (%)
Household type by relationship - Same-Sex spouse (%)
Household type by relationship - Opposite-Sex unmarried partner (%)
Household type by relationship - Same-Sex unmarried partner (%)
Household type by relationship - In group quarters (%)
Size of family households - 2-person household (%)
Size of family households - 3-person household (%)
Size of family households - 4-person household (%)
Size of family households - 5-person household (%)
Size of family households - 6-person household (%)
Size of family households - 7-or-more-person household (%)
Size of nonfamily households - 1-person household (%)
Size of nonfamily households - 2-person household (%)
Size of nonfamily households - 3-person household (%)
Size of nonfamily households - 4-person household (%)
Size of nonfamily households - 5-person household (%)
Size of nonfamily households - 6-person household (%)
Size of nonfamily households - 7-or-moreperson household (%)
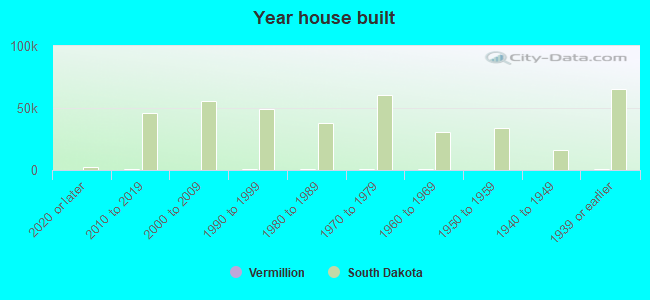
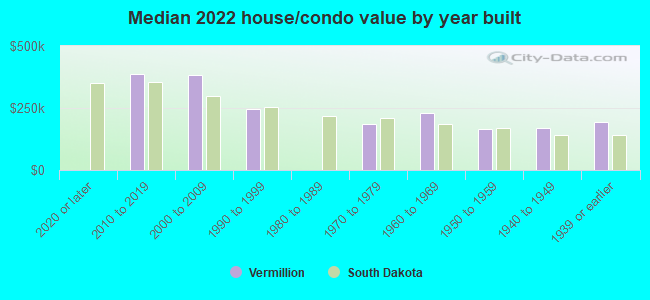
Year house built - Built 2010 or later (%)
Year house built - Built 2000 to 2009 (%)
Year house built - Built 1990 to 1999 (%)
Year house built - Built 1980 to 1989 (%)
Year house built - Built 1970 to 1979 (%)
Year house built - Built 1960 to 1969 (%)
Year house built - Built 1950 to 1959 (%)
Year house built - Built 1940 to 1949 (%)
Year house built - Built 1939 or earlier (%)
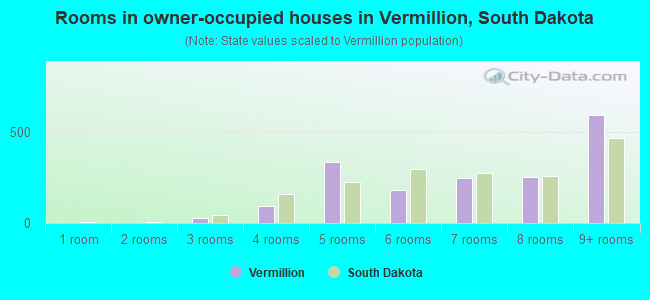
Median number of rooms in houses and condos
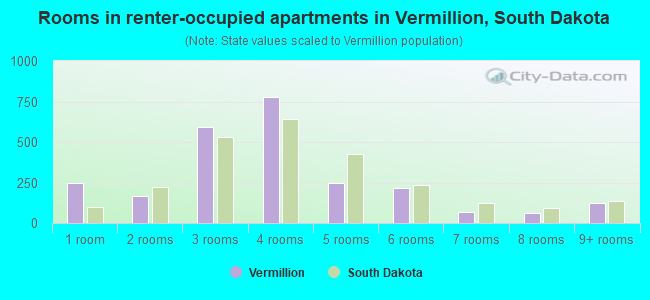
Median number of rooms in apartments
Median number of bedrooms in owner occupied houses
Mean number of bedrooms in owner occupied houses
Median number of bedrooms in renter occupied houses
Mean number of bedrooms in renter occupied houses
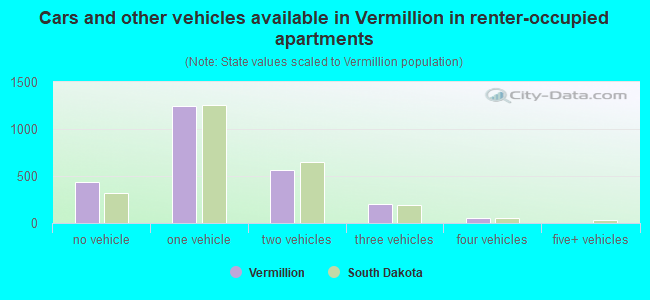
Median number of vehichles in owner occupied houses
Mean number of vehichles in owner occupied houses
Median number of vehichles in renter occupied houses
Mean number of vehichles in renter occupied houses
Rooms in owner-occupied houses - 1 room (%)
Rooms in owner-occupied houses - 2 rooms (%)
Rooms in owner-occupied houses - 3 rooms (%)
Rooms in owner-occupied houses - 4 rooms (%)
Rooms in owner-occupied houses - 5 rooms (%)
Rooms in owner-occupied houses - 6 rooms (%)
Rooms in owner-occupied houses - 7 rooms (%)
Rooms in owner-occupied houses - 8 rooms (%)
Rooms in owner-occupied houses - 9+ rooms (%)
Rooms in renter-occupied houses - 1 room (%)
Rooms in renter-occupied houses - 2 rooms (%)
Rooms in renter-occupied houses - 3 rooms (%)
Rooms in renter-occupied houses - 4 rooms (%)
Rooms in renter-occupied houses - 5 rooms (%)
Rooms in renter-occupied houses - 6 rooms (%)
Rooms in renter-occupied houses - 7 rooms (%)
Rooms in renter-occupied houses - 8 rooms (%)
Rooms in renter-occupied houses - 9+ rooms (%)
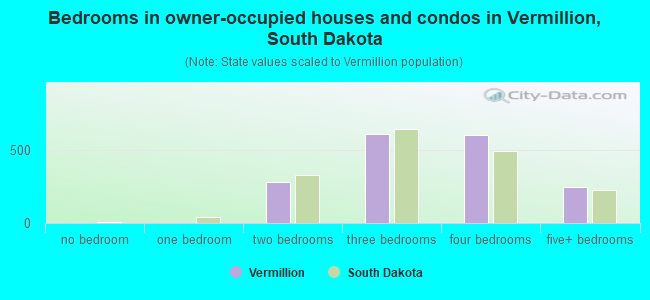
Bedrooms in owner-occupied houses - no bedrooms (%)
Bedrooms in owner-occupied houses - 1 bedroom (%)
Bedrooms in owner-occupied houses - 2 bedrooms (%)
Bedrooms in owner-occupied houses - 3 bedrooms (%)
Bedrooms in owner-occupied houses - 4 bedrooms (%)
Bedrooms in owner-occupied houses - 5+ bedrooms (%)
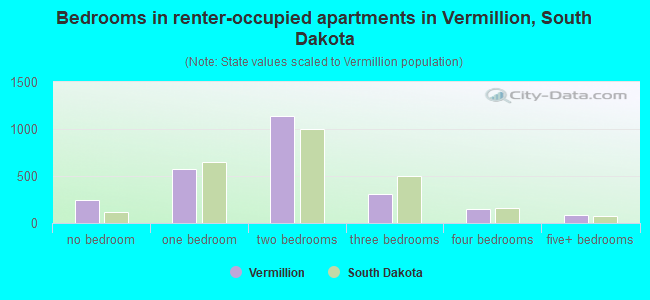
Bedrooms in renter-occupied houses - no bedrooms (%)
Bedrooms in renter-occupied houses - 1 bedroom (%)
Bedrooms in renter-occupied houses - 2 bedrooms (%)
Bedrooms in renter-occupied houses - 3 bedrooms (%)
Bedrooms in renter-occupied houses - 4 bedrooms (%)
Bedrooms in renter-occupied houses - 5+ bedrooms (%)
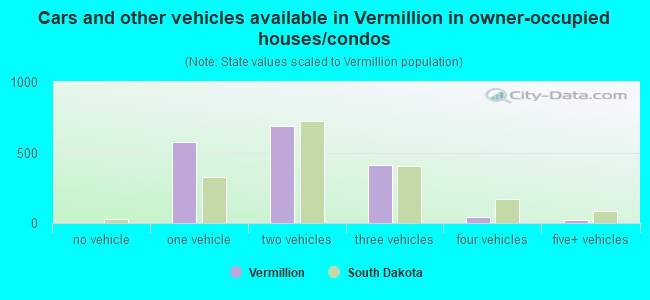
Vehicles available in owner-occupied houses - no vehicle available (%)
Vehicles available in owner-occupied houses - 1 vehicle available(%)
Vehicles available in owner-occupied houses - 2 Vehicles available (%)
Vehicles available in owner-occupied houses - 3 Vehicles available (%)
Vehicles available in owner-occupied houses - 4 Vehicles available (%)
Vehicles available in owner-occupied houses - 5+ Vehicles available (%)
Vehicles available in renter-occupied houses - no vehicle available (%)
Vehicles available in renter-occupied houses - 1 vehicle available (%)
Vehicles available in renter-occupied houses - 2 Vehicles available (%)
Vehicles available in renter-occupied houses - 3 Vehicles available (%)
Vehicles available in renter-occupied houses - 4 Vehicles available (%)
Vehicles available in renter-occupied houses - 5+ Vehicles available (%)
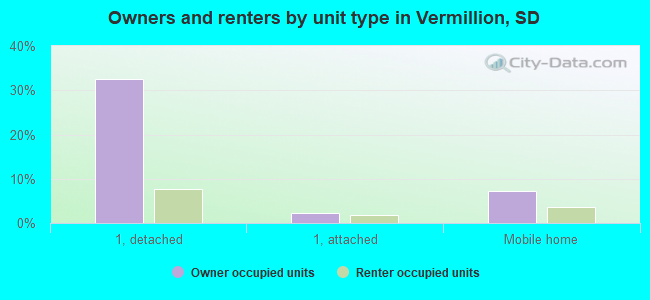
Housing units in structures - 1, detached (%)
Housing units in structures - 1, attached (%)
Housing units in structures - 2 (%)
Housing units in structures - 3 or 4 (%)
Housing units in structures - 5 to 9 (%)
Housing units in structures - 10 to 19 (%)
Housing units in structures - 20 to 49 (%)
Housing units in structures - 50 or more (%)
Housing units in structures - Mobile home (%)
Housing units in structures - Boat, RV, van, etc. (%)
Housing units in structures - Owners - 1, detached (%)
Housing units in structures - Owners - 1, attached (%)
Housing units in structures - Owners - 2 (%)
Housing units in structures - Owners - 3 or 4 (%)
Housing units in structures - Owners - 5 to 9 (%)
Housing units in structures - Owners - 10 to 19 (%)
Housing units in structures - Owners - 20 to 49 (%)
Housing units in structures - Owners - 50 or more (%)
Housing units in structures - Owners - Mobile home (%)
Housing units in structures - Owners - Boat, RV, van, etc. (%)
Housing units in structures - Renters - 1, detached (%)
Housing units in structures - Renters - 1, attached (%)
Housing units in structures - Renters - 2 (%)
Housing units in structures - Renters - 3 or 4 (%)
Housing units in structures - Renters - 5 to 9 (%)
Housing units in structures - Renters - 10 to 19 (%)
Housing units in structures - Renters - 20 to 49 (%)
Housing units in structures - Renters - 50 or more (%)
Housing units in structures - Renters - Mobile home (%)
Housing units in structures - Renters - Boat, RV, van, etc. (%)
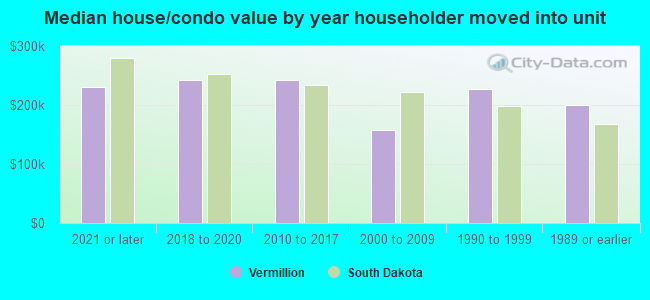
House/condo owner moved in on average (years ago)
Renter moved in on average (years ago)
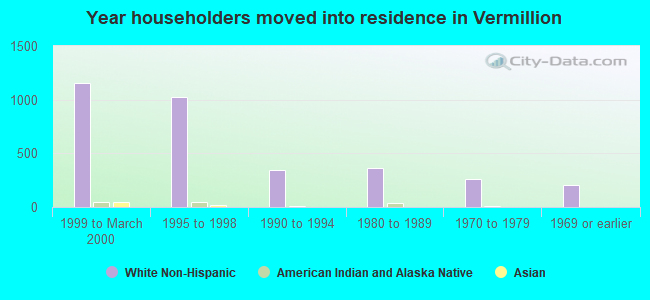
Year householder moved into unit - Moved in 1999 to March 2000 (%)
Year householder moved into unit - Moved in 1999 to March 2000 (%) - White
Year householder moved into unit - Moved in 1999 to March 2000 (%) - Black or African American
Year householder moved into unit - Moved in 1999 to March 2000 (%) - Asian
Year householder moved into unit - Moved in 1999 to March 2000 (%) - Hispanic or Latino
Year householder moved into unit - Moved in 1999 to March 2000 (%) - American Indian and Alaska Native
Year householder moved into unit - Moved in 1999 to March 2000 (%) - Multirace
Year householder moved into unit - Moved in 1999 to March 2000 (%) - Other Race
Year householder moved into unit - Moved in 1995 to 1998 (%)
Year householder moved into unit - Moved in 1995 to 1998 (%) - White
Year householder moved into unit - Moved in 1995 to 1998 (%) - Black or African American
Year householder moved into unit - Moved in 1995 to 1998 (%) - Asian
Year householder moved into unit - Moved in 1995 to 1998 (%) - Hispanic or Latino
Year householder moved into unit - Moved in 1995 to 1998 (%) - American Indian and Alaska Native
Year householder moved into unit - Moved in 1995 to 1998 (%) - Multirace
Year householder moved into unit - Moved in 1995 to 1998 (%) - Other Race
Year householder moved into unit - Moved in 1990 to 1994 (%)
Year householder moved into unit - Moved in 1990 to 1994 (%) - White
Year householder moved into unit - Moved in 1990 to 1994 (%) - Black or African American
Year householder moved into unit - Moved in 1990 to 1994 (%) - Asian
Year householder moved into unit - Moved in 1990 to 1994 (%) - Hispanic or Latino
Year householder moved into unit - Moved in 1990 to 1994 (%) - American Indian and Alaska Native
Year householder moved into unit - Moved in 1990 to 1994 (%) - Multirace
Year householder moved into unit - Moved in 1990 to 1994 (%) - Other Race
Year householder moved into unit - Moved in 1980 to 1989 (%)
Year householder moved into unit - Moved in 1980 to 1989 (%) - White
Year householder moved into unit - Moved in 1980 to 1989 (%) - Black or African American
Year householder moved into unit - Moved in 1980 to 1989 (%) - Asian
Year householder moved into unit - Moved in 1980 to 1989 (%) - Hispanic or Latino
Year householder moved into unit - Moved in 1980 to 1989 (%) - American Indian and Alaska Native
Year householder moved into unit - Moved in 1980 to 1989 (%) - Multirace
Year householder moved into unit - Moved in 1980 to 1989 (%) - Other Race
Year householder moved into unit - Moved in 1970 to 1979 (%)
Year householder moved into unit - Moved in 1970 to 1979 (%) - White
Year householder moved into unit - Moved in 1970 to 1979 (%) - Black or African American
Year householder moved into unit - Moved in 1970 to 1979 (%) - Asian
Year householder moved into unit - Moved in 1970 to 1979 (%) - Hispanic or Latino
Year householder moved into unit - Moved in 1970 to 1979 (%) - American Indian and Alaska Native
Year householder moved into unit - Moved in 1970 to 1979 (%) - Multirace
Year householder moved into unit - Moved in 1970 to 1979 (%) - Other Race
Year householder moved into unit - Moved in 1969 or earlier (%)
Year householder moved into unit - Moved in 1969 or earlier (%) - White
Year householder moved into unit - Moved in 1969 or earlier (%) - Black or African American
Year householder moved into unit - Moved in 1969 or earlier (%) - Asian
Year householder moved into unit - Moved in 1969 or earlier (%) - Hispanic or Latino
Year householder moved into unit - Moved in 1969 or earlier (%) - American Indian and Alaska Native
Year householder moved into unit - Moved in 1969 or earlier (%) - Multirace
Year householder moved into unit - Moved in 1969 or earlier (%) - Other Race
Housing units lacking complete plumbing facilities (%)
Housing units lacking complete kitchen facilities (%)
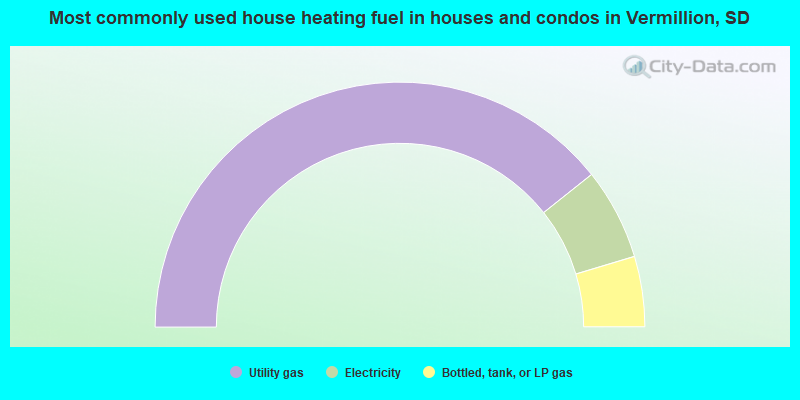
House heating fuel used in houses and condos - Utility gas (%)
House heating fuel used in houses and condos - Bottled, tank, or LP gas (%)
House heating fuel used in houses and condos - Electricity (%)
House heating fuel used in houses and condos - Fuel oil, kerosene, etc. (%)
House heating fuel used in houses and condos - Coal or coke (%)
House heating fuel used in houses and condos - Wood (%)
House heating fuel used in houses and condos - Solar energy (%)
House heating fuel used in houses and condos - Other fuel (%)
House heating fuel used in houses and condos - No fuel used (%)
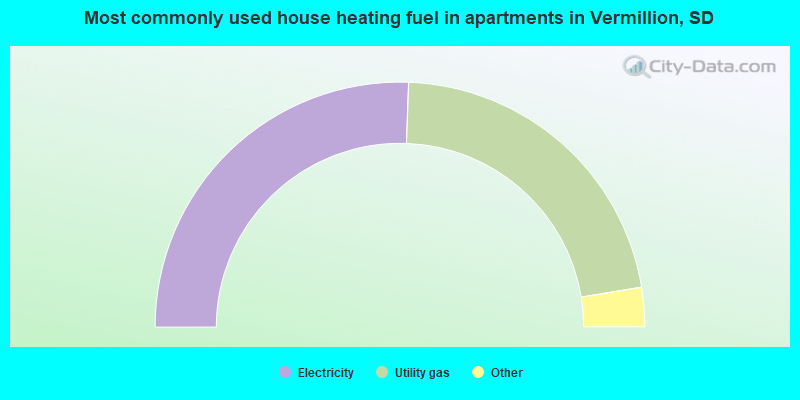
House heating fuel used in apartments - Utility gas (%)
House heating fuel used in apartments - Bottled, tank, or LP gas (%)
House heating fuel used in apartments - Electricity (%)
House heating fuel used in apartments - Fuel oil, kerosene, etc. (%)
House heating fuel used in apartments - Coal or coke (%)
House heating fuel used in apartments - Wood (%)
House heating fuel used in apartments - Solar energy (%)
House heating fuel used in apartments - Other fuel (%)
House heating fuel used in apartments - No fuel used (%)
Latest news about housing in Vermillion, SD collected exclusively by city-data.com from local newspapers, TV, and radio stations
Median year house/condo built: 1973Median year apartment built: 1988Household type by relationship:
Households: 11,922
Male householders: 2,206 (811 living alone ), Female householders: 1,920 (657 living alone )1,297 spouses (1,269 opposite-sex spouses ), 695 unmarried partners , (673 opposite-sex unmarried partners ), 2,038 children (1,801 natural , 52 adopted , 184 stepchildren ), 74 grandchildren , 85 brothers or sisters , 53 parents , 0 foster children , 97 other relatives , 1,177 non-relatives In group quarters: 2,275
Size of family households: 749 2-persons , 602 3-persons , 251 4-persons , 204 5-persons , 47 6-persons , 10 7-or-more-persons .
Size of nonfamily households: 1,557 1-person , 570 2-persons , 132 3-persons , 90 4-persons .
1,052 married couples with children. single-parent households (364 men , 343 women ).
93.0% of residents of Vermillion speak English at home. of residents speak Spanish at home (90% speak English very well , 10% speak English not well ).of residents speak other Indo-European language at home (76% speak English very well , 24% speak English well ).of residents speak Asian or Pacific Island language at home (42% speak English very well , 35% speak English well , 23% speak English not well ).of residents speak other language at home (90% speak English very well , 10% speak English well ).
Foreign born population: 527 (4.4%)of them are naturalized citizens )
Median number of rooms in houses and condos:
Median number of rooms in apartments
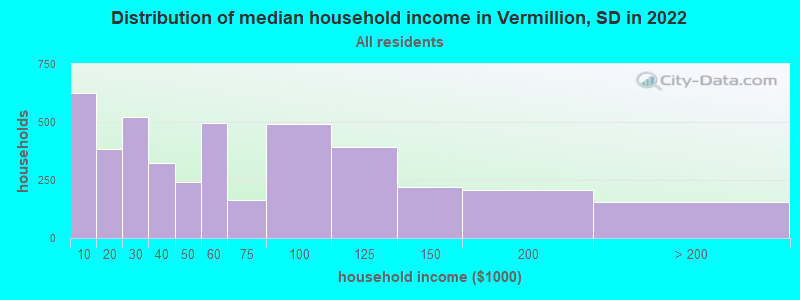
Vermillion, SD household income distribution 627 Less than $10,000385 $10,000 to $19,999523 $20,000 to $29,999324 $30,000 to $39,999242 $40,000 to $49,999494 $50,000 to $59,999163 $60,000 to $74,999491 $75,000 to $99,999391 $100,000 to $124,999220 $125,000 to $149,999206 $150,000 to $199,999156 $200,000 or more
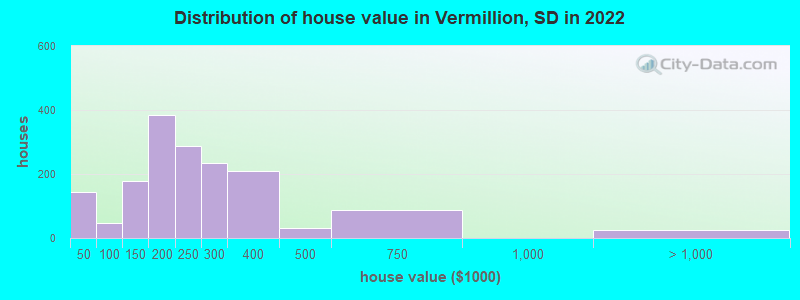
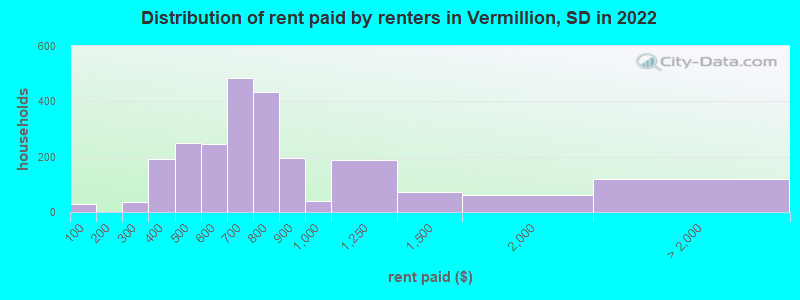
Home value of owner - occupied houses in 2022 in Vermillion, SD 125 Less than $10,00017 $10,000 to $14,99922 $70,000 to $79,9998 $80,000 to $89,99917 $90,000 to $99,99915 $100,000 to $124,999162 $125,000 to $149,999254 $150,000 to $174,999128 $175,000 to $199,999286 $200,000 to $249,999234 $250,000 to $299,999207 $300,000 to $399,99930 $400,000 to $499,99988 $500,000 to $749,99925 $2,000,000 or moreRent paid by renters in 2022 in Vermillion, SD 28 Less than $10036 $250 to $299191 $350 to $39962 $400 to $449185 $450 to $499186 $500 to $54960 $550 to $599373 $600 to $649111 $650 to $699132 $700 to $749300 $750 to $799196 $800 to $89938 $900 to $999188 $1,000 to $1,24972 $1,250 to $1,49959 $1,500 to $1,999121 No cash rent
Percentage of workers working in this county: 78.4%Number of people working at home: 391 (6.7% of all workers )
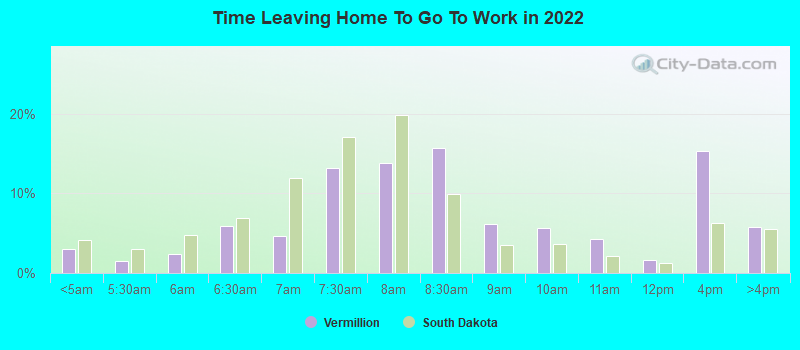
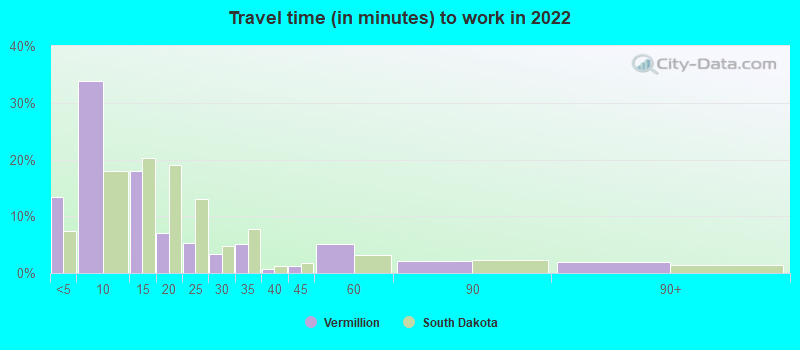
Travel time to work (commute)
Less than 5 minutes: 7575 to 9 minutes: 1,93310 to 14 minutes: 87215 to 19 minutes: 37420 to 24 minutes: 10325 to 29 minutes: 12430 to 34 minutes: 29035 to 39 minutes: 12740 to 44 minutes: 9445 to 59 minutes: 25060 to 89 minutes: 13190 or more minutes: 146
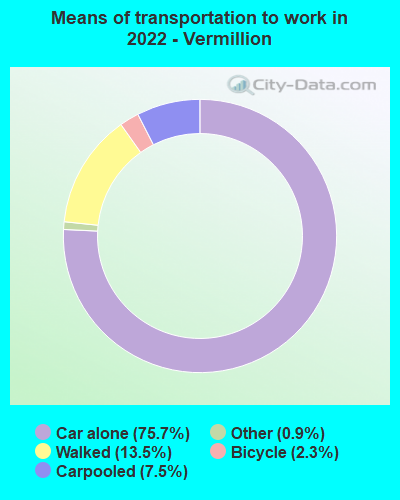
Means of transportation to work:
Drove a car alone: 4,116 (71.1%)Carpooled: 373 (6.4%)Bus : 3 (0.1%)Taxi: 58 (1.0%)Bicycle: 84 (1.5%)Walked: 597 (10.3%)Worked at home: 391 (6.8%)
Unemployment by race in 2022
Unemployment rate for White non-Hispanic residents 13.0% Males3.9% FemalesUnemployment rate for Black residents 4.4% FemalesUnemployment rate for Asian residents 13.1% Males35.9% FemalesUnemployment rate for two or more race residents 18.3% Males10.3% FemalesUnemployment rate for Hispanic or Latino residents 8.8% Females
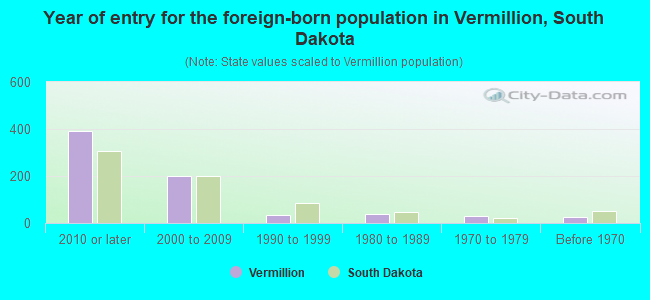
Year of entry for the foreign-born population in Vermillion, South Dakota
392 2010 or later 199 2000 to 2009 33 1990 to 1999 38 1980 to 1989 28 1970 to 1979 25 Before 1970
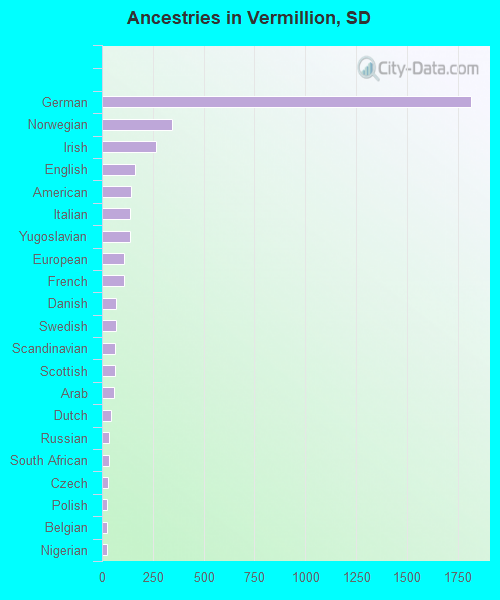
First ancestries reported:
German: 1,813 (40.5%)
Norwegian: 344 (7.7%)
Irish: 266 (5.9%)
English: 163 (3.6%)
American: 143 (3.2%)
Italian: 139 (3.1%)
Yugoslavian: 138 (3.1%)
European: 109 (2.4%)
French: 109 (2.4%)
Danish: 71 (1.6%)
Swedish: 68 (1.5%)
Scandinavian: 66 (1.5%)
Scottish: 64 (1.4%)
Arab: 57 (1.3%)
Dutch: 42 (0.9%)
Russian: 34 (0.8%)
South African: 34 (0.8%)
Czech: 31 (0.7%)
Polish: 26 (0.6%)
Belgian: 25 (0.6%)
Nigerian: 24 (0.5%)
Northern European: 16 (0.4%)
Scotch-Irish: 15 (0.3%)
Lebanese: 12 (0.3%)
Sudanese: 11 (0.2%)
Welsh: 11 (0.2%)
Haitian: 11 (0.2%)
Finnish: 10 (0.2%)
Ethiopian: 10 (0.2%)
African: 10 (0.2%)
Romanian: 8 (0.2%)
Belizean: 3 (0.07%) Most common places of birth for foreign-born residents (%): China, excluding Hong Kong and Taiwan Vermillion:
24.7% (143)South Dakota:
2.7% (905)
Bangladesh Vermillion:
11.2% (65)South Dakota:
0.4% (134)
Haiti Vermillion:
10.2% (59)South Dakota:
0.2% (75)
Vietnam Vermillion:
8.3% (48)South Dakota:
1.5% (510)
Egypt Vermillion:
7.6% (44)South Dakota:
1.0% (325)
Philippines Vermillion:
6.4% (37)South Dakota:
4.9% (1,663)
Other Eastern Europe Vermillion:
4.1% (24)South Dakota:
1.0% (330)
Peru Vermillion:
4.0% (23)South Dakota:
0.4% (125)
Nigeria Vermillion:
3.8% (22)South Dakota:
0.4% (152)
Belize Vermillion:
3.8% (22)South Dakota:
0.1% (22)
Canada Vermillion:
3.8% (22)South Dakota:
3.3% (1,125)
India Vermillion:
3.1% (18)South Dakota:
4.0% (1,373)
Germany Vermillion:
1.9% (11)South Dakota:
1.8% (624)
Togo Vermillion:
1.7% (10)South Dakota:
0.1% (33)
Place of birth for U.S.-born residents:
This state: 5,613Other state: 5,816Northeast: 393Midwest: 3,504South: 882West: 1,021 58.0% of Vermillion residents lived in the same house 1 years ago.
Out of people who lived in different houses, 30.0% lived in this county.
Out of people who lived in different counties, 50.6% lived in South Dakota.
Vermillion:
58.0%State average:
86.6%
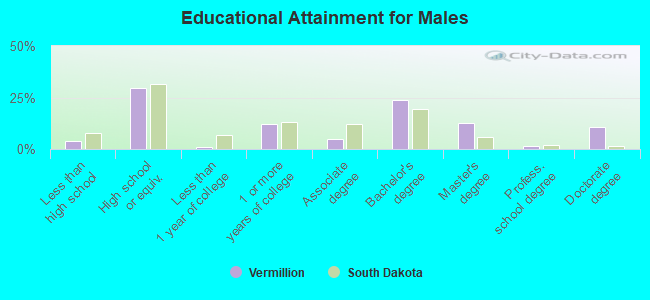
Education attainment for males 25 years and older:
No schooling: 29Nursery to 4th grade: 05th and 6th grade: 07th and 8th grade: 459th grade: 010th grade: 1511th grade: 1712th grade, no diploma: 0High school graduate (or equivalency): 786Less than 1 year of college: 30Some college more than 1 year, no degree: 317Associate degree: 132Bachelor's degree: 636Master's degree: 337Professional school degree: 39Doctorate degree: 278
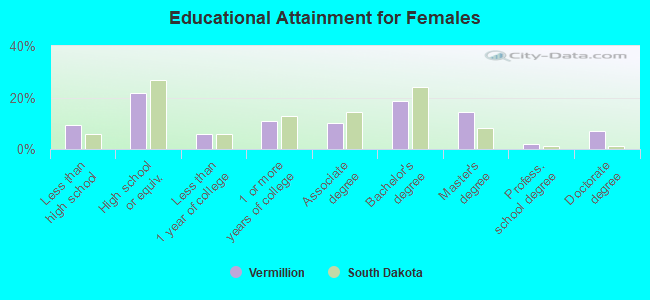
Education attainment for females 25 years and older:
No schooling: 20Nursery to 4th grade: 95th and 6th grade: 47th and 8th grade: 79th grade: 1010th grade: 6711th grade: 4912th grade, no diploma: 51High school graduate (or equivalency): 509Less than 1 year of college: 138Some college more than 1 year, no degree: 254Associate degree: 238Bachelor's degree: 437Master's degree: 339Professional school degree: 47Doctorate degree: 165
Housing units in structures:
One, detached: 2,009One, attached: 228Two: 1163 or 4: 4735 to 9: 55810 to 19: 74920 to 49: 13950 or more: 58Mobile homes: 279Median worth of mobile homes: $11,657
Housing units lacking complete plumbing facilities in 2022: 1.4%Housing units lacking complete kitchen facilities in 2022: 2.0%Private vs. public school enrollment:
Students in private schools in grades 1 to 8 (elementary and middle school): 72 Here:
7.6%South Dakota:
11.9%
Students in private schools in grades 9 to 12 (high school): 26 Here:
5.9%South Dakota:
7.2%
Students in private undergraduate colleges: 40 Here:
1.0%South Dakota:
10.2%