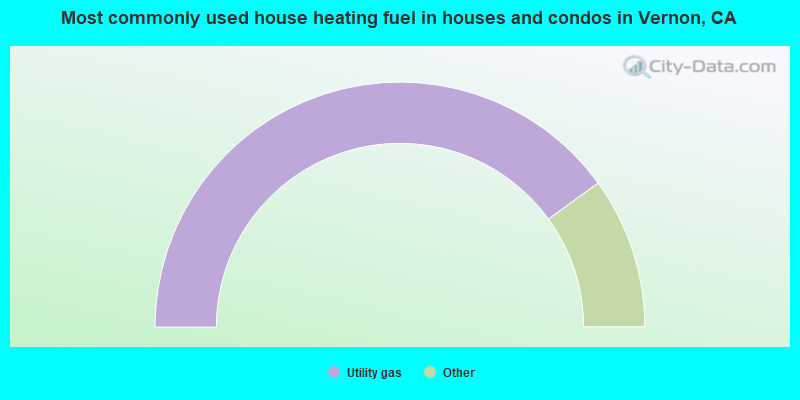
Vernon, CA (California) Houses and Residents
| Vernon: | |
| California: |
Total population: 114 (Urban population: 94, Rural population: 0)
Houses: 95 (92 occupied: 4 owner occupied, 88 renter occupied)
| % of renters here: | 96% |
| State: | 44% |
Housing density: 19 houses/condos per square mile
Median price asked for vacant for-sale houses and condos in 2022 in this county: $1,291,802.
Median contract rent in 2022: $1,289 (lower quartile is $987, upper quartile is $1,422)
Median gross rent in Vernon, CA in 2022: $1,336
Housing units in Vernon with a mortgage: 1 (0 second mortgage, 0 home equity loan, 0 both second mortgage and home equity loan)
Houses without a mortgage: 0
Compare current foreclosures near Vernon, CA:
| Photo | Address | Area | Beds / Baths | Price | Details |
|---|---|---|---|---|---|

|
#1
Horn Ave Apt 618
West Hollywood, CA 90069
|
797 sq. feet
|
1 baths 1 beds |
$625,000
|
show details |

|
#2
Cedarbrook Dr
Beverly Hills, CA 90210
|
2,371 sq. feet
|
2 baths 3 beds |
$2,350,000
|
show details |

|
#3
Flicker Way
West Hollywood, CA 90069
|
1,612 sq. feet
|
3 baths 3 beds |
$1,207,500
|
show details |

|
#4
Millbury Ave
Baldwin Park, CA 91706
|
1,632 sq. feet
|
2 baths 4 beds |
$850,000
|
show details |

|
#5
And 1240 Exposition
Los Angeles, CA 90007
|
- sq. feet
|
2 baths 2 beds |
$614,900
|
show details |

|
#6
S Slater Ave
Compton, CA 90222
|
- sq. feet
|
2 baths 3 beds |
$572,000
|
show details |

|
#7
Wilshire Blvd Apt 703
Los Angeles, CA 90024
|
2,245 sq. feet
|
2 baths 2 beds |
$1,750,000
|
show details |

|
#8
Ingraham St
Los Angeles, CA 90005
|
21,100 sq. feet
|
24 baths 23 beds |
show details | |

|
#9
E 60th St
Los Angeles, CA 90001
|
1,883 sq. feet
|
3 baths 5 beds |
show details | |

|
#10
Redondo Avenue, Units 5-8
Long Beach, CA 90804
|
3,360 sq. feet
|
4 baths 8 beds |
show details |
| Photo | Address | Area | Beds / Baths | Price | Details |
|---|---|---|---|---|---|

|
#11
Marina City Drive # Ph 29
Marina Del Rey, CA 90292
|
3,200 sq. feet
|
2 baths 2 beds |
show details | |

|
#12
N Beachwood Dr
Los Angeles, CA 90068
|
1,848 sq. feet
|
2 baths 2 beds |
show details | |

|
#13
W 110th St
Inglewood, CA 90303
|
3,481 sq. feet
|
4 baths 6 beds |
show details | |

|
#14
W Arbor St # 57
Long Beach, CA 90805
|
1,585 sq. feet
|
2 baths 3 beds |
show details | |

|
#15
W 73rd St
Los Angeles, CA 90047
|
1,700 sq. feet
|
2 baths 2 beds |
show details | |

|
#16
Bohlig Rd Apt 45
Los Angeles, CA 90032
|
813 sq. feet
|
2 baths 2 beds |
show details | |

|
#17
6th Ave
Venice, CA 90291
|
3,192 sq. feet
|
3 baths 6 beds |
show details | |

|
#18
Talbot Dr
La Mirada, CA 90638
|
505 sq. feet
|
1 baths 1 beds |
show details | |

|
#19
Marina City Dr Unit 116
Marina Del Rey, CA 90292
|
1,722 sq. feet
|
2 baths 3 beds |
show details | |

|
#20
Elburg St Unit A
Paramount, CA 90723
|
1,131 sq. feet
|
2 baths 3 beds |
show details |
| Photo | Address | Area | Beds / Baths | Price | Details |
|---|---|---|---|---|---|

|
#21
Norwalk Blvd Apt
Hawaiian Gardens, CA 90716
|
800 sq. feet
|
2 baths 1 beds |
show details | |

|
#22
3rd Ave
Los Angeles, CA 90043
|
1,248 sq. feet
|
1 baths 3 beds |
show details | |

|
#23
Clovis Ave
Los Angeles, CA 90059
|
1,733 sq. feet
|
2 baths 4 beds |
show details | |

|
#24
Rose Ave
Venice, CA 90291
|
950 sq. feet
|
2 baths 2 beds |
show details | |

|
#25
N Willowbrook Ave
Compton, CA 90222
|
884 sq. feet
|
1 baths 2 beds |
show details | |

|
#26
Castera Ave
Glendale, CA 91208
|
1,393 sq. feet
|
2 baths 2 beds |
show details | |

|
#27
Creed Ave
Los Angeles, CA 90008
|
2,376 sq. feet
|
2 baths 4 beds |
show details | |

|
#28
Daleridge Rd
La Canada Flintridge, CA 91011
|
3,252 sq. feet
|
5 baths 6 beds |
show details | |

|
#29
Leola St
Lomita, CA 90717
|
1,780 sq. feet
|
2 baths 3 beds |
show details | |

|
#30
S St Andrews Pl
Los Angeles, CA 90047
|
2,294 sq. feet
|
2 baths 3 beds |
show details |
| Photo | Address | Area | Beds / Baths | Price | Details |
|---|---|---|---|---|---|

|
#31
S St Andrews Pl
Los Angeles, CA 90047
|
2,035 sq. feet
|
3 baths 4 beds |
show details | |

|
#32
4th Ave
Los Angeles, CA 90008
|
2,354 sq. feet
|
3 baths 4 beds |
show details | |

|
#33
N Occidental Blvd
Los Angeles, CA 90026
|
1,342 sq. feet
|
2 baths 3 beds |
show details | |

|
#34
Elmer Ave
North Hollywood, CA 91602
|
2,642 sq. feet
|
3 baths 4 beds |
show details | |

|
#35
E 126th St
Los Angeles, CA 90061
|
1,140 sq. feet
|
2 baths 2 beds |
show details | |

|
#36
N 1st St
Montebello, CA 90640
|
1,260 sq. feet
|
2 baths 3 beds |
show details | |

|
#37
Marna Ave
Long Beach, CA 90808
|
3,128 sq. feet
|
3 baths 4 beds |
show details | |

|
#38
Ramona Ave
Hawthorne, CA 90250
|
1,040 sq. feet
|
1 baths 2 beds |
show details | |

|
#39
Saturn St
Los Angeles, CA 90035
|
2,863 sq. feet
|
3 baths 5 beds |
show details | |

|
#40
W 120th St
Hawthorne, CA 90250
|
1,444 sq. feet
|
2 baths 2 beds |
show details |
| Photo | Address | Area | Beds / Baths | Price | Details |
|---|---|---|---|---|---|

|
#41
253rd St
Harbor City, CA 90710
|
1,380 sq. feet
|
2 baths 3 beds |
show details | |

|
#42
7th Ave
Los Angeles, CA 90008
|
1,256 sq. feet
|
1 baths 2 beds |
show details | |

|
#43
S Primrose Ave
Monrovia, CA 91016
|
1,290 sq. feet
|
1 baths 2 beds |
show details | |

|
#44
4th Ave
Los Angeles, CA 90008
|
1,392 sq. feet
|
2 baths 2 beds |
show details | |

|
#45
Conquista Ave
Long Beach, CA 90808
|
1,340 sq. feet
|
2 baths 3 beds |
show details | |

|
#46
Cortland Ave
Paramount, CA 90723
|
1,386 sq. feet
|
1 baths 2 beds |
show details | |

|
#47
E Piru St
Compton, CA 90222
|
672 sq. feet
|
1 baths 2 beds |
show details | |

|
#48
N Vera Cruz St
Montebello, CA 90640
|
1,701 sq. feet
|
2 baths 3 beds |
show details | |

|
#49
Otsego St
Valley Village, CA 91607
|
2,661 sq. feet
|
3 baths 3 beds |
show details | |

|
Check over 1 million property listings on Foreclosure.com!
|
browse all offers | |||

Latest news about housing in Vernon, CA collected exclusively by city-data.com from local newspapers, TV, and radio stations

 | The Los Angeles Homeless Containment Thread (9142 replies) |
| Why so many covid 19 cases and deaths in LA County (1268 replies) |
| High-Tech in Sacramento - Newcomers & Leaders (96 replies) |
| Where would you move skid row? (35 replies) |
| Highgrove, CA's future and gentrification??? (56 replies) |
| San Bernardino, CA city gentifrication, 2020+ and beyond... (59 replies) |

Household type by relationship:
Households: 321- Male householders: 37 (7 living alone), Female householders: 51 (2 living alone)
30 spouses (27 opposite-sex spouses), 5 unmarried partners, (5 opposite-sex unmarried partners), 147 children (126 natural, 0 adopted, 21 stepchildren), 0 grandchildren, 3 brothers or sisters, 38 parents, 0 foster children, 6 other relatives, 0 non-relatives
Size of family households: 15 2-persons, 25 3-persons, 20 4-persons, 4 5-persons, 4 6-persons, 3 7-or-more-persons.
Size of nonfamily households: 11 1-person, 4 2-persons.
32 married couples with children.
78 single-parent households (0 men, 78 women).
16.7% of residents of Vernon speak English at home.
78.8% of residents speak Spanish at home (72% speak English very well, 7% speak English well, 14% speak English not well, 7% don't speak English at all).
1.6% of residents speak other Indo-European language at home (100% speak English very well).
Foreign born population: 78 (24.3%)
(57.7% of them are naturalized citizens)
| Here: | -655367231.0 |
| State: | 6.0 |
| Here: | 4.2 |
| State: | 3.9 |

- Bedrooms in owner-occupied houses and condos in Vernon, California
- 0no bedroom
- 01 bedroom
- 22 bedrooms
- 23 bedrooms
- 04 bedrooms
- 05+ bedrooms

- Bedrooms in renter-occupied apartments in Vernon, California
- 4no bedroom
- 71 bedroom
- 622 bedrooms
- 153 bedrooms
- 04 bedrooms
- 05+ bedrooms

- Cars and other vehicles available in Vernon in owner-occupied houses/condos
- 0no vehicle
- 21 vehicle
- 02 vehicles
- 23 vehicles
- 04 vehicles
- 05+ vehicles

- Cars and other vehicles available in Vernon in renter-occupied apartments
- 4no vehicle
- 521 vehicle
- 262 vehicles
- 63 vehicles
- 04 vehicles
- 05+ vehicles

- Rooms in owner-occupied houses in Vernon, California
- 01 room
- 02 rooms
- 03 rooms
- 04 rooms
- 05 rooms
- 26 rooms
- 07 rooms
- 08 rooms
- 29+ rooms

- Rooms in renter-occupied apartments in Vernon, California
- 41 room
- 52 rooms
- 93 rooms
- 394 rooms
- 135 rooms
- 126 rooms
- 17 rooms
- 58 rooms
- 09+ rooms


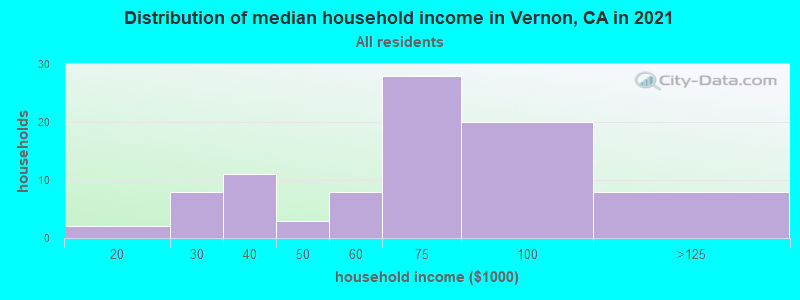
Vernon, CA household income distribution

- 1Less than $10,000
- 4$10,000 to $19,999
- 1$20,000 to $29,999
- 10$30,000 to $39,999
- 7$40,000 to $49,999
- 7$50,000 to $59,999
- 28$60,000 to $74,999
- 21$75,000 to $99,999
- 6$100,000 to $124,999
- 6$125,000 to $149,999
- 2$150,000 to $199,999
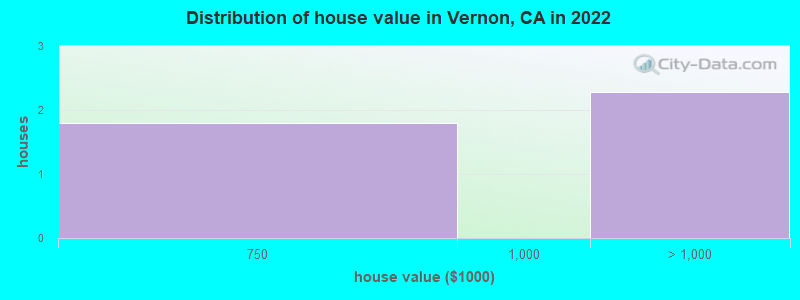
Home value of owner - occupied houses in 2022 in Vernon, CA
-
- 1$500,000 to $749,999
- 2$1,000,000 to $1,499,999
Rent paid by renters in 2022 in Vernon, CA
-
- 2$650 to $699
- 6$700 to $749
- 3$800 to $899
- 10$900 to $999
- 15$1,000 to $1,249
- 36$1,250 to $1,499
- 8$1,500 to $1,999
- 1$3,500 or more
- 3No cash rent


Percentage of workers working in this county: 100.0%
Number of people working at home: 9 (7.6% of all workers)
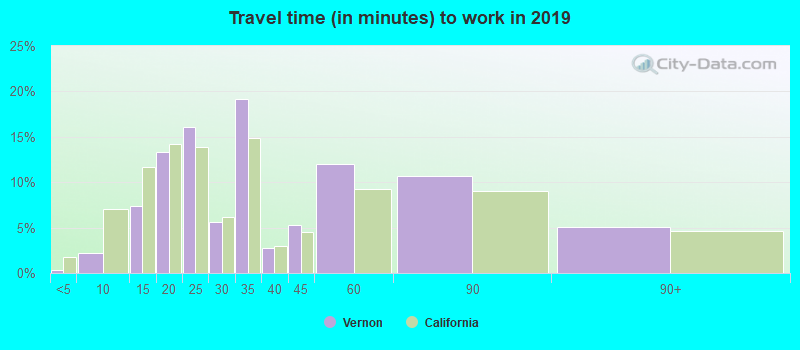
Travel time to work (commute)
- Less than 5 minutes: 1
- 5 to 9 minutes: 12
- 10 to 14 minutes: 7
- 15 to 19 minutes: 12
- 20 to 24 minutes: 13
- 25 to 29 minutes: 0
- 30 to 34 minutes: 13
- 35 to 39 minutes: 2
- 40 to 44 minutes: 18
- 45 to 59 minutes: 13
- 60 to 89 minutes: 12
- 90 or more minutes: 0
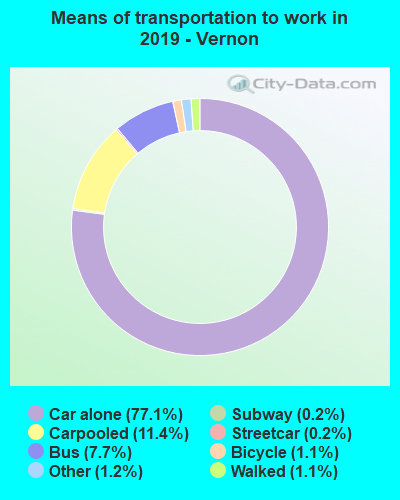
Means of transportation to work:
- Drove a car alone: 26,095 (72.7%)
- Carpooled: 4,567 (12.7%)
- Bus: 1,959 (5.5%)
- Subway or elevated rail: 27 (0.1%)
- Long-distance train or commuter rail: 56 (0.2%)
- Light rail, streetcar or trolley: 27 (0.1%)
- Ferryboat: 80 (0.2%)
- Taxi: 935 (2.6%)
- Bicycle: 216 (0.6%)
- Walked: 338 (0.9%)
- Worked at home: 9 (0.0%)

- Unemployment by race in 2022
- Unemployment rate for other race residents
- 31.2%Males
- 3.2%Females
- Unemployment rate for Hispanic or Latino residents
- 18.1%Males
- 4.5%Females

- Year of entry for the foreign-born population in Vernon, California
- 32010 or later
- 102000 to 2009
- 141990 to 1999
- 01980 to 1989
- 21970 to 1979
- 7Before 1970

First ancestries reported:
- Russian: 5 (2.6%)
- European: 3 (1.6%)
Most common places of birth for foreign-born residents (%):
| Vernon: | 60.3% (47) |
| California: | 37.2% (3,881,193) |
| Vernon: | 29.5% (23) |
| California: | 4.2% (440,287) |
| Vernon: | 5.1% (4) |
| California: | 2.8% (290,436) |
| Vernon: | 3.8% (3) |
| California: | 0.7% (71,932) |
Place of birth for U.S.-born residents:
- This state: 241
- Other state: 2
- Northeast: 2
- Midwest: 0
- South: 0
- West: 0
99.7% of Vernon residents lived in the same house 1 years ago.
| Vernon: | 99.7% |
| State average: | 88.9% |
Education attainment for males 25 years and older:
- No schooling: 0
- Nursery to 4th grade: 4
- 5th and 6th grade: 7
- 7th and 8th grade: 0
- 9th grade: 0
- 10th grade: 0
- 11th grade: 4
- 12th grade, no diploma: 0
- High school graduate (or equivalency): 9
- Less than 1 year of college: 1
- Some college more than 1 year, no degree: 19
- Associate degree: 0
- Bachelor's degree: 3
- Master's degree: 0
- Professional school degree: 1
- Doctorate degree: 0

Education attainment for females 25 years and older:
- No schooling: 0
- Nursery to 4th grade: 4
- 5th and 6th grade: 4
- 7th and 8th grade: 0
- 9th grade: 5
- 10th grade: 1
- 11th grade: 0
- 12th grade, no diploma: 3
- High school graduate (or equivalency): 37
- Less than 1 year of college: 4
- Some college more than 1 year, no degree: 18
- Associate degree: 21
- Bachelor's degree: 17
- Master's degree: 0
- Professional school degree: 2
- Doctorate degree: 0


Housing units in structures:
- One, detached: 23
- One, attached: 7
- 3 or 4: 14
- 5 to 9: 5
- 20 to 49: 43
- 50 or more: 2

Private vs. public school enrollment:
| Here: | 0.0% |
| California: | 10.5% |
| Here: | 0.0% |
| California: | 8.5% |
| Here: | 0.0% |
| California: | 15.9% |


