Vernon Valley, NJ (New Jersey) Houses and Residents
| Vernon Valley: | $315,503 |
| New Jersey: | $428,900 |
Mean price in 2022:
Detached houses: $290,384
Here: $290,384 State: $537,591
Total population: 1,626 (Urban population: 973 (all inside urban clusters), Rural population: 762 (all nonfarm))
Houses: 445 (436 occupied: 455 owner occupied, 0 renter occupied)
| % of renters here: | 0% |
| State: | 35% |
Housing density: 168 houses/condos per square mile
Median price asked for vacant for-sale houses and condos in 2022 in this county: $113,516.
Median gross rent in Vernon Valley, NJ in 2022: $-657,783,699
Housing units in Vernon Valley with a mortgage: 292 (24 second mortgage, 0 home equity loan, 26 both second mortgage and home equity loan)
Houses without a mortgage: 6
Median household income for houses/condos with a mortgage: $125,281
Median household income for apartments without a mortgage: $128,688
Median monthly housing costs: $1,609
Compare current foreclosures near Vernon Valley, NJ:
| Photo | Address | Area | Beds / Baths | Price | Details |
|---|---|---|---|---|---|

|
#1
Locust Rd
Sussex, NJ 07461
|
830 sq. feet
|
1 baths 3 beds |
$385,000
|
show details |

|
#2
Branchville Lawson Rd
Newton, NJ 07860
|
1,100 sq. feet
|
1 baths 2 beds |
$349,900
|
show details |

|
#3
Maple Ave
Stockholm, NJ 07460
|
1,305 sq. feet
|
1 baths 3 beds |
$364,900
|
show details |

|
#4
State St
Middletown, NY 10940
|
1,000 sq. feet
|
1 baths 3 beds |
$365,000
|
show details |

|
#5
Phlox Ter
Glenwood, NJ 07418
|
2,448 sq. feet
|
2 baths 3 beds |
$356,900
|
show details |

|
#6
Cliffside Ct
Hamburg, NJ 07419
|
1,739 sq. feet
|
2 baths 3 beds |
$450,000
|
show details |

|
#7
Cove Rd
Branchville, NJ 07826
|
1,863 sq. feet
|
1 baths 3 beds |
$449,900
|
show details |

|
#8
State Route 94 N
Warwick, NY 10990
|
2,536 sq. feet
|
4 baths 3 beds |
show details | |

|
#9
Old Anvil Ln
Middletown, NY 10940
|
1,452 sq. feet
|
2 baths 3 beds |
show details | |

|
#10
Marian Ct
Warwick, NY 10990
|
1,248 sq. feet
|
1 baths 2 beds |
show details |
| Photo | Address | Area | Beds / Baths | Price | Details |
|---|---|---|---|---|---|

|
#11
Lyons Ave
Stockholm, NJ 07460
|
582 sq. feet
|
1 baths 2 beds |
show details | |

|
#12
Glen Rd
Sparta, NJ 07871
|
1,317 sq. feet
|
1 baths 3 beds |
show details | |

|
#13
Post Oak Ct
Hamburg, NJ 07419
|
1,984 sq. feet
|
2 baths 3 beds |
show details | |

|
#14
Raleigh Close
Middletown, NY 10940
|
1,608 sq. feet
|
1 baths 3 beds |
show details | |

|
#15
Windy Bush Ln
Sparta, NJ 07871
|
1,778 sq. feet
|
2 baths 2 beds |
show details | |

|
#16
Warwick Tpke
Hewitt, NJ 07421
|
1,888 sq. feet
|
2 baths 3 beds |
show details | |

|
#17
Hickory Ln
Vernon, NJ 07462
|
652 sq. feet
|
1 baths 2 beds |
show details | |

|
#18
Mountain Ave
Middletown, NY 10940
|
1,040 sq. feet
|
1 baths 3 beds |
show details | |

|
#19
E Lakeshore Dr
Highland Lakes, NJ 07422
|
1,276 sq. feet
|
1 baths 3 beds |
show details | |

|
#20
Nancy Ln
Chester, NY 10918
|
2,906 sq. feet
|
2 baths 3 beds |
show details |
| Photo | Address | Area | Beds / Baths | Price | Details |
|---|---|---|---|---|---|

|
#21
Red Barn Ln
Middletown, NY 10940
|
1,452 sq. feet
|
2 baths 3 beds |
show details | |

|
#22
Golden Hill Ave
Goshen, NY 10924
|
1,782 sq. feet
|
2 baths 3 beds |
show details | |

|
#23
Sparten Pl
Tuxedo Park, NY 10987
|
2,093 sq. feet
|
2 baths 6 beds |
show details | |

|
#24
Allerton Ave
Middletown, NY 10940
|
1,352 sq. feet
|
1 baths 3 beds |
show details | |

|
#25
Linden Ave
Middletown, NY 10940
|
1,264 sq. feet
|
1 baths 3 beds |
show details | |

|
#26
Paula Ln
Middletown, NY 10940
|
1,676 sq. feet
|
2 baths 4 beds |
show details | |

|
#27
Railroad Ave # 1
Middletown, NY 10940
|
1,175 sq. feet
|
2 baths 2 beds |
show details | |

|
#28
Allerton Ave
Middletown, NY 10940
|
1,438 sq. feet
|
1 baths 3 beds |
show details | |

|
#29
Ryerson Ave
Goshen, NY 10924
|
768 sq. feet
|
1 baths 2 beds |
show details | |

|
#30
Lower Reservoir Rd
Goshen, NY 10924
|
1,988 sq. feet
|
2 baths 3 beds |
show details |
| Photo | Address | Area | Beds / Baths | Price | Details |
|---|---|---|---|---|---|

|
#31
Lincoln St
Sloatsburg, NY 10974
|
1,287 sq. feet
|
1 baths 4 beds |
show details | |

|
#32
Orange Tpke
Sloatsburg, NY 10974
|
3,359 sq. feet
|
3 baths 4 beds |
show details | |

|
#33
Peach Pl
Middletown, NY 10940
|
1,540 sq. feet
|
2 baths 3 beds |
show details | |

|
#34
Blanchard St
Middletown, NY 10940
|
2,932 sq. feet
|
4 baths 6 beds |
show details | |

|
#35
White Bridge Rd
Middletown, NY 10940
|
3,960 sq. feet
|
2 baths 3 beds |
show details | |

|
#36
Waterstone Rd
Greenwood Lake, NY 10925
|
1,418 sq. feet
|
1 baths 3 beds |
show details | |

|
#37
Maiden Ln
Port Jervis, NY 12771
|
1,564 sq. feet
|
2 baths 3 beds |
show details | |

|
#38
Amchir Ave
Middletown, NY 10940
|
1,678 sq. feet
|
1 baths 4 beds |
show details | |

|
#39
Wells Ave
Middletown, NY 10940
|
2,240 sq. feet
|
2 baths 3 beds |
show details | |

|
#40
Whispering Hls
Chester, NY 10918
|
1,084 sq. feet
|
1 baths 2 beds |
show details |
| Photo | Address | Area | Beds / Baths | Price | Details |
|---|---|---|---|---|---|

|
#41
Parnell Dr
Warwick, NY 10990
|
1,697 sq. feet
|
4 baths 6 beds |
show details | |

|
#42
Clifford Ct
Warwick, NY 10990
|
1,708 sq. feet
|
2 baths 4 beds |
show details | |

|
#43
High Barney Rd
Middletown, NY 10940
|
2,210 sq. feet
|
3 baths 4 beds |
show details | |

|
#44
Cedar Ct
Middletown, NY 10940
|
1,540 sq. feet
|
1 baths 3 beds |
show details | |

|
#45
Jonathan Ct
Warwick, NY 10990
|
2,278 sq. feet
|
2 baths 3 beds |
show details | |

|
#46
Charlotte Ln
Middletown, NY 10940
|
2,240 sq. feet
|
2 baths 4 beds |
show details | |

|
#47
South St
Middletown, NY 10940
|
1,698 sq. feet
|
1 baths 3 beds |
show details | |

|
#48
Deer Ct Dr
Middletown, NY 10940
|
1,291 sq. feet
|
2 baths 2 beds |
show details | |

|
#49
Grange Rd
Otisville, NY 10963
|
2,066 sq. feet
|
1 baths 3 beds |
show details | |

|
Check over 1 million property listings on Foreclosure.com!
|
browse all offers | |||


Household type by relationship:
Households: 1,093- Male householders: 241 (0 living alone), Female householders: 198 (20 living alone)
272 spouses (272 opposite-sex spouses), 8 unmarried partners, (8 opposite-sex unmarried partners), 298 children (298 natural, 0 adopted, 0 stepchildren), 9 grandchildren, 0 brothers or sisters, 14 parents, 6 foster children, 17 other relatives, 28 non-relatives
Size of family households: 307 2-persons, 51 3-persons, 50 4-persons, 28 5-persons.
Size of nonfamily households: 19 1-person, 17 2-persons.
0 married couples with children.
61 single-parent households (50 men, 11 women).
89.5% of residents of Vernon Valley speak English at home.
7.7% of residents speak Spanish at home (41% speak English very well, 59% speak English well).
2.8% of residents speak other Indo-European language at home (100% speak English very well).
Foreign born population: 97 (8.9%)
(62.9% of them are naturalized citizens)
| Here: | 7.5 |
| State: | 6.8 |
| Here: | -620155038.1 |
| State: | 3.9 |

- Bedrooms in owner-occupied houses and condos in Vernon Valley, New Jersey
- 10no bedroom
- 01 bedroom
- 02 bedrooms
- 2533 bedrooms
- 1924 bedrooms
- 05+ bedrooms

- Cars and other vehicles available in Vernon Valley in owner-occupied houses/condos
- 17no vehicle
- 531 vehicle
- 2282 vehicles
- 1003 vehicles
- 464 vehicles
- 115+ vehicles

- Rooms in owner-occupied houses in Vernon Valley, New Jersey
- 101 room
- 02 rooms
- 03 rooms
- 04 rooms
- 695 rooms
- 546 rooms
- 1037 rooms
- 428 rooms
- 1779+ rooms


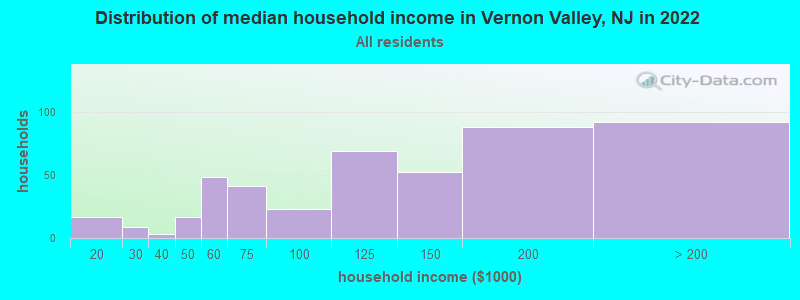
Vernon Valley, NJ household income distribution

- 17$10,000 to $19,999
- 9$20,000 to $29,999
- 3$30,000 to $39,999
- 17$40,000 to $49,999
- 48$50,000 to $59,999
- 41$60,000 to $74,999
- 23$75,000 to $99,999
- 69$100,000 to $124,999
- 52$125,000 to $149,999
- 88$150,000 to $199,999
- 92$200,000 or more
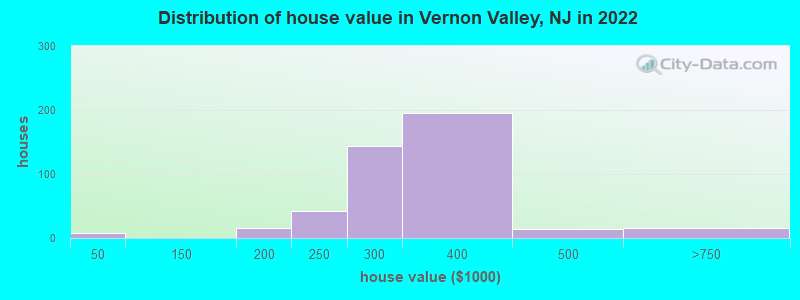
Home value of owner - occupied houses in 2022 in Vernon Valley, NJ
-
- 8$20,000 to $24,999
- 15$150,000 to $174,999
- 41$200,000 to $249,999
- 144$250,000 to $299,999
- 195$300,000 to $399,999
- 14$400,000 to $499,999
- 16$500,000 to $749,999

Percentage of workers working in this county: 50.0%
Number of people working at home: 65 (9.4% of all workers)
Travel time to work (commute)
- Less than 5 minutes: 0
- 5 to 9 minutes: 48
- 10 to 14 minutes: 99
- 15 to 19 minutes: 35
- 20 to 24 minutes: 5
- 25 to 29 minutes: 55
- 30 to 34 minutes: 25
- 35 to 39 minutes: 37
- 40 to 44 minutes: 33
- 45 to 59 minutes: 63
- 60 to 89 minutes: 146
- 90 or more minutes: 37
Means of transportation to work:
- Drove a car alone: 727 (80.2%)
- Carpooled: 136 (15.0%)
- Bus or trolley bus: 18 (2.0%)
- Other means: 14 (1.5%)
- Worked at home: 12 (1.3%)

- Unemployment by race in 2022
- Unemployment rate for White non-Hispanic residents
- 2.7%Males
- 3.3%Females
- Unemployment rate for Hispanic or Latino residents
- 13.0%Females

- Year of entry for the foreign-born population in Vernon Valley, New Jersey
- 02010 or later
- 192000 to 2009
- 01990 to 1999
- 241980 to 1989
- 01970 to 1979
- 20Before 1970
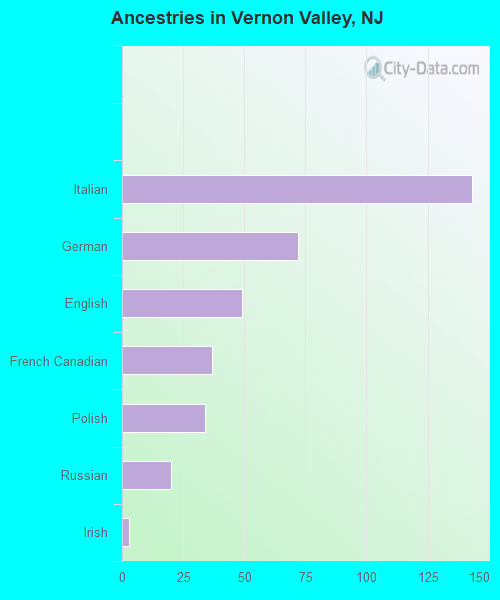
First ancestries reported:
- Italian: 143 (30.1%)
- German: 72 (15.2%)
- English: 49 (10.3%)
- French Canadian: 37 (7.8%)
- Polish: 34 (7.2%)
- Russian: 20 (4.2%)
- Irish: 3 (0.6%)
Most common places of birth for foreign-born residents (%):
| Vernon Valley: | 29.3% (27) |
| New Jersey: | 0.8% (17,217) |
| Vernon Valley: | 23.9% (22) |
| New Jersey: | 1.5% (33,198) |
| Vernon Valley: | 21.7% (20) |
| New Jersey: | 4.2% (90,817) |
| Vernon Valley: | 18.5% (17) |
| New Jersey: | 2.1% (45,435) |
| Vernon Valley: | 4.3% (4) |
| New Jersey: | 4.4% (95,275) |
Place of birth for U.S.-born residents:
- This state: 830
- Other state: 168
- Northeast: 145
- Midwest: 0
- South: 23
- West: 0
92.1% of Vernon Valley residents lived in the same house 1 years ago.
Out of people who lived in different houses, 30.5% lived in this county.
Out of people who lived in different counties, 100.0% lived in New Jersey.
| Vernon Valley: | 92.1% |
| State average: | 90.4% |
Education attainment for males 25 years and older:
- No schooling: 0
- Nursery to 4th grade: 0
- 5th and 6th grade: 0
- 7th and 8th grade: 0
- 9th grade: 0
- 10th grade: 0
- 11th grade: 21
- 12th grade, no diploma: 17
- High school graduate (or equivalency): 137
- Less than 1 year of college: 38
- Some college more than 1 year, no degree: 42
- Associate degree: 56
- Bachelor's degree: 121
- Master's degree: 29
- Professional school degree: 0
- Doctorate degree: 0

Education attainment for females 25 years and older:
- No schooling: 0
- Nursery to 4th grade: 0
- 5th and 6th grade: 0
- 7th and 8th grade: 0
- 9th grade: 0
- 10th grade: 0
- 11th grade: 0
- 12th grade, no diploma: 0
- High school graduate (or equivalency): 188
- Less than 1 year of college: 51
- Some college more than 1 year, no degree: 64
- Associate degree: 43
- Bachelor's degree: 54
- Master's degree: 38
- Professional school degree: 0
- Doctorate degree: 0


Housing units in structures:
- One, detached: 435
- One, attached: 10

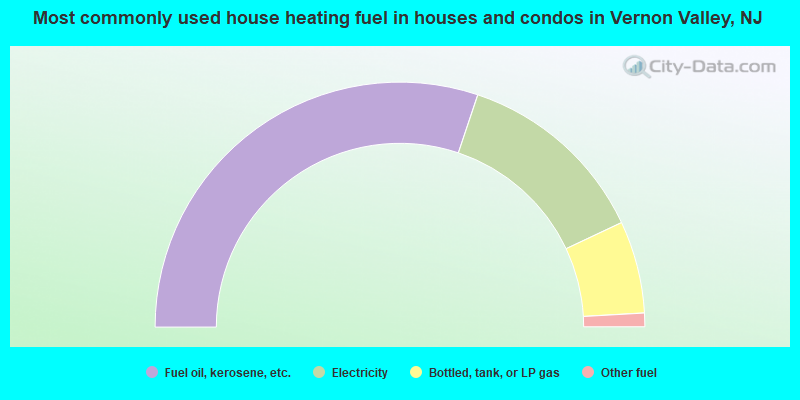
- 60.3%Fuel oil, kerosene, etc.
- 25.7%Electricity
- 12.2%Bottled, tank, or LP gas
- 1.8%Other fuel
Private vs. public school enrollment:
| Here: | 0.0% |
| New Jersey: | 12.3% |
| Here: | 0.0% |
| New Jersey: | 13.1% |
| Here: | 0.0% |
| New Jersey: | 33.2% |


