Housing density: 2,078 houses/condos per square mile
Median price asked for vacant for-sale houses and condos in 2022 in this county: $231,294.
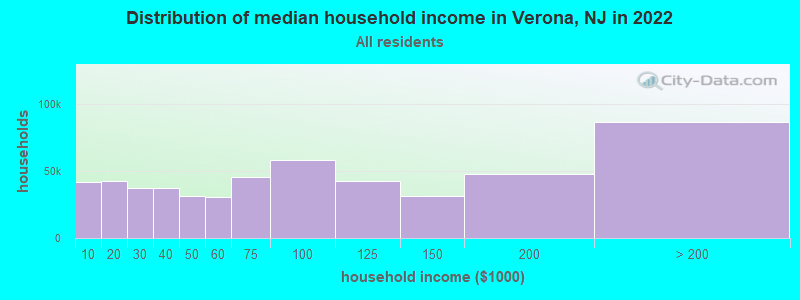
Median contract rent in 2022: $1,658 (lower quartile is $1,349, upper quartile is over $2,000)
Median rent asked for vacant for-rent units in 2022: $1,814
Median gross rent in Verona, NJ in 2022: $1,767
Housing units in Verona with a mortgage: 2,593 (280 second mortgage, 416 home equity loan, 8 both second mortgage and home equity loan) Houses without a mortgage: 889
In family households: 645,040 (104,343 male householders, 84,996 female householders)
113,673 spouses, 245,726 children (232,723 natural, 5,793 adopted, 7,210 stepchildren), 20,627 grandchildren, 15,422 brothers or sisters, 11,923 parents, foster children, 19,910 other relatives, 22,762 non-relatives
In nonfamily households: 115,157 (42,135 male householders (33,262 living alone)), 52,238 female householders (45,266 living alone)), 20,784 nonrelatives
In group quarters: 23,772 (12,126 institutionalized population)
108,634 married couples with children.
65,899 single-parent households (10,059 men, 55,840 women).
86.7% of residents of Verona speak English at home.
3.3% of residents speak Spanish at home (79% speak English very well, 10% speak English well, 9% speak English not well, 2% don't speak English at all).
6.9% of residents speak other Indo-European language at home (68% speak English very well, 22% speak English well, 9% speak English not well, 1% don't speak English at all).
2.5% of residents speak Asian or Pacific Island language at home (59% speak English very well, 25% speak English well, 16% speak English not well).
0.5% of residents speak other language at home (67% speak English very well, 33% speak English well).
Foreign born population: 1,940 (13.4%)
(76.7% of them are naturalized citizens)
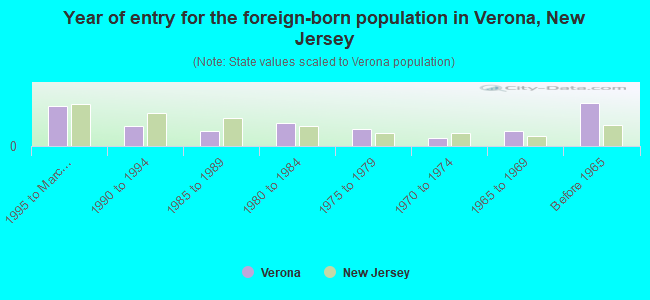
Year of entry for the foreign-born population in Verona, New Jersey
2901995 to March 2000
1451990 to 1994
1071985 to 1989
1651980 to 1984
1251975 to 1979
571970 to 1974
1121965 to 1969
309Before 1965
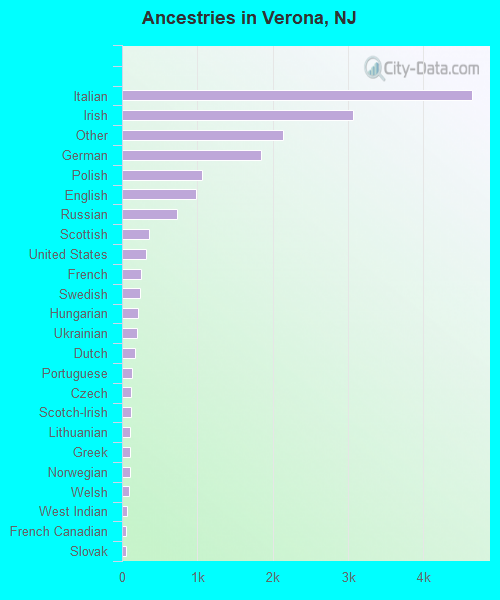
First ancestries reported:
Italian: 4,638 (26.9%)
Irish: 3,060 (17.7%)
Other: 2,139 (12.4%)
German: 1,847 (10.7%)
Polish: 1,059 (6.1%)
English: 977 (5.7%)
Russian: 733 (4.3%)
Scottish: 361 (2.1%)
United States: 312 (1.8%)
French: 251 (1.5%)
Swedish: 237 (1.4%)
Hungarian: 207 (1.2%)
Ukrainian: 194 (1.1%)
Dutch: 172 (1.0%)
Portuguese: 132 (0.8%)
Czech: 123 (0.7%)
Scotch-Irish: 114 (0.7%)
Lithuanian: 108 (0.6%)
Greek: 105 (0.6%)
Norwegian: 104 (0.6%)
Welsh: 92 (0.5%)
West Indian: 62 (0.4%)
French Canadian: 59 (0.3%)
Slovak: 54 (0.3%)
Swiss: 41 (0.2%)
Danish: 37 (0.2%)
Arab: 27 (0.2%)
Most common places of birth for foreign-born residents (%):
United Kingdom
Verona:
10.2% (134)
New Jersey:
2.1% (30,355)
India
Verona:
10.1% (132)
New Jersey:
8.1% (119,497)
Italy
Verona:
8.5% (111)
New Jersey:
4.0% (58,395)
Ireland
Verona:
7.1% (93)
New Jersey:
0.8% (12,082)
Korea
Verona:
5.5% (72)
New Jersey:
3.5% (51,970)
China, excluding Hong Kong and Taiwan
Verona:
5.1% (67)
New Jersey:
2.7% (40,092)
Philippines
Verona:
5.0% (65)
New Jersey:
4.7% (69,773)
Russia
Verona:
4.4% (58)
New Jersey:
1.4% (20,243)
Poland
Verona:
4.4% (57)
New Jersey:
3.8% (55,466)
Portugal
Verona:
4.2% (55)
New Jersey:
2.5% (37,183)
Colombia
Verona:
4.0% (53)
New Jersey:
4.7% (69,754)
Cuba
Verona:
3.0% (39)
New Jersey:
3.7% (55,241)
Canada
Verona:
2.7% (35)
New Jersey:
1.1% (16,333)
Haiti
Verona:
2.1% (28)
New Jersey:
2.2% (31,963)
Hungary
Verona:
1.9% (25)
New Jersey:
0.5% (7,426)
Mexico
Verona:
1.9% (25)
New Jersey:
4.6% (67,667)
Germany
Verona:
1.8% (24)
New Jersey:
2.3% (33,531)
Other South Central Asia
Verona:
1.8% (23)
New Jersey:
0.2% (2,570)
Peru
Verona:
1.7% (22)
New Jersey:
3.1% (45,151)
Hong Kong
Verona:
1.7% (22)
New Jersey:
0.6% (8,266)
Place of birth for U.S.-born residents:
This state: 8,831
Other state: 3,315
Northeast: 2,414
Midwest: 434
South: 240
West: 227
66% of Verona residents lived in the same house 5 years ago. Out of people who lived in different houses, 59% lived in this county. Out of people who lived in different counties, 63% lived in New Jersey.
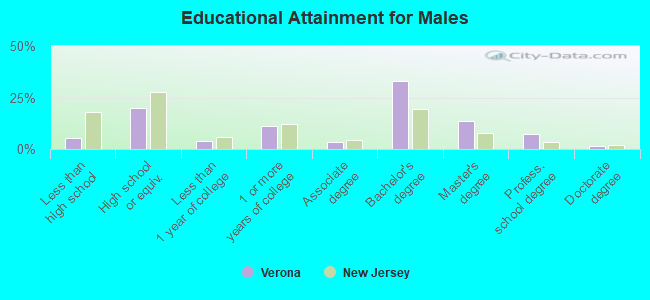
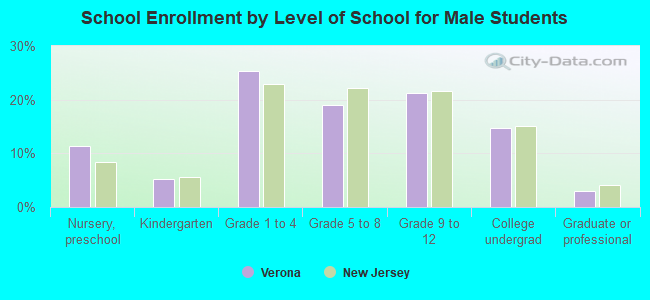
Education attainment for males 25 years and older:
No schooling: 9
Nursery to 4th grade: 0
5th and 6th grade: 56
7th and 8th grade: 52
9th grade: 16
10th grade: 45
11th grade: 43
12th grade, no diploma: 25
High school graduate (or equivalency): 893
Less than 1 year of college: 177
Some college more than 1 year, no degree: 509
Associate degree: 158
Bachelor's degree: 1,481
Master's degree: 604
Professional school degree: 332
Doctorate degree: 69
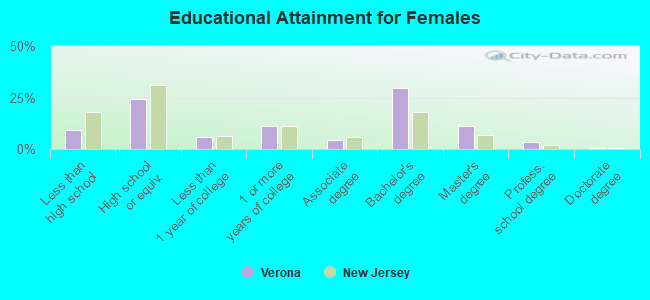
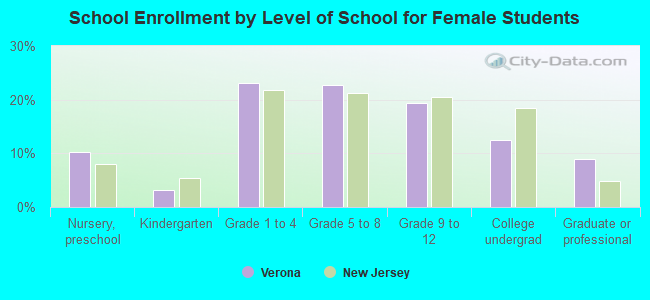
Education attainment for females 25 years and older:
No schooling: 23
Nursery to 4th grade: 0
5th and 6th grade: 36
7th and 8th grade: 82
9th grade: 65
10th grade: 100
11th grade: 56
12th grade, no diploma: 151
High school graduate (or equivalency): 1,351
Less than 1 year of college: 319
Some college more than 1 year, no degree: 617
Associate degree: 253
Bachelor's degree: 1,630
Master's degree: 615
Professional school degree: 179
Doctorate degree: 34
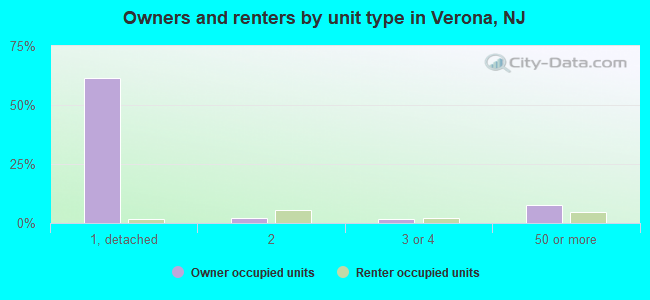
Housing units in structures:
One, detached: 3,574
One, attached: 134
Two: 435
3 or 4: 222
5 to 9: 225
10 to 19: 191
20 to 49: 165
50 or more: 773
Housing units lacking complete plumbing facilities: 0.5%
Housing units lacking complete kitchen facilities: 0.7%