Verona, VA (Virginia) Houses and Residents
| Verona: | $232,638 |
| Virginia: | $365,700 |
Total population: 4,239 (Urban population: 2,509 (all inside urban clusters), Rural population: 1,157 (all nonfarm))
Houses: 1,771 (1,609 occupied: 1,260 owner occupied, 399 renter occupied)
| % of renters here: | 24% |
| State: | 33% |
Housing density: 252 houses/condos per square mile
Median price asked for vacant for-sale houses and condos in 2022 in this county: $551,206.
Median contract rent in 2022: $708 (lower quartile is $478, upper quartile is $945)
Median rent asked for vacant for-rent units in 2022: $2,506
Median gross rent in Verona, VA in 2022: $936
Housing units in Verona with a mortgage: 722 (175 second mortgage, 0 home equity loan, 177 both second mortgage and home equity loan)
Houses without a mortgage: 0
Median household income for houses/condos with a mortgage: $80,589
Median household income for apartments without a mortgage: $62,313
Median monthly housing costs: $982
Compare current foreclosures near Verona, VA:
| Photo | Address | Area | Beds / Baths | Price | Details |
|---|---|---|---|---|---|

|
#1
Westgate Rd
Verona, VA 24482
|
1,020 sq. feet
|
1 baths 3 beds |
show details | |

|
#2
Mountain View Dr
Verona, VA 24482
|
1,701 sq. feet
|
2 baths 3 beds |
show details | |

|
#3
Laurel Hill Rd
Verona, VA 24482
|
- sq. feet
|
- baths - beds |
show details | |

|
#4
Locust St Apt 101
Verona, VA 24482
|
- sq. feet
|
- baths - beds |
show details | |

|
#5
Westgate Rd
Verona, VA 24482
|
- sq. feet
|
- baths - beds |
show details | |

|
#6
Crab Apple Ln Apt 106
Verona, VA 24482
|
- sq. feet
|
- baths - beds |
show details | |

|
#7
Azalea Dr
Afton, VA 22920
|
1,143 sq. feet
|
2 baths 3 beds |
show details | |

|
#8
Community Center Rd
Bridgewater, VA 22812
|
1,895 sq. feet
|
1 baths 2 beds |
show details | |

|
#9
Vinson St
Staunton, VA 24401
|
902 sq. feet
|
1 baths 3 beds |
show details | |

|
#10
Weyers Cave Rd
Weyers Cave, VA 24486
|
1,244 sq. feet
|
2 baths 3 beds |
show details |
| Photo | Address | Area | Beds / Baths | Price | Details |
|---|---|---|---|---|---|

|
#11
Rutherford Ln
Stuarts Draft, VA 24477
|
2,527 sq. feet
|
3 baths 4 beds |
show details | |

|
#12
Heizers Tanyard Rd
Churchville, VA 24421
|
1,050 sq. feet
|
1 baths 3 beds |
show details | |

|
#13
Lyndhurst Rd
Waynesboro, VA 22980
|
1,912 sq. feet
|
2 baths 3 beds |
show details | |

|
#14
White Hill Rd
Stuarts Draft, VA 24477
|
2,018 sq. feet
|
1 baths 3 beds |
show details | |

|
#15
Windmill Ln
Stuarts Draft, VA 24477
|
1,955 sq. feet
|
2 baths 4 beds |
show details | |

|
#16
17th St
Grottoes, VA 24441
|
1,000 sq. feet
|
1 baths 3 beds |
show details | |

|
#17
My Ln
Stuarts Draft, VA 24477
|
864 sq. feet
|
1 baths 2 beds |
show details | |

|
#18
N Bayard Ave
Waynesboro, VA 22980
|
728 sq. feet
|
1 baths 2 beds |
show details | |

|
#19
Strawberry Ln
Waynesboro, VA 22980
|
1,055 sq. feet
|
2 baths 3 beds |
show details | |

|
#20
Stuarts Draft Hwy
Stuarts Draft, VA 24477
|
1,248 sq. feet
|
2 baths 3 beds |
show details |
| Photo | Address | Area | Beds / Baths | Price | Details |
|---|---|---|---|---|---|

|
#21
4th St
Waynesboro, VA 22980
|
1,055 sq. feet
|
1 baths 3 beds |
show details | |

|
#22
Bluff Ave
Waynesboro, VA 22980
|
768 sq. feet
|
1 baths 2 beds |
show details | |

|
#23
Arch Ave
Waynesboro, VA 22980
|
1,746 sq. feet
|
1 baths 3 beds |
show details | |

|
#24
White Hill Rd
Stuarts Draft, VA 24477
|
2,005 sq. feet
|
2 baths 3 beds |
show details | |

|
#25
Highland Ave
Waynesboro, VA 22980
|
1,092 sq. feet
|
1 baths 3 beds |
show details | |

|
#26
Hankey Mountain Hwy
Churchville, VA 24421
|
846 sq. feet
|
1 baths 2 beds |
show details | |

|
#27
Mill St
Mount Crawford, VA 22841
|
2,269 sq. feet
|
1 baths 3 beds |
show details | |

|
#28
Hankey Mountain Hwy
Churchville, VA 24421
|
2,141 sq. feet
|
2 baths 4 beds |
show details | |

|
#29
Loudoun Ave
Waynesboro, VA 22980
|
1,553 sq. feet
|
1 baths 3 beds |
show details | |

|
#30
Parkview Dr
Waynesboro, VA 22980
|
1,373 sq. feet
|
1 baths 3 beds |
show details |
| Photo | Address | Area | Beds / Baths | Price | Details |
|---|---|---|---|---|---|

|
#31
Kent Rd
Waynesboro, VA 22980
|
2,672 sq. feet
|
2 baths 3 beds |
show details | |

|
#32
E Side Hwy
Waynesboro, VA 22980
|
1,408 sq. feet
|
2 baths 3 beds |
show details | |

|
#33
Cedarcrest Dr
Waynesboro, VA 22980
|
1,342 sq. feet
|
2 baths 3 beds |
show details | |

|
#34
Harriston Rd
Grottoes, VA 24441
|
960 sq. feet
|
1 baths 3 beds |
show details | |

|
#35
Stuart St
Waynesboro, VA 22980
|
1,493 sq. feet
|
2 baths 3 beds |
show details | |

|
#36
Rockfish Rd
Waynesboro, VA 22980
|
889 sq. feet
|
1 baths 2 beds |
show details | |

|
#37
Albemarle Ave
Waynesboro, VA 22980
|
1,050 sq. feet
|
1 baths 2 beds |
show details | |

|
#38
Transom Ct
Mount Crawford, VA 22841
|
3,144 sq. feet
|
2 baths 3 beds |
show details | |

|
#39
Deleeuw Ln
Churchville, VA 24421
|
1,792 sq. feet
|
2 baths 3 beds |
show details | |

|
#40
Valley View Rd
Mc Gaheysville, VA 22840
|
1,679 sq. feet
|
3 baths 6 beds |
show details |
| Photo | Address | Area | Beds / Baths | Price | Details |
|---|---|---|---|---|---|

|
#41
Davis Rd
Penn Laird, VA 22846
|
8,054 sq. feet
|
5 baths 4 beds |
show details | |

|
#42
Corville Farm Rd
Crozet, VA 22932
|
960 sq. feet
|
1 baths 3 beds |
show details | |

|
#43
Rosedale Dr
Harrisonburg, VA 22801
|
1,073 sq. feet
|
1 baths 3 beds |
show details | |

|
#44
Pear St
Harrisonburg, VA 22801
|
720 sq. feet
|
1 baths 2 beds |
show details | |

|
#45
W Donnagail Dr
Penn Laird, VA 22846
|
2,341 sq. feet
|
2 baths 3 beds |
show details | |

|
#46
Cumberland Dr
Harrisonburg, VA 22801
|
5,028 sq. feet
|
4 baths 4 beds |
show details | |

|
#47
Chinquapin Walk
Greenville, VA 24440
|
1,258 sq. feet
|
1 baths 3 beds |
show details | |

|
#48
Port Republic Rd
Harrisonburg, VA 22801
|
1,512 sq. feet
|
1 baths 2 beds |
show details | |

|
#49
Church St
Greenville, VA 24440
|
1,552 sq. feet
|
1 baths 3 beds |
show details | |

|
Check over 1 million property listings on Foreclosure.com!
|
browse all offers | |||

Latest news about housing in Verona, VA collected exclusively by city-data.com from local newspapers, TV, and radio stations

 | Harrisonburg, Mcgaheysville, Staunton, New Market, Verona???Where to move? (2 replies) |
| Considering moving to Virginia (15 replies) |
| Staunton VA area? (16 replies) |
| Could any one please help me in finding a good, safe apartment in staunton? (7 replies) |
| Things To Do in Hampton Roads & Nearby Communities (174 replies) |
| Possible relocation to Harrisonburg area. PLEASE help! (3 replies) |

Median year apartment built: 1982
Household type by relationship:
Households: 4,619- Male householders: 540 (76 living alone), Female householders: 1,059 (254 living alone)
760 spouses (750 opposite-sex spouses), 46 unmarried partners, (46 opposite-sex unmarried partners), 1,062 children (1,027 natural, 0 adopted, 35 stepchildren), 84 grandchildren, 0 brothers or sisters, 103 parents, 0 foster children, 41 other relatives, 129 non-relatives
- In group quarters: 791
Size of family households: 606 2-persons, 288 3-persons, 233 4-persons, 100 5-persons, 33 6-persons.
Size of nonfamily households: 344 1-person, 31 2-persons.
438 married couples with children.
161 single-parent households (70 men, 91 women).
95.8% of residents of Verona speak English at home.
1.6% of residents speak Spanish at home (66% speak English very well, 34% speak English well).
2.1% of residents speak other Indo-European language at home (40% speak English very well, 26% speak English well, 34% speak English not well).
0.2% of residents speak other language at home (100% speak English well).
Foreign born population: 125 (2.7%)
(106.4% of them are naturalized citizens)
| Here: | 6.2 |
| State: | 7.0 |
| Here: | 4.7 |
| State: | 4.3 |

- Bedrooms in owner-occupied houses and condos in Verona, Virginia
- 0no bedroom
- 01 bedroom
- 1042 bedrooms
- 9843 bedrooms
- 1564 bedrooms
- 175+ bedrooms

- Bedrooms in renter-occupied apartments in Verona, Virginia
- 0no bedroom
- 01 bedroom
- 2362 bedrooms
- 1263 bedrooms
- 384 bedrooms
- 05+ bedrooms

- Cars and other vehicles available in Verona in owner-occupied houses/condos
- 30no vehicle
- 2151 vehicle
- 4942 vehicles
- 4303 vehicles
- 504 vehicles
- 415+ vehicles

- Cars and other vehicles available in Verona in renter-occupied apartments
- 22no vehicle
- 1811 vehicle
- 1312 vehicles
- 663 vehicles
- 04 vehicles
- 05+ vehicles

- Rooms in owner-occupied houses in Verona, Virginia
- 01 room
- 02 rooms
- 03 rooms
- 564 rooms
- 3555 rooms
- 3436 rooms
- 1727 rooms
- 2298 rooms
- 1069+ rooms

- Rooms in renter-occupied apartments in Verona, Virginia
- 01 room
- 02 rooms
- 03 rooms
- 1594 rooms
- 1595 rooms
- 726 rooms
- 07 rooms
- 08 rooms
- 99+ rooms


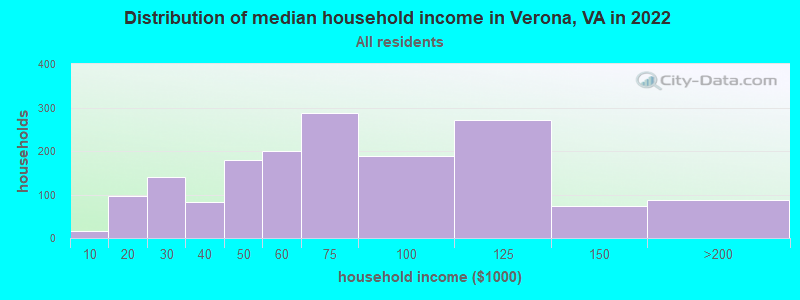
Verona, VA household income distribution

- 15Less than $10,000
- 96$10,000 to $19,999
- 140$20,000 to $29,999
- 82$30,000 to $39,999
- 180$40,000 to $49,999
- 199$50,000 to $59,999
- 287$60,000 to $74,999
- 189$75,000 to $99,999
- 272$100,000 to $124,999
- 74$125,000 to $149,999
- 88$150,000 to $199,999
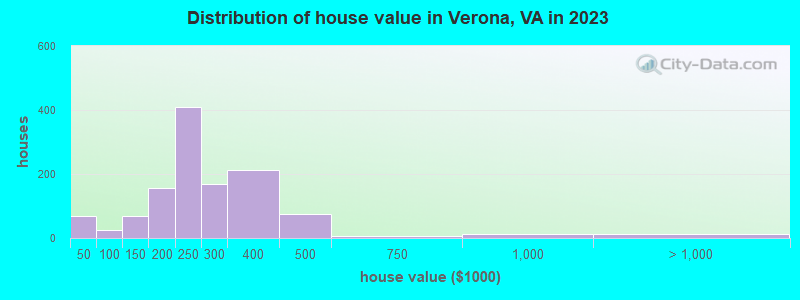
Home value of owner - occupied houses in 2022 in Verona, VA
-
- 29Less than $10,000
- 30$15,000 to $19,999
- 19$25,000 to $29,999
- 49$100,000 to $124,999
- 68$125,000 to $149,999
- 129$150,000 to $174,999
- 113$175,000 to $199,999
- 349$200,000 to $249,999
- 103$250,000 to $299,999
- 149$300,000 to $399,999
- 60$400,000 to $499,999
- 10$500,000 to $749,999
- 12$750,000 to $999,999
Rent paid by renters in 2022 in Verona, VA
-
- 3$300 to $349
- 20$400 to $449
- 40$450 to $499
- 36$500 to $549
- 47$600 to $649
- 48$650 to $699
- 32$750 to $799
- 81$800 to $899
- 55$900 to $999
- 16$1,000 to $1,249


Percentage of workers working in this county: 49.6%
Number of people working at home: 73 (3.7% of all workers)
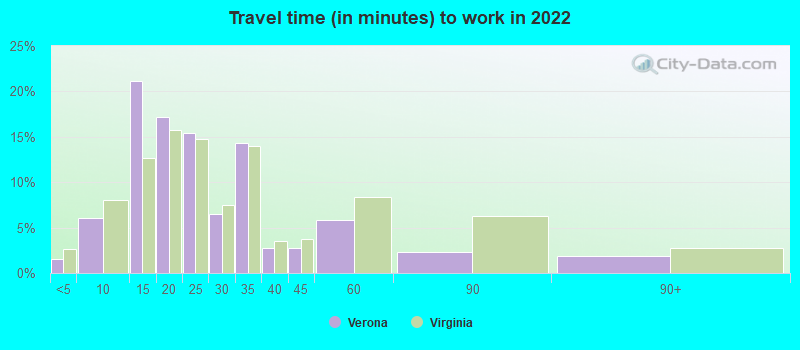
Travel time to work (commute)
- Less than 5 minutes: 0
- 5 to 9 minutes: 143
- 10 to 14 minutes: 546
- 15 to 19 minutes: 408
- 20 to 24 minutes: 228
- 25 to 29 minutes: 240
- 30 to 34 minutes: 215
- 35 to 39 minutes: 45
- 40 to 44 minutes: 30
- 45 to 59 minutes: 24
- 60 to 89 minutes: 4
- 90 or more minutes: 49
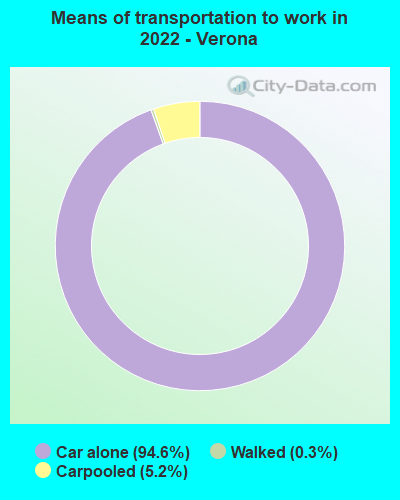
Means of transportation to work:
- Drove a car alone: 2,929 (88.5%)
- Carpooled: 162 (4.9%)
- Walked: 9 (0.3%)
- Worked at home: 73 (2.2%)

- Unemployment by race in 2022
- Unemployment rate for White non-Hispanic residents
- 2.7%Males
- 2.6%Females

- Year of entry for the foreign-born population in Verona, Virginia
- 532010 or later
- 392000 to 2009
- 251990 to 1999
- 01980 to 1989
- 01970 to 1979
- 10Before 1970
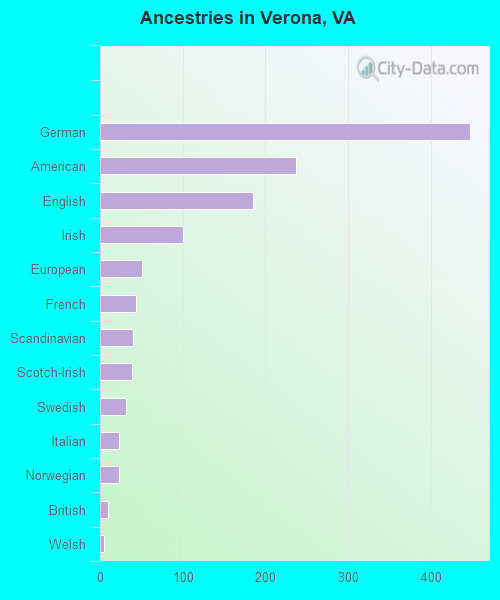
First ancestries reported:
- German: 448 (27.3%)
- American: 237 (14.5%)
- English: 185 (11.3%)
- Irish: 100 (6.1%)
- European: 51 (3.1%)
- French: 44 (2.7%)
- Scandinavian: 40 (2.4%)
- Scotch-Irish: 39 (2.4%)
- Swedish: 31 (1.9%)
- Italian: 23 (1.4%)
- Norwegian: 23 (1.4%)
- British: 10 (0.6%)
- Welsh: 5 (0.3%)
- African: 4 (0.2%)
Most common places of birth for foreign-born residents (%):
| Verona: | 43.4% (49) |
| Virginia: | 1.1% (12,049) |
| Verona: | 38.1% (43) |
| Virginia: | 0.5% (5,899) |
| Verona: | 7.1% (8) |
| Virginia: | 3.0% (32,892) |
| Verona: | 6.2% (7) |
| Virginia: | 0.9% (9,351) |
| Verona: | 6.2% (7) |
| Virginia: | 5.3% (57,498) |
Place of birth for U.S.-born residents:
- This state: 3,269
- Other state: 1,187
- Northeast: 376
- Midwest: 88
- South: 669
- West: 43
75.7% of Verona residents lived in the same house 1 years ago.
Out of people who lived in different houses, 12.5% lived in this county.
Out of people who lived in different counties, 94.1% lived in Virginia.
| Verona: | 75.7% |
| State average: | 86.6% |
Education attainment for males 25 years and older:
- No schooling: 0
- Nursery to 4th grade: 0
- 5th and 6th grade: 17
- 7th and 8th grade: 18
- 9th grade: 51
- 10th grade: 40
- 11th grade: 41
- 12th grade, no diploma: 0
- High school graduate (or equivalency): 1,098
- Less than 1 year of college: 84
- Some college more than 1 year, no degree: 128
- Associate degree: 104
- Bachelor's degree: 119
- Master's degree: 70
- Professional school degree: 85
- Doctorate degree: 0

Education attainment for females 25 years and older:
- No schooling: 24
- Nursery to 4th grade: 0
- 5th and 6th grade: 31
- 7th and 8th grade: 84
- 9th grade: 15
- 10th grade: 13
- 11th grade: 33
- 12th grade, no diploma: 12
- High school graduate (or equivalency): 606
- Less than 1 year of college: 35
- Some college more than 1 year, no degree: 187
- Associate degree: 92
- Bachelor's degree: 347
- Master's degree: 45
- Professional school degree: 30
- Doctorate degree: 21


Housing units in structures:
- One, detached: 1,452
- One, attached: 37
- 3 or 4: 91
- 5 to 9: 8
- 10 to 19: 63
- Mobile homes: 118
Median worth of mobile homes: $17,700
Housing units lacking complete kitchen facilities in 2022: 1.5%
House/condo owner moved in on average 16 years ago
Renter moved in on average 6 years ago

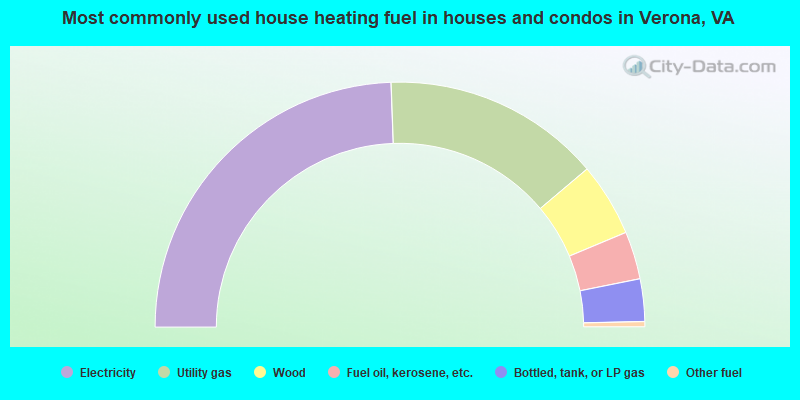
- 48.8%Electricity
- 28.8%Utility gas
- 9.7%Wood
- 6.3%Fuel oil, kerosene, etc.
- 5.6%Bottled, tank, or LP gas
- 0.7%Other fuel
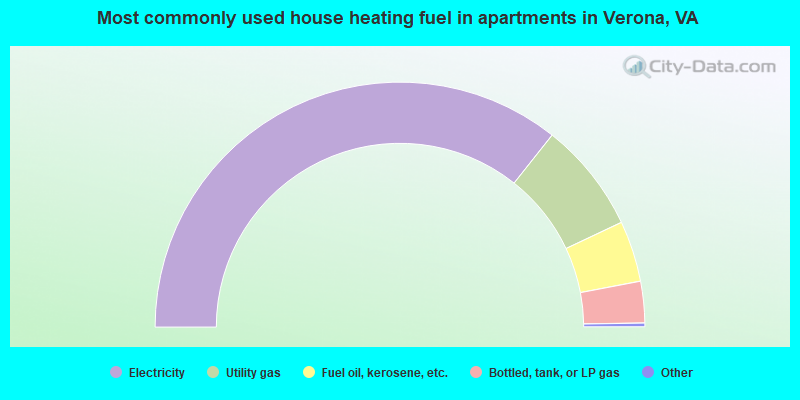
- 71.7%Electricity
- 14.7%Utility gas
- 8.1%Fuel oil, kerosene, etc.
- 5.5%Bottled, tank, or LP gas
Private vs. public school enrollment:
| Here: | 27.9% |
| Virginia: | 13.2% |
| Here: | 6.3% |
| Virginia: | 10.2% |
| Here: | 0.0% |
| Virginia: | 18.7% |


