Villa Park, IL (Illinois) Houses and Residents
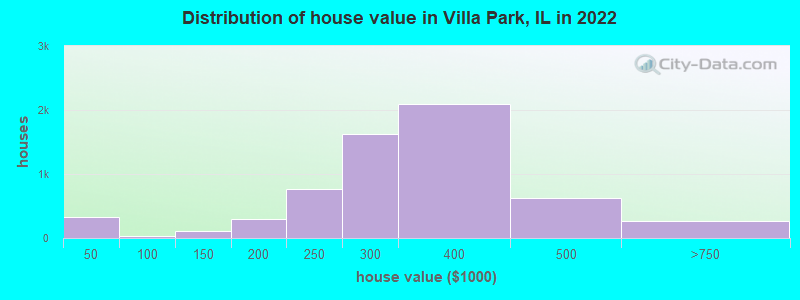
Estimated median house or condo value in 2022: $295,996 (it was $156,100 in 2000 )
Villa Park:
$295,996Illinois:
$251,600
Lower value quartile - upper value quartile: $255,144 - $368,907Mean price in 2022: Detached houses: $308,108 Here:
$308,108State:
$310,164
Townhouses or other attached units: $227,486 Here:
$227,486State:
$286,230
In 2-unit structures: $495,068 Here:
$495,068State:
$299,638
In 5-or-more-unit structures: $151,291 Here:
$151,291State:
$318,887
Total population: 22,038 (All urban)
Houses: 8,773 (8,292 occupied: 5,903 owner occupied, 2,398 renter occupied )
% of renters here:
29%State:
33%
Housing density: 1,866 houses/condos per square mile
Median price asked for vacant for-sale houses and condos in 2022: $546,042.
Median contract rent in 2022: $1,177 (lower quartile is $1,005, upper quartile is $1,648)
Median rent asked for vacant for-rent units in 2022: $1,501
Median gross rent in Villa Park, IL in 2022: $1,260
Housing units in Villa Park with a mortgage: 3,902 (259 second mortgage, 0 home equity loan, 243 both second mortgage and home equity loan )Houses without a mortgage: 227
Median household income for houses/condos with a mortgage: $113,477
Median household income for apartments without a mortgage: $96,084
Median monthly housing costs: $1,413
Data:
Median house or condo value ($)
Median house or condo value ($ change since 2000)
Median house or condo value ($) - White
Median house or condo value ($) - Black or African American
Median house or condo value ($) - Asian
Median house or condo value ($) - Hispanic or Latino
Median house or condo value ($) - American Indian and Alaska Native
Median house or condo value ($) - Multirace
Median house or condo value ($) - Other Race
Median price asked for mobile homes ($)
Household density (households per square mile)
Mean house or condo value by units in structure - 1, detached ($)
Mean house or condo value by units in structure - 1, attached ($)
Mean house or condo value by units in structure - 2 ($)
Mean house or condo value by units in structure by units in structure - 3 or 4 ($)
Mean house or condo value by units in structure - 5 or more ($)
Mean house or condo value by units in structure - Boat, RV, van, etc. ($)
Mean house or condo value by units in structure - Mobile home ($)
Median contract rent ($)
Median contract rent - Lower quartile ($)
Median contract rent - Upper quartile ($)
Median gross rent ($)
Urban houses (%)
Rural houses (%)
Houses occupied (%)
Houses occupied (% change since 2000)
Houses owner occupied (%)
Houses owner occupied (% change since 2000)
Houses renter occupied (%)
Houses renter occupied (% change since 2000)
Vacant housing units - For rent (%)
Vacant housing units - For rent (% change since 2000)
Vacant housing units - For sale only (%)
Vacant housing units - For sale only (% change since 2000)
Vacant housing units - Rented or sold, not occupied (%)
Vacant housing units - Rented or sold, not occupied (% change since 2000)
Vacant housing units - For seasonal, recreational, or occasional use (%)
Vacant housing units - For seasonal, recreational, or occasional use (% change since 2000)
Vacant housing units - For migrant workers (%)
Vacant housing units - For migrant workers (% change since 2000)
Vacant housing units - Other vacant (%)
Vacant housing units - Other vacant (% change since 2000)
Median monthly housing costs ($)
Median household income for houses/condos with a mortgage ($)
Median household income for houses/condos without a mortgage ($)
Median household income ($)
Median household income ($) - White
Median household income ($) - Black or African American
Median household income ($) - Asian
Median household income ($) - Hispanic or Latino
Median household income ($) - American Indian and Alaska Native
Median household income ($) - Multirace
Median household income ($) - Other Race
Mortgage status - with mortgage (%)
Mortgage status - with second mortgage (%)
Mortgage status - with home equity loan (%)
Mortgage status - with both second mortgage and home equity loan (%)
Mortgage status - without a mortgage (%)
Median year house/condo built
Median year apartment built
Household type by relationship - Male householder living alone (%)
Household type by relationship - Male householder not living alone (%)
Household type by relationship - Female householder living alone (%)
Household type by relationship - Female householder not living alone (%)
Household type by relationship - Opposite-Sex spouse (%)
Household type by relationship - Same-Sex spouse (%)
Household type by relationship - Opposite-Sex unmarried partner (%)
Household type by relationship - Same-Sex unmarried partner (%)
Household type by relationship - In group quarters (%)
Size of family households - 2-person household (%)
Size of family households - 3-person household (%)
Size of family households - 4-person household (%)
Size of family households - 5-person household (%)
Size of family households - 6-person household (%)
Size of family households - 7-or-more-person household (%)
Size of nonfamily households - 1-person household (%)
Size of nonfamily households - 2-person household (%)
Size of nonfamily households - 3-person household (%)
Size of nonfamily households - 4-person household (%)
Size of nonfamily households - 5-person household (%)
Size of nonfamily households - 6-person household (%)
Size of nonfamily households - 7-or-moreperson household (%)
Year house built - Built 2010 or later (%)
Year house built - Built 2000 to 2009 (%)
Year house built - Built 1990 to 1999 (%)
Year house built - Built 1980 to 1989 (%)
Year house built - Built 1970 to 1979 (%)
Year house built - Built 1960 to 1969 (%)
Year house built - Built 1950 to 1959 (%)
Year house built - Built 1940 to 1949 (%)
Year house built - Built 1939 or earlier (%)
Median number of rooms in houses and condos
Median number of rooms in apartments
Median number of bedrooms in owner occupied houses
Mean number of bedrooms in owner occupied houses
Median number of bedrooms in renter occupied houses
Mean number of bedrooms in renter occupied houses
Median number of vehichles in owner occupied houses
Mean number of vehichles in owner occupied houses
Median number of vehichles in renter occupied houses
Mean number of vehichles in renter occupied houses
Rooms in owner-occupied houses - 1 room (%)
Rooms in owner-occupied houses - 2 rooms (%)
Rooms in owner-occupied houses - 3 rooms (%)
Rooms in owner-occupied houses - 4 rooms (%)
Rooms in owner-occupied houses - 5 rooms (%)
Rooms in owner-occupied houses - 6 rooms (%)
Rooms in owner-occupied houses - 7 rooms (%)
Rooms in owner-occupied houses - 8 rooms (%)
Rooms in owner-occupied houses - 9+ rooms (%)
Rooms in renter-occupied houses - 1 room (%)
Rooms in renter-occupied houses - 2 rooms (%)
Rooms in renter-occupied houses - 3 rooms (%)
Rooms in renter-occupied houses - 4 rooms (%)
Rooms in renter-occupied houses - 5 rooms (%)
Rooms in renter-occupied houses - 6 rooms (%)
Rooms in renter-occupied houses - 7 rooms (%)
Rooms in renter-occupied houses - 8 rooms (%)
Rooms in renter-occupied houses - 9+ rooms (%)
Bedrooms in owner-occupied houses - no bedrooms (%)
Bedrooms in owner-occupied houses - 1 bedroom (%)
Bedrooms in owner-occupied houses - 2 bedrooms (%)
Bedrooms in owner-occupied houses - 3 bedrooms (%)
Bedrooms in owner-occupied houses - 4 bedrooms (%)
Bedrooms in owner-occupied houses - 5+ bedrooms (%)
Bedrooms in renter-occupied houses - no bedrooms (%)
Bedrooms in renter-occupied houses - 1 bedroom (%)
Bedrooms in renter-occupied houses - 2 bedrooms (%)
Bedrooms in renter-occupied houses - 3 bedrooms (%)
Bedrooms in renter-occupied houses - 4 bedrooms (%)
Bedrooms in renter-occupied houses - 5+ bedrooms (%)
Vehicles available in owner-occupied houses - no vehicle available (%)
Vehicles available in owner-occupied houses - 1 vehicle available(%)
Vehicles available in owner-occupied houses - 2 Vehicles available (%)
Vehicles available in owner-occupied houses - 3 Vehicles available (%)
Vehicles available in owner-occupied houses - 4 Vehicles available (%)
Vehicles available in owner-occupied houses - 5+ Vehicles available (%)
Vehicles available in renter-occupied houses - no vehicle available (%)
Vehicles available in renter-occupied houses - 1 vehicle available (%)
Vehicles available in renter-occupied houses - 2 Vehicles available (%)
Vehicles available in renter-occupied houses - 3 Vehicles available (%)
Vehicles available in renter-occupied houses - 4 Vehicles available (%)
Vehicles available in renter-occupied houses - 5+ Vehicles available (%)
Housing units in structures - 1, detached (%)
Housing units in structures - 1, attached (%)
Housing units in structures - 2 (%)
Housing units in structures - 3 or 4 (%)
Housing units in structures - 5 to 9 (%)
Housing units in structures - 10 to 19 (%)
Housing units in structures - 20 to 49 (%)
Housing units in structures - 50 or more (%)
Housing units in structures - Mobile home (%)
Housing units in structures - Boat, RV, van, etc. (%)
Housing units in structures - Owners - 1, detached (%)
Housing units in structures - Owners - 1, attached (%)
Housing units in structures - Owners - 2 (%)
Housing units in structures - Owners - 3 or 4 (%)
Housing units in structures - Owners - 5 to 9 (%)
Housing units in structures - Owners - 10 to 19 (%)
Housing units in structures - Owners - 20 to 49 (%)
Housing units in structures - Owners - 50 or more (%)
Housing units in structures - Owners - Mobile home (%)
Housing units in structures - Owners - Boat, RV, van, etc. (%)
Housing units in structures - Renters - 1, detached (%)
Housing units in structures - Renters - 1, attached (%)
Housing units in structures - Renters - 2 (%)
Housing units in structures - Renters - 3 or 4 (%)
Housing units in structures - Renters - 5 to 9 (%)
Housing units in structures - Renters - 10 to 19 (%)
Housing units in structures - Renters - 20 to 49 (%)
Housing units in structures - Renters - 50 or more (%)
Housing units in structures - Renters - Mobile home (%)
Housing units in structures - Renters - Boat, RV, van, etc. (%)
House/condo owner moved in on average (years ago)
Renter moved in on average (years ago)
Year householder moved into unit - Moved in 1999 to March 2000 (%)
Year householder moved into unit - Moved in 1999 to March 2000 (%) - White
Year householder moved into unit - Moved in 1999 to March 2000 (%) - Black or African American
Year householder moved into unit - Moved in 1999 to March 2000 (%) - Asian
Year householder moved into unit - Moved in 1999 to March 2000 (%) - Hispanic or Latino
Year householder moved into unit - Moved in 1999 to March 2000 (%) - American Indian and Alaska Native
Year householder moved into unit - Moved in 1999 to March 2000 (%) - Multirace
Year householder moved into unit - Moved in 1999 to March 2000 (%) - Other Race
Year householder moved into unit - Moved in 1995 to 1998 (%)
Year householder moved into unit - Moved in 1995 to 1998 (%) - White
Year householder moved into unit - Moved in 1995 to 1998 (%) - Black or African American
Year householder moved into unit - Moved in 1995 to 1998 (%) - Asian
Year householder moved into unit - Moved in 1995 to 1998 (%) - Hispanic or Latino
Year householder moved into unit - Moved in 1995 to 1998 (%) - American Indian and Alaska Native
Year householder moved into unit - Moved in 1995 to 1998 (%) - Multirace
Year householder moved into unit - Moved in 1995 to 1998 (%) - Other Race
Year householder moved into unit - Moved in 1990 to 1994 (%)
Year householder moved into unit - Moved in 1990 to 1994 (%) - White
Year householder moved into unit - Moved in 1990 to 1994 (%) - Black or African American
Year householder moved into unit - Moved in 1990 to 1994 (%) - Asian
Year householder moved into unit - Moved in 1990 to 1994 (%) - Hispanic or Latino
Year householder moved into unit - Moved in 1990 to 1994 (%) - American Indian and Alaska Native
Year householder moved into unit - Moved in 1990 to 1994 (%) - Multirace
Year householder moved into unit - Moved in 1990 to 1994 (%) - Other Race
Year householder moved into unit - Moved in 1980 to 1989 (%)
Year householder moved into unit - Moved in 1980 to 1989 (%) - White
Year householder moved into unit - Moved in 1980 to 1989 (%) - Black or African American
Year householder moved into unit - Moved in 1980 to 1989 (%) - Asian
Year householder moved into unit - Moved in 1980 to 1989 (%) - Hispanic or Latino
Year householder moved into unit - Moved in 1980 to 1989 (%) - American Indian and Alaska Native
Year householder moved into unit - Moved in 1980 to 1989 (%) - Multirace
Year householder moved into unit - Moved in 1980 to 1989 (%) - Other Race
Year householder moved into unit - Moved in 1970 to 1979 (%)
Year householder moved into unit - Moved in 1970 to 1979 (%) - White
Year householder moved into unit - Moved in 1970 to 1979 (%) - Black or African American
Year householder moved into unit - Moved in 1970 to 1979 (%) - Asian
Year householder moved into unit - Moved in 1970 to 1979 (%) - Hispanic or Latino
Year householder moved into unit - Moved in 1970 to 1979 (%) - American Indian and Alaska Native
Year householder moved into unit - Moved in 1970 to 1979 (%) - Multirace
Year householder moved into unit - Moved in 1970 to 1979 (%) - Other Race
Year householder moved into unit - Moved in 1969 or earlier (%)
Year householder moved into unit - Moved in 1969 or earlier (%) - White
Year householder moved into unit - Moved in 1969 or earlier (%) - Black or African American
Year householder moved into unit - Moved in 1969 or earlier (%) - Asian
Year householder moved into unit - Moved in 1969 or earlier (%) - Hispanic or Latino
Year householder moved into unit - Moved in 1969 or earlier (%) - American Indian and Alaska Native
Year householder moved into unit - Moved in 1969 or earlier (%) - Multirace
Year householder moved into unit - Moved in 1969 or earlier (%) - Other Race
Housing units lacking complete plumbing facilities (%)
Housing units lacking complete kitchen facilities (%)
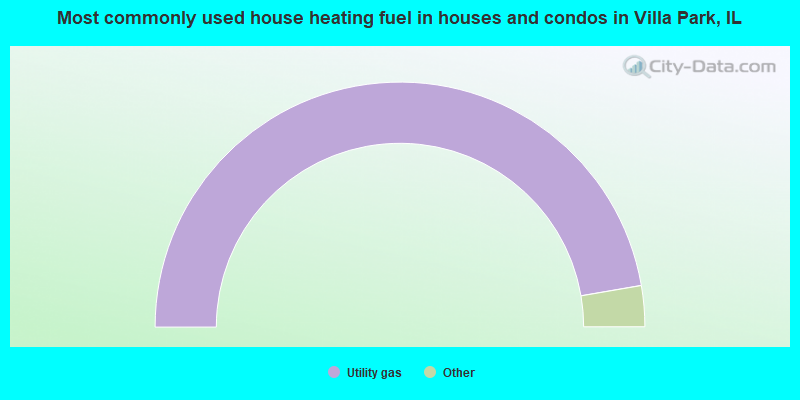
House heating fuel used in houses and condos - Utility gas (%)
House heating fuel used in houses and condos - Bottled, tank, or LP gas (%)
House heating fuel used in houses and condos - Electricity (%)
House heating fuel used in houses and condos - Fuel oil, kerosene, etc. (%)
House heating fuel used in houses and condos - Coal or coke (%)
House heating fuel used in houses and condos - Wood (%)
House heating fuel used in houses and condos - Solar energy (%)
House heating fuel used in houses and condos - Other fuel (%)
House heating fuel used in houses and condos - No fuel used (%)
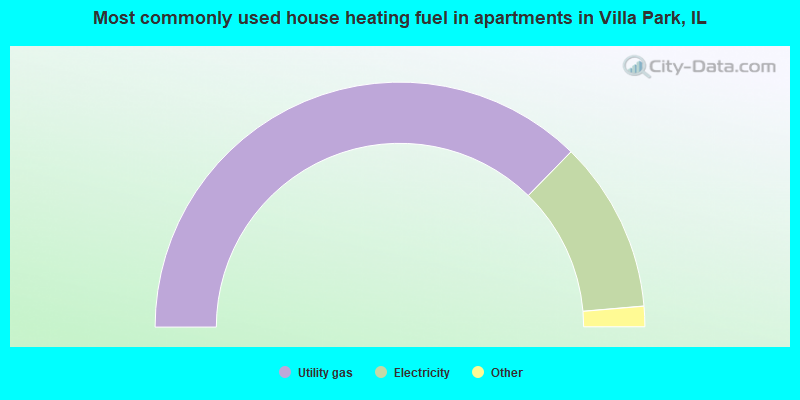
House heating fuel used in apartments - Utility gas (%)
House heating fuel used in apartments - Bottled, tank, or LP gas (%)
House heating fuel used in apartments - Electricity (%)
House heating fuel used in apartments - Fuel oil, kerosene, etc. (%)
House heating fuel used in apartments - Coal or coke (%)
House heating fuel used in apartments - Wood (%)
House heating fuel used in apartments - Solar energy (%)
House heating fuel used in apartments - Other fuel (%)
House heating fuel used in apartments - No fuel used (%)
Median year house/condo built: 1956Median year apartment built: 1966Household type by relationship:
Households: 22,516
Male householders: 4,787 (956 living alone ), Female householders: 3,377 (1,000 living alone )4,441 spouses (4,414 opposite-sex spouses ), 627 unmarried partners , (578 opposite-sex unmarried partners ), 7,673 children (7,090 natural , 78 adopted , 504 stepchildren ), 269 grandchildren , 213 brothers or sisters , 254 parents , 0 foster children , 461 other relatives , 380 non-relatives In group quarters: 30
Size of family households: 2,092 2-persons , 1,358 3-persons , 1,331 4-persons , 671 5-persons , 101 6-persons , 174 7-or-more-persons .
Size of nonfamily households: 2,028 1-person , 491 2-persons , 23 3-persons , 10 4-persons , 9 5-persons .
3,741 married couples with children. single-parent households (344 men , 469 women ).
73.2% of residents of Villa Park speak English at home. of residents speak Spanish at home (60% speak English very well , 16% speak English well , 21% speak English not well , 4% don't speak English at all ).of residents speak other Indo-European language at home (59% speak English very well , 31% speak English well , 8% speak English not well , 2% don't speak English at all ).of residents speak Asian or Pacific Island language at home (66% speak English very well , 30% speak English well , 4% speak English not well ).of residents speak other language at home (87% speak English very well , 13% speak English well ).
Foreign born population: 3,639 (16.2%)of them are naturalized citizens )
Median number of rooms in houses and condos:
Median number of rooms in apartments
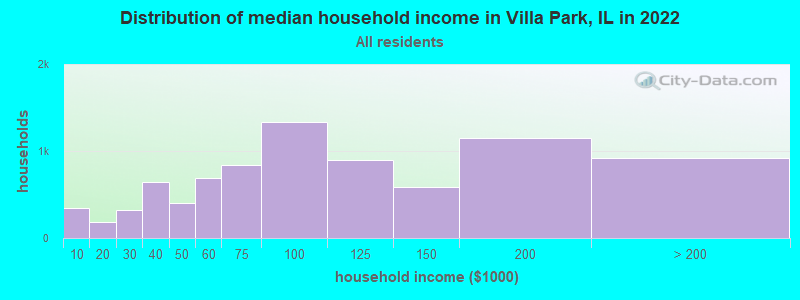
Villa Park, IL household income distribution 350 Less than $10,000188 $10,000 to $19,999324 $20,000 to $29,999645 $30,000 to $39,999409 $40,000 to $49,999691 $50,000 to $59,999847 $60,000 to $74,9991,337 $75,000 to $99,999904 $100,000 to $124,999584 $125,000 to $149,9991,157 $150,000 to $199,999923 $200,000 or more
Home value of owner - occupied houses in 2022 in Villa Park, IL 145 Less than $10,00012 $10,000 to $14,9997 $15,000 to $19,99963 $20,000 to $24,99927 $25,000 to $29,99969 $30,000 to $34,9995 $40,000 to $49,99921 $90,000 to $99,99940 $100,000 to $124,99967 $125,000 to $149,99991 $150,000 to $174,999201 $175,000 to $199,999759 $200,000 to $249,9991,623 $250,000 to $299,9992,098 $300,000 to $399,999625 $400,000 to $499,999242 $500,000 to $749,99911 $750,000 to $999,9997 $1,000,000 to $1,499,999Rent paid by renters in 2022 in Villa Park, IL 10 $200 to $2499 $250 to $2998 $350 to $3992 $400 to $44925 $450 to $4999 $550 to $59930 $700 to $74984 $800 to $899299 $900 to $999808 $1,000 to $1,249219 $1,250 to $1,499451 $1,500 to $1,999150 $2,000 to $2,49943 $2,500 to $2,99936 No cash rent
Percentage of workers working in this county: 75.5%Number of people working at home: 2,356 (19.1% of all workers )
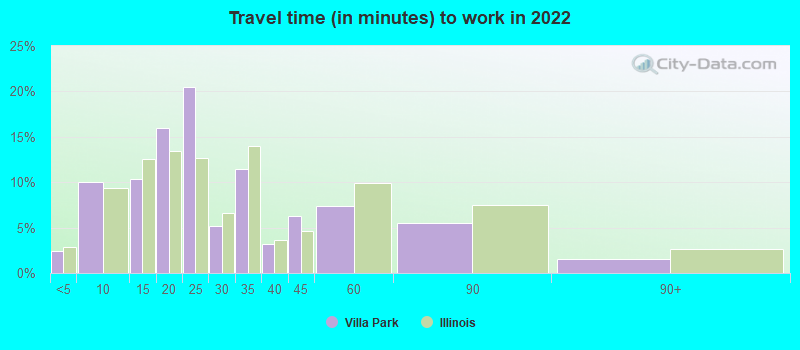
Travel time to work (commute)
Less than 5 minutes: 2255 to 9 minutes: 1,12810 to 14 minutes: 1,55115 to 19 minutes: 1,35720 to 24 minutes: 1,51625 to 29 minutes: 92930 to 34 minutes: 1,29635 to 39 minutes: 21240 to 44 minutes: 46145 to 59 minutes: 75660 to 89 minutes: 40890 or more minutes: 164
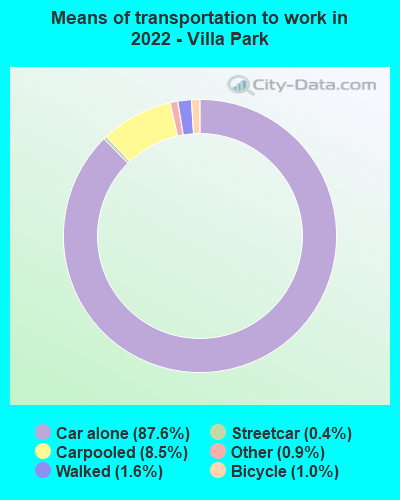
Means of transportation to work:
Drove a car alone: 5,878 (64.9%)Carpooled: 697 (7.7%)Bus : 1 (0.0%)Subway or elevated rail : 30 (0.3%)Taxi: 73 (0.8%)Bicycle: 56 (0.6%)Walked: 99 (1.1%)Worked at home: 2,356 (26.0%)
Unemployment by race in 2022
Unemployment rate for White non-Hispanic residents 4.1% Males2.9% FemalesUnemployment rate for Black residents 26.1% MalesUnemployment rate for American Indian and Alaska Native residents 6.9% FemalesUnemployment rate for Asian residents 4.2% MalesUnemployment rate for other race residents 7.4% Males6.5% FemalesUnemployment rate for two or more race residents 1.1% Males0.1% FemalesUnemployment rate for Hispanic or Latino residents 2.2% Males1.6% Females
Year of entry for the foreign-born population in Villa Park, Illinois
899 2010 or later 1,041 2000 to 2009 733 1990 to 1999 615 1980 to 1989 252 1970 to 1979 540 Before 1970
First ancestries reported:
Irish: 1,005 (9.0%)
Italian: 865 (7.8%)
German: 727 (6.5%)
English: 583 (5.2%)
Polish: 563 (5.1%)
European: 515 (4.6%)
Dutch: 315 (2.8%)
American: 211 (1.9%)
Albanian: 203 (1.8%)
African: 166 (1.5%)
Czech: 133 (1.2%)
Lithuanian: 131 (1.2%)
Swedish: 114 (1.0%)
Bulgarian: 102 (0.9%)
Norwegian: 96 (0.9%)
Yugoslavian: 85 (0.8%)
Austrian: 68 (0.6%)
Greek: 56 (0.5%)
Serbian: 46 (0.4%)
Senegalese: 38 (0.3%)
Moroccan: 34 (0.3%)
Eastern European: 31 (0.3%)
Northern European: 29 (0.3%)
Ukrainian: 29 (0.3%)
Latvian: 27 (0.2%)
Palestinian: 24 (0.2%)
Maltese: 21 (0.2%)
Scottish: 18 (0.2%)
British: 14 (0.1%)
Croatian: 13 (0.1%)
French Canadian: 12 (0.1%)
French: 11 (0.10%)
Finnish: 11 (0.10%)
Scotch-Irish: 10 (0.09%)
Canadian: 8 (0.07%)
Welsh: 7 (0.06%)
Jordanian: 2 (0.02%)
Portuguese: 2 (0.02%)
Russian: 1 (0.01%) Most common places of birth for foreign-born residents (%): Mexico Villa Park:
45.6% (1,670)Illinois:
34.7% (626,958)
India Villa Park:
6.4% (234)Illinois:
9.2% (166,409)
Guatemala Villa Park:
5.5% (202)Illinois:
1.3% (22,793)
Poland Villa Park:
4.9% (179)Illinois:
6.9% (124,474)
Colombia Villa Park:
4.3% (159)Illinois:
0.9% (16,553)
Pakistan Villa Park:
3.4% (125)Illinois:
1.6% (29,519)
Albania Villa Park:
3.2% (117)Illinois:
0.4% (6,488)
Senegal Villa Park:
3.1% (113)Illinois:
0.0% (893)
Lithuania Villa Park:
3.1% (113)Illinois:
0.6% (10,249)
Bulgaria Villa Park:
1.9% (71)Illinois:
0.8% (14,165)
Canada Villa Park:
1.9% (68)Illinois:
1.1% (19,306)
Philippines Villa Park:
1.8% (67)Illinois:
5.2% (93,003)
Other Eastern Europe Villa Park:
1.8% (65)Illinois:
0.5% (9,834)
Germany Villa Park:
1.5% (56)Illinois:
1.0% (18,753)
Place of birth for U.S.-born residents:
This state: 15,533Other state: 2,993Northeast: 442Midwest: 1,211South: 810West: 496 90.3% of Villa Park residents lived in the same house 1 years ago.
Out of people who lived in different houses, 35.4% lived in this county.
Out of people who lived in different counties, 67.2% lived in Illinois.
Villa Park:
90.3%State average:
88.3%
Education attainment for males 25 years and older:
No schooling: 79Nursery to 4th grade: 85th and 6th grade: 427th and 8th grade: 1029th grade: 1910th grade: 5011th grade: 6112th grade, no diploma: 174High school graduate (or equivalency): 2,545Less than 1 year of college: 564Some college more than 1 year, no degree: 773Associate degree: 572Bachelor's degree: 2,139Master's degree: 556Professional school degree: 103Doctorate degree: 118
Education attainment for females 25 years and older:
No schooling: 155Nursery to 4th grade: 155th and 6th grade: 1027th and 8th grade: 1039th grade: 010th grade: 1111th grade: 14512th grade, no diploma: 132High school graduate (or equivalency): 1,892Less than 1 year of college: 440Some college more than 1 year, no degree: 814Associate degree: 660Bachelor's degree: 1,801Master's degree: 701Professional school degree: 130Doctorate degree: 16
Housing units in structures:
One, detached: 6,383One, attached: 167Two: 2013 or 4: 2875 to 9: 89310 to 19: 39020 to 49: 19850 or more: 251Housing units lacking complete plumbing facilities in 2022: 0.2%Housing units lacking complete kitchen facilities in 2022: 0.8%House/condo owner moved in on average 16 years ago
Renter moved in on average 5 years ago
Private vs. public school enrollment:
Students in private schools in grades 1 to 8 (elementary and middle school): 462 Students in private schools in grades 9 to 12 (high school): 93 Students in private undergraduate colleges: 231