Housing density: 2,587 houses/condos per square mile
Median price asked for vacant for-sale houses and condos in 2022 in this county: $1,291,802.
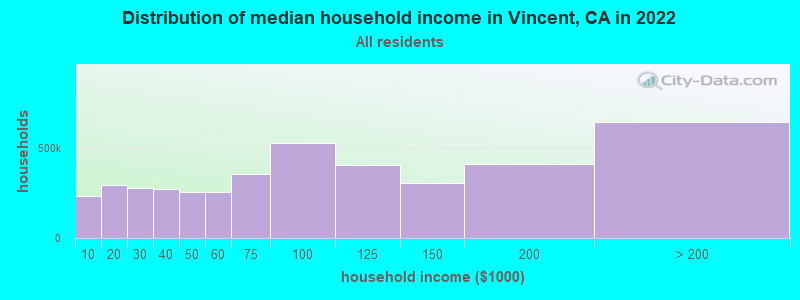
Median contract rent in 2022: over $2,000 (lower quartile is $1,744, upper quartile is over $2,000)
Median gross rent in Vincent, CA in 2022: over $2,000
Housing units in Vincent with a mortgage: 2,446 (528 second mortgage, 184 home equity loan, 13 both second mortgage and home equity loan) Houses without a mortgage: 511
In family households: 8,234,154 (1,430,848 male householders, 763,232 female householders)
1,480,665 spouses, 3,033,524 children (2,872,074 natural, 53,496 adopted, 107,954 stepchildren), 308,856 grandchildren, 205,746 brothers or sisters, 184,807 parents, foster children, 318,669 other relatives, 372,007 non-relatives
In nonfamily households: 1,412,770 (510,532 male householders (360,530 living alone)), 536,592 female householders (424,398 living alone)), 365,646 nonrelatives
In group quarters: 171,681 (68,682 institutionalized population)
1,648,001 married couples with children.
626,289 single-parent households (146,085 men, 480,204 women).
46.3% of residents of Vincent speak English at home.
46.6% of residents speak Spanish at home (55% speak English very well, 23% speak English well, 16% speak English not well, 5% don't speak English at all).
0.5% of residents speak other Indo-European language at home (69% speak English very well, 31% speak English well).
6.2% of residents speak Asian or Pacific Island language at home (53% speak English very well, 25% speak English well, 20% speak English not well, 2% don't speak English at all).
0.3% of residents speak other language at home (52% speak English very well, 48% speak English well).
Foreign born population: 3,661 (23.8%)
(75.5% of them are naturalized citizens)
Percentage of workers working in this county: 89.8% Number of people working at home: 1,297 (17.0% of all workers)
Travel time to work (commute)
Less than 5 minutes: 39
5 to 9 minutes: 564
10 to 14 minutes: 756
15 to 19 minutes: 846
20 to 24 minutes: 885
25 to 29 minutes: 305
30 to 34 minutes: 904
35 to 39 minutes: 180
40 to 44 minutes: 268
45 to 59 minutes: 677
60 to 89 minutes: 525
90 or more minutes: 170
Means of transportation to work:
Drove a car alone: 4,480 (72.5%)
Carpooled: 1,156 (18.7%)
Bus or trolley bus: 165 (2.7%)
Railroad: 29 (0.5%)
Motorcycle: 6 (0.1%)
Bicycle: 69 (1.1%)
Walked: 167 (2.7%)
Other means: 47 (0.8%)
Worked at home: 58 (0.9%)
Year of entry for the foreign-born population in Vincent, California
3591995 to March 2000
4781990 to 1994
6601985 to 1989
5521980 to 1984
6601975 to 1979
6071970 to 1974
2561965 to 1969
349Before 1965
First ancestries reported:
Other: 10,898 (71.6%)
German: 999 (6.6%)
Irish: 711 (4.7%)
English: 544 (3.6%)
Italian: 379 (2.5%)
French: 280 (1.8%)
United States: 251 (1.6%)
Norwegian: 147 (1.0%)
Scotch-Irish: 137 (0.9%)
Dutch: 126 (0.8%)
Polish: 97 (0.6%)
Swedish: 93 (0.6%)
Arab: 81 (0.5%)
French Canadian: 74 (0.5%)
Welsh: 73 (0.5%)
Portuguese: 66 (0.4%)
Scottish: 55 (0.4%)
Greek: 38 (0.2%)
Lithuanian: 34 (0.2%)
Czech: 30 (0.2%)
Hungarian: 28 (0.2%)
Russian: 27 (0.2%)
Subsaharan African: 17 (0.1%)
Danish: 15 (0.10%)
Slovak: 11 (0.07%)
Ukrainian: 4 (0.03%)
Most common places of birth for foreign-born residents (%):
Mexico
Vincent:
58.5% (2,294)
California:
44.3% (3,928,701)
Philippines
Vincent:
12.2% (477)
California:
7.5% (664,935)
El Salvador
Vincent:
6.5% (254)
California:
4.1% (359,673)
Vietnam
Vincent:
4.0% (156)
California:
4.7% (418,249)
Guatemala
Vincent:
3.1% (120)
California:
2.4% (211,458)
Nicaragua
Vincent:
1.6% (61)
California:
0.7% (64,411)
Argentina
Vincent:
1.6% (61)
California:
0.3% (29,335)
Place of birth for U.S.-born residents:
This state: 9,120
Other state: 1,960
Northeast: 299
Midwest: 753
South: 483
West: 425
61% of Vincent residents lived in the same house 5 years ago. Out of people who lived in different houses, 92% lived in this county. Out of people who lived in different counties, 75% lived in California.
Education attainment for males 25 years and older:
No schooling: 115
Nursery to 4th grade: 67
5th and 6th grade: 232
7th and 8th grade: 162
9th grade: 98
10th grade: 115
11th grade: 207
12th grade, no diploma: 249
High school graduate (or equivalency): 1,181
Less than 1 year of college: 321
Some college more than 1 year, no degree: 639
Associate degree: 248
Bachelor's degree: 323
Master's degree: 74
Professional school degree: 38
Doctorate degree: 6
Education attainment for females 25 years and older:
No schooling: 139
Nursery to 4th grade: 83
5th and 6th grade: 271
7th and 8th grade: 236
9th grade: 144
10th grade: 150
11th grade: 193
12th grade, no diploma: 220
High school graduate (or equivalency): 1,409
Less than 1 year of college: 305
Some college more than 1 year, no degree: 503
Associate degree: 227
Bachelor's degree: 403
Master's degree: 79
Professional school degree: 12
Doctorate degree: 7
Housing units in structures:
One, detached: 3,726
One, attached: 52
Two: 4
10 to 19: 7
20 to 49: 84
Mobile homes: 17
Median worth of mobile homes: $594,039
Housing units lacking complete plumbing facilities: 0.5%
Housing units lacking complete kitchen facilities: 0.8%