Housing density: 1,157 houses/condos per square mile
Median price asked for vacant for-sale houses and condos in 2022 in this county: $1,282,768.
Median contract rent in 2022: $1,636 (lower quartile is $1,397, upper quartile is $1,957)
Median rent asked for vacant for-rent units in 2022: $1,882
Median gross rent in Vineyard, UT in 2022: $1,796
Housing units in Vineyard with a mortgage: 1,784 (297 second mortgage, 0 home equity loan, 320 both second mortgage and home equity loan) Houses without a mortgage: 29
Median household income for houses/condos with a mortgage: $133,023
3,187 married couples with children.
459 single-parent households (278 men, 181 women).
82.8% of residents of Vineyard speak English at home.
12.8% of residents speak Spanish at home (56% speak English very well, 21% speak English well, 22% speak English not well, 1% don't speak English at all).
1.9% of residents speak other Indo-European language at home (99% speak English very well, 1% speak English well).
3.0% of residents speak Asian or Pacific Island language at home (72% speak English very well, 1% speak English well, 27% speak English not well).
0.1% of residents speak other language at home (100% speak English very well).
Foreign born population: 1,337 (10.0%)
(32.4% of them are naturalized citizens)
Rooms in renter-occupied apartments in Vineyard, Utah
1091 room
1462 rooms
3713 rooms
7934 rooms
7115 rooms
1116 rooms
317 rooms
758 rooms
709+ rooms
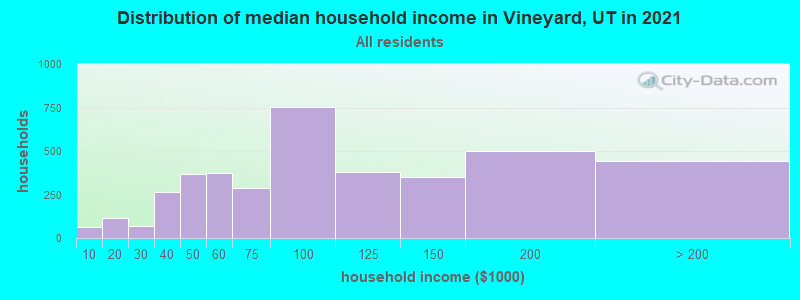
Vineyard, UT household income distribution
18Less than $10,000
163$10,000 to $19,999
45$20,000 to $29,999
249$30,000 to $39,999
346$40,000 to $49,999
268$50,000 to $59,999
453$60,000 to $74,999
857$75,000 to $99,999
381$100,000 to $124,999
355$125,000 to $149,999
713$150,000 to $199,999
587$200,000 or more
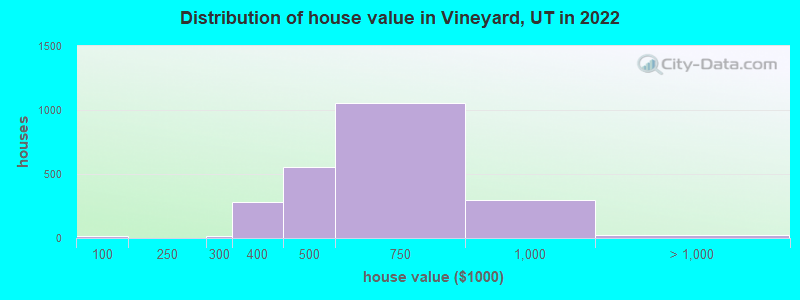
Home value of owner - occupied houses in 2022 in Vineyard, UT
12$90,000 to $99,999
17$250,000 to $299,999
284$300,000 to $399,999
551$400,000 to $499,999
1,054$500,000 to $749,999
292$750,000 to $999,999
21$1,000,000 to $1,499,999
Rent paid by renters in 2022 in Vineyard, UT
20$500 to $549
23$600 to $649
4$650 to $699
117$1,000 to $1,249
641$1,250 to $1,499
1,415$1,500 to $1,999
191$2,000 to $2,499
157No cash rent
Percentage of workers working in this county: 87.4% Number of people working at home: 1,647 (20.5% of all workers)
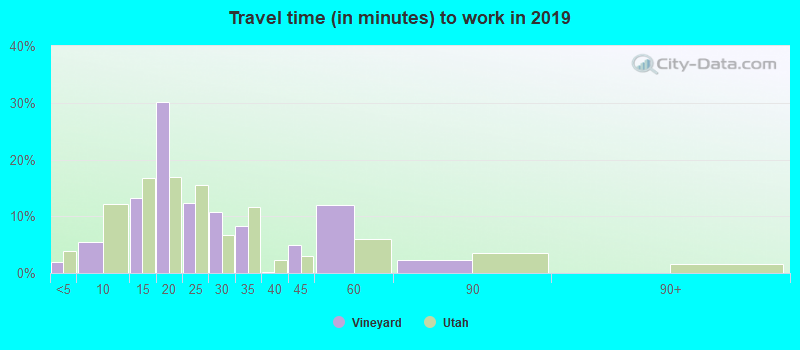
Travel time to work (commute)
Less than 5 minutes: 33
5 to 9 minutes: 943
10 to 14 minutes: 1,398
15 to 19 minutes: 1,203
20 to 24 minutes: 982
25 to 29 minutes: 396
30 to 34 minutes: 603
35 to 39 minutes: 484
40 to 44 minutes: 105
45 to 59 minutes: 194
60 to 89 minutes: 150
90 or more minutes: 48
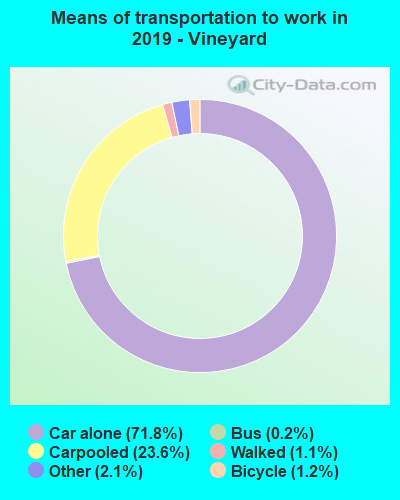
Means of transportation to work:
Drove a car alone: 1,415 (46.7%)
Carpooled: 211 (7.0%)
Bicycle: 14 (0.5%)
Walked: 22 (0.7%)
Worked at home: 1,647 (54.3%)
Unemployment by race in 2022
Unemployment rate for White non-Hispanic residents
2.2%Males
0.7%Females
Unemployment rate for Asian residents
18.1%Males
Unemployment rate for two or more race residents
3.1%Males
Unemployment rate for Hispanic or Latino residents
0.6%Males
Year of entry for the foreign-born population in Vineyard, Utah
4722010 or later
4792000 to 2009
2791990 to 1999
41980 to 1989
41970 to 1979
8Before 1970
First ancestries reported:
English: 1,691 (28.3%)
American: 489 (8.2%)
European: 353 (5.9%)
German: 343 (5.7%)
Swedish: 190 (3.2%)
Scottish: 157 (2.6%)
Irish: 147 (2.5%)
Norwegian: 93 (1.6%)
Italian: 82 (1.4%)
Nigerian: 74 (1.2%)
Welsh: 39 (0.7%)
Kenyan: 38 (0.6%)
British: 31 (0.5%)
Jamaican: 29 (0.5%)
Danish: 28 (0.5%)
Canadian: 19 (0.3%)
Scandinavian: 19 (0.3%)
Dutch: 13 (0.2%)
Polish: 13 (0.2%)
African: 13 (0.2%)
Ghanaian: 11 (0.2%)
Brazilian: 10 (0.2%)
Northern European: 9 (0.2%)
Russian: 4 (0.07%)
Portuguese: 2 (0.03%)
Most common places of birth for foreign-born residents (%):
Mexico
Vineyard:
37.9% (471)
Utah:
36.1% (99,740)
Chile
Vineyard:
10.1% (125)
Utah:
1.3% (3,479)
Ecuador
Vineyard:
8.1% (100)
Utah:
0.7% (1,957)
China, excluding Hong Kong and Taiwan
Vineyard:
7.6% (94)
Utah:
2.9% (8,017)
Venezuela
Vineyard:
6.7% (83)
Utah:
3.2% (8,804)
Micronesia
Vineyard:
5.1% (63)
Utah:
0.3% (917)
Peru
Vineyard:
4.0% (50)
Utah:
2.9% (7,901)
India
Vineyard:
3.5% (44)
Utah:
3.0% (8,294)
Costa Rica
Vineyard:
3.5% (44)
Utah:
0.2% (497)
Other Eastern Asia
Vineyard:
2.7% (34)
Utah:
0.2% (425)
Brazil
Vineyard:
2.7% (33)
Utah:
2.8% (7,644)
South Africa
Vineyard:
1.8% (22)
Utah:
0.3% (896)
Place of birth for U.S.-born residents:
This state: 7,941
Other state: 3,935
Northeast: 201
Midwest: 436
South: 696
West: 2,600
72.3% of Vineyard residents lived in the same house 1 years ago. Out of people who lived in different houses, 40.0% lived in this county. Out of people who lived in different counties, 46.7% lived in Utah.
Vineyard:
72.3%
State average:
85.7%
Education attainment for males 25 years and older:
No schooling: 0
Nursery to 4th grade: 0
5th and 6th grade: 0
7th and 8th grade: 0
9th grade: 5
10th grade: 0
11th grade: 140
12th grade, no diploma: 78
High school graduate (or equivalency): 353
Less than 1 year of college: 244
Some college more than 1 year, no degree: 591
Associate degree: 551
Bachelor's degree: 1,062
Master's degree: 545
Professional school degree: 36
Doctorate degree: 57
Education attainment for females 25 years and older:
No schooling: 0
Nursery to 4th grade: 0
5th and 6th grade: 0
7th and 8th grade: 0
9th grade: 6
10th grade: 0
11th grade: 13
12th grade, no diploma: 7
High school graduate (or equivalency): 428
Less than 1 year of college: 422
Some college more than 1 year, no degree: 519
Associate degree: 284
Bachelor's degree: 1,032
Master's degree: 234
Professional school degree: 14
Doctorate degree: 18
Housing units in structures:
One, detached: 1,567
One, attached: 878
3 or 4: 282
5 to 9: 227
10 to 19: 471
20 to 49: 762
50 or more: 344
Housing units lacking complete plumbing facilities in 2022: 0.5%
Housing units lacking complete kitchen facilities in 2022: 1.0%