Vinings, GA (Georgia) Houses and Residents
| Vinings: | $644,047 |
| Georgia: | $297,400 |
Total population: 9,734 (Urban population: 9,568, Rural population: 0)
Houses: 8,113 (7,366 occupied: 2,663 owner occupied, 4,752 renter occupied)
| % of renters here: | 64% |
| State: | 34% |
Housing density: 2,548 houses/condos per square mile
Median price asked for vacant for-sale houses and condos in 2022: $1,976,326.
Median contract rent in 2022: $1,641 (lower quartile is $1,357, upper quartile is $1,941)
Median rent asked for vacant for-rent units in 2022: $1,818
Median gross rent in Vinings, GA in 2022: $1,776
Housing units in Vinings with a mortgage: 1,905 (152 second mortgage, 57 home equity loan, 114 both second mortgage and home equity loan)
Houses without a mortgage: 23
Median household income for houses/condos with a mortgage: $182,305
Median household income for apartments without a mortgage: $118,034
Median monthly housing costs: $1,746
Compare current foreclosures near Vinings, GA:
| Photo | Address | Area | Beds / Baths | Price | Details |
|---|---|---|---|---|---|

|
#1
Clay Rd
Austell, GA 30106
|
1,412 sq. feet
|
2 baths 3 beds |
$285,000
|
show details |

|
#2
Westmont Rd SW
Atlanta, GA 30311
|
1,338 sq. feet
|
1 baths 2 beds |
$190,000
|
show details |

|
#3
Canyon Point Cir
Roswell, GA 30076
|
1,200 sq. feet
|
2 baths 2 beds |
show details | |

|
#4
Northwood Dr Apt C-1
Atlanta, GA 30342
|
1,680 sq. feet
|
2 baths 3 beds |
show details | |

|
#5
Childress Dr SW
Atlanta, GA 30311
|
1,600 sq. feet
|
2 baths 3 beds |
show details | |

|
#6
Munira Ln SW
Atlanta, GA 30331
|
2,080 sq. feet
|
3 baths 4 beds |
show details | |

|
#7
Powder Springs St
Marietta, GA 30064
|
1,416 sq. feet
|
2 baths 2 beds |
show details | |

|
#8
Roswell Rd
Atlanta, GA 30328
|
1,697 sq. feet
|
2 baths 3 beds |
show details | |

|
#9
Venetian Dr SW
Atlanta, GA 30311
|
1,627 sq. feet
|
3 baths 3 beds |
show details | |

|
#10
Peachtree St NE Apt 504
Atlanta, GA 30308
|
1,344 sq. feet
|
2 baths 3 beds |
show details |
| Photo | Address | Area | Beds / Baths | Price | Details |
|---|---|---|---|---|---|

|
#11
Heards Ferry Rd
Atlanta, GA 30328
|
3,224 sq. feet
|
5 baths 4 beds |
show details | |

|
#12
Wyndham Lakes Dr NW
Dallas, GA 30157
|
2,050 sq. feet
|
2 baths 3 beds |
show details | |

|
#13
Rosedale Dr
Hiram, GA 30141
|
2,158 sq. feet
|
3 baths 3 beds |
show details | |

|
#14
Nelenox Rd
Atlanta, GA 30324
|
- sq. feet
|
1 baths 1 beds |
show details | |

|
#15
King Fisher Dr
Atlanta, GA 30349
|
- sq. feet
|
2 baths 3 beds |
show details | |

|
#16
Caswell Pkwy
Marietta, GA 30060
|
1,960 sq. feet
|
2 baths 3 beds |
show details | |

|
#17
Macland Rd
Hiram, GA 30141
|
1,744 sq. feet
|
2 baths 3 beds |
show details | |

|
#18
Nathan Rd SW
Atlanta, GA 30331
|
1,014 sq. feet
|
2 baths 3 beds |
show details | |

|
#19
Racine St SW
Atlanta, GA 30314
|
1,080 sq. feet
|
1 baths 2 beds |
show details | |

|
#20
Tabbystone St NW
Marietta, GA 30064
|
4,661 sq. feet
|
5 baths 6 beds |
show details |
| Photo | Address | Area | Beds / Baths | Price | Details |
|---|---|---|---|---|---|

|
#21
Mountain Way NE
Atlanta, GA 30342
|
1,823 sq. feet
|
2 baths 4 beds |
show details | |

|
#22
Arbor Path Dr
Atlanta, GA 30340
|
2,599 sq. feet
|
2 baths 4 beds |
show details | |

|
#23
Somerset Ct
Atlanta, GA 30350
|
3,238 sq. feet
|
3 baths 3 beds |
show details | |

|
#24
Pine St NE
Marietta, GA 30060
|
908 sq. feet
|
2 baths 2 beds |
show details | |

|
#25
Highwood Ln
Atlanta, GA 30344
|
1,166 sq. feet
|
2 baths 3 beds |
show details | |

|
#26
Palomino Dr
Powder Springs, GA 30127
|
1,232 sq. feet
|
2 baths 3 beds |
show details | |

|
#27
Firethorn Ln
Atlanta, GA 30349
|
3,552 sq. feet
|
2 baths 4 beds |
show details | |

|
#28
Alvarado Ter SW
Atlanta, GA 30310
|
1,808 sq. feet
|
2 baths 3 beds |
show details | |

|
#29
Irvine Dr
Douglasville, GA 30135
|
2,786 sq. feet
|
3 baths 4 beds |
show details | |

|
#30
E Sussex Rd NE
Atlanta, GA 30306
|
2,836 sq. feet
|
3 baths 4 beds |
show details |
| Photo | Address | Area | Beds / Baths | Price | Details |
|---|---|---|---|---|---|

|
#31
Perch Pl 238
Atlanta, GA 30312
|
1,202 sq. feet
|
2 baths 2 beds |
show details | |

|
#32
Brighton Pt
Atlanta, GA 30328
|
1,200 sq. feet
|
2 baths 3 beds |
show details | |

|
#33
Fairfax Dr
Lithia Springs, GA 30122
|
1,702 sq. feet
|
4 baths 5 beds |
show details | |

|
#34
Marion Ct
Lithia Springs, GA 30122
|
1,723 sq. feet
|
2 baths 3 beds |
show details | |

|
#35
Wood Path Ct
Stone Mountain, GA 30083
|
1,430 sq. feet
|
2 baths 3 beds |
show details | |

|
#36
Whitmore Ct
Acworth, GA 30101
|
2,532 sq. feet
|
2 baths 4 beds |
show details | |

|
#37
Brookside Oak Cir
Norcross, GA 30093
|
2,241 sq. feet
|
3 baths 3 beds |
show details | |

|
#38
Collier Dr
Decatur, GA 30032
|
1,575 sq. feet
|
2 baths 3 beds |
show details | |

|
#39
Lawrence Pl
Atlanta, GA 30349
|
2,923 sq. feet
|
3 baths 4 beds |
show details | |

|
#40
Alyce Ave
Dallas, GA 30157
|
1,847 sq. feet
|
2 baths 3 beds |
show details |
| Photo | Address | Area | Beds / Baths | Price | Details |
|---|---|---|---|---|---|

|
#41
Glynn Oaks Cir SW
Marietta, GA 30008
|
1,404 sq. feet
|
2 baths 3 beds |
show details | |

|
#42
Bachelor St
Atlanta, GA 30344
|
812 sq. feet
|
1 baths 2 beds |
show details | |

|
#43
Ewing St SW
Atlanta, GA 30331
|
- sq. feet
|
2 baths 3 beds |
show details | |

|
#44
Estapa Dr
Powder Springs, GA 30127
|
2,230 sq. feet
|
2 baths 4 beds |
show details | |

|
#45
Slaton Drive NW
Atlanta, GA 30305
|
3,234 sq. feet
|
4 baths 3 beds |
show details | |

|
#46
To Lani Way
Stone Mountain, GA 30083
|
1,656 sq. feet
|
2 baths 3 beds |
show details | |

|
#47
Radford Cir SW
Marietta, GA 30060
|
2,178 sq. feet
|
3 baths 5 beds |
show details | |

|
#48
Glen Meadow Dr
Norcross, GA 30092
|
2,966 sq. feet
|
3 baths 4 beds |
show details | |

|
#49
Veltre Pl SW
Atlanta, GA 30311
|
1,329 sq. feet
|
3 baths 4 beds |
show details | |

|
Check over 1 million property listings on Foreclosure.com!
|
browse all offers | |||

Latest news about housing in Vinings, GA collected exclusively by city-data.com from local newspapers, TV, and radio stations


Median year apartment built: 1991
Household type by relationship:
Households: 13,050- Male householders: 3,929 (1,984 living alone), Female householders: 3,368 (1,653 living alone)
1,719 spouses (1,718 opposite-sex spouses), 676 unmarried partners, (640 opposite-sex unmarried partners), 1,840 children (1,803 natural, 27 adopted, 10 stepchildren), 24 grandchildren, 169 brothers or sisters, 237 parents, 0 foster children, 348 other relatives, 730 non-relatives
- In group quarters: 5
Size of family households: 1,739 2-persons, 390 3-persons, 225 4-persons, 133 5-persons, 144 6-persons.
Size of nonfamily households: 3,612 1-person, 907 2-persons, 129 3-persons.
1,056 married couples with children.
444 single-parent households (23 men, 421 women).
88.3% of residents of Vinings speak English at home.
6.7% of residents speak Spanish at home (74% speak English very well, 25% speak English well).
1.7% of residents speak other Indo-European language at home (100% speak English very well).
1.1% of residents speak Asian or Pacific Island language at home (73% speak English very well, 27% speak English well).
1.2% of residents speak other language at home (74% speak English very well, 26% speak English well).
Foreign born population: 1,492 (11.4%)
(39.3% of them are naturalized citizens)
| Here: | 6.8 |
| State: | 6.8 |
| Here: | 3.5 |
| State: | 4.6 |

- Bedrooms in owner-occupied houses and condos in Vinings, Georgia
- 0no bedroom
- 571 bedroom
- 9142 bedrooms
- 7003 bedrooms
- 6374 bedrooms
- 3555+ bedrooms

- Bedrooms in renter-occupied apartments in Vinings, Georgia
- 283no bedroom
- 1,8271 bedroom
- 1,9892 bedrooms
- 5033 bedrooms
- 1244 bedrooms
- 275+ bedrooms

- Cars and other vehicles available in Vinings in owner-occupied houses/condos
- 37no vehicle
- 9221 vehicle
- 1,3162 vehicles
- 3073 vehicles
- 564 vehicles
- 255+ vehicles

- Cars and other vehicles available in Vinings in renter-occupied apartments
- 146no vehicle
- 2,9591 vehicle
- 1,4702 vehicles
- 1003 vehicles
- 774 vehicles
- 05+ vehicles

- Rooms in owner-occupied houses in Vinings, Georgia
- 01 room
- 02 rooms
- 1863 rooms
- 4244 rooms
- 3635 rooms
- 3186 rooms
- 2667 rooms
- 3348 rooms
- 7729+ rooms

- Rooms in renter-occupied apartments in Vinings, Georgia
- 2611 room
- 9242 rooms
- 9873 rooms
- 1,4944 rooms
- 4345 rooms
- 4396 rooms
- 1017 rooms
- 598 rooms
- 519+ rooms


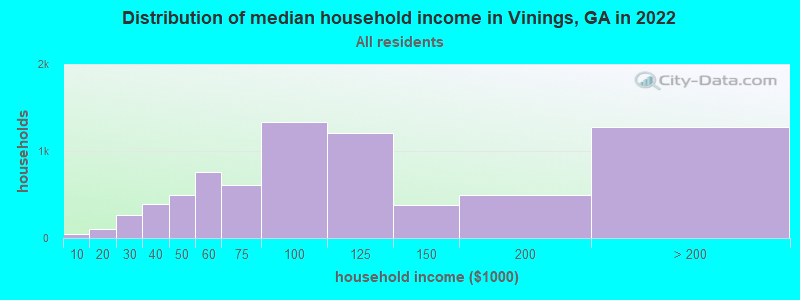
Vinings, GA household income distribution

- 43Less than $10,000
- 100$10,000 to $19,999
- 260$20,000 to $29,999
- 393$30,000 to $39,999
- 501$40,000 to $49,999
- 756$50,000 to $59,999
- 613$60,000 to $74,999
- 1,336$75,000 to $99,999
- 1,215$100,000 to $124,999
- 380$125,000 to $149,999
- 501$150,000 to $199,999
- 1,284$200,000 or more
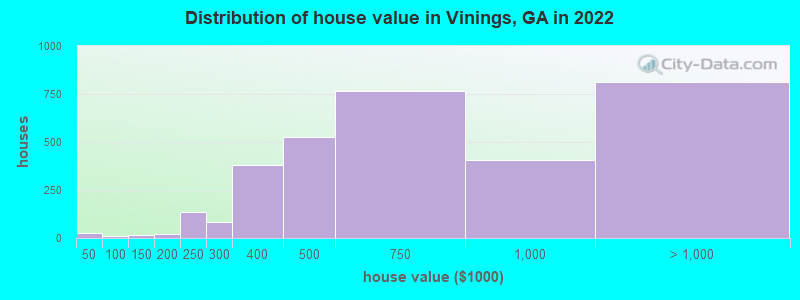
Home value of owner - occupied houses in 2022 in Vinings, GA
-
- 14Less than $10,000
- 13$40,000 to $49,999
- 14$125,000 to $149,999
- 14$150,000 to $174,999
- 7$175,000 to $199,999
- 133$200,000 to $249,999
- 82$250,000 to $299,999
- 378$300,000 to $399,999
- 523$400,000 to $499,999
- 764$500,000 to $749,999
- 404$750,000 to $999,999
- 470$1,000,000 to $1,499,999
- 156$1,500,000 to $1,999,999
- 187$2,000,000 or more
Rent paid by renters in 2022 in Vinings, GA
-
- 46$450 to $499
- 28$750 to $799
- 72$900 to $999
- 587$1,000 to $1,249
- 1,141$1,250 to $1,499
- 2,499$1,500 to $1,999
- 454$2,000 to $2,499
- 67$2,500 to $2,999
- 60$3,000 to $3,499
- 78No cash rent


Percentage of workers working in this county: 58.5%
Number of people working at home: 3,172 (35.0% of all workers)
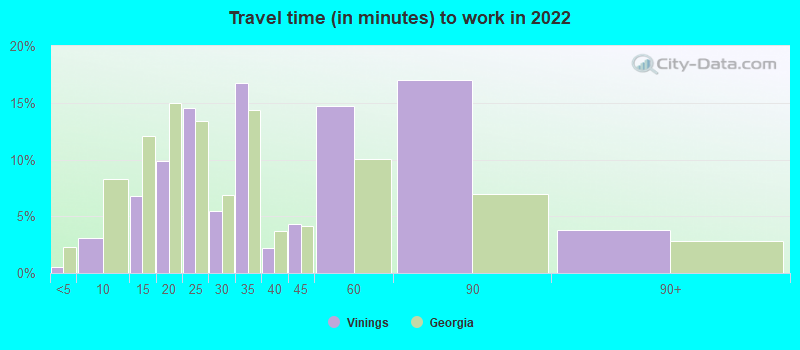
Travel time to work (commute)
- Less than 5 minutes: 21
- 5 to 9 minutes: 587
- 10 to 14 minutes: 868
- 15 to 19 minutes: 943
- 20 to 24 minutes: 883
- 25 to 29 minutes: 838
- 30 to 34 minutes: 1,035
- 35 to 39 minutes: 334
- 40 to 44 minutes: 169
- 45 to 59 minutes: 387
- 60 to 89 minutes: 144
- 90 or more minutes: 86
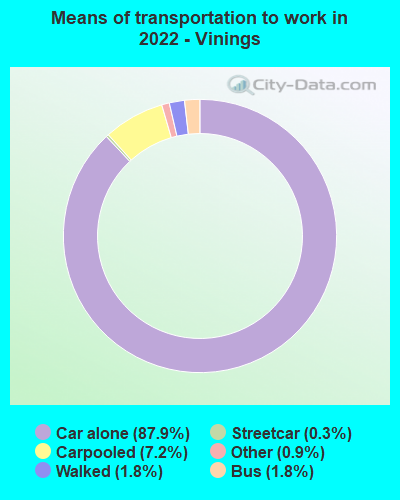
Means of transportation to work:
- Drove a car alone: 10,783 (67.6%)
- Carpooled: 1,057 (6.6%)
- Bus: 235 (1.5%)
- Subway or elevated rail: 20 (0.1%)
- Taxi: 140 (0.9%)
- Walked: 277 (1.7%)
- Worked at home: 3,172 (19.9%)

- Unemployment by race in 2022
- Unemployment rate for White non-Hispanic residents
- 2.9%Males
- 0.8%Females
- Unemployment rate for Black residents
- 3.1%Females

- Year of entry for the foreign-born population in Vinings, Georgia
- 5462010 or later
- 7192000 to 2009
- 1271990 to 1999
- 2331980 to 1989
- 971970 to 1979
- 61Before 1970
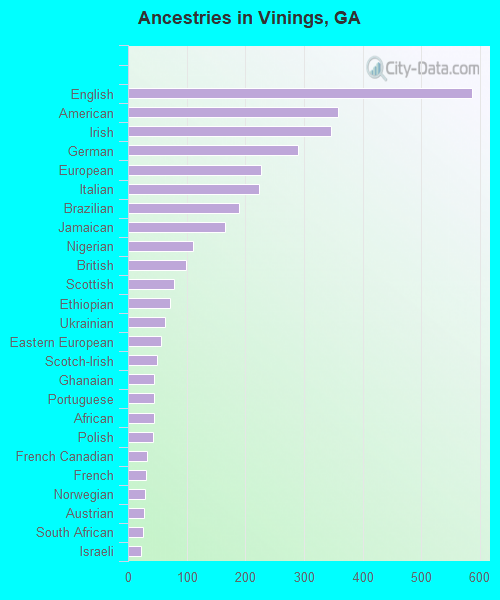
First ancestries reported:
- English: 586 (9.9%)
- American: 358 (6.0%)
- Irish: 346 (5.8%)
- German: 289 (4.9%)
- European: 226 (3.8%)
- Italian: 223 (3.8%)
- Brazilian: 190 (3.2%)
- Jamaican: 165 (2.8%)
- Nigerian: 111 (1.9%)
- British: 99 (1.7%)
- Scottish: 78 (1.3%)
- Ethiopian: 71 (1.2%)
- Ukrainian: 63 (1.1%)
- Eastern European: 56 (0.9%)
- Scotch-Irish: 49 (0.8%)
- Ghanaian: 45 (0.8%)
- Portuguese: 44 (0.7%)
- African: 44 (0.7%)
- Polish: 42 (0.7%)
- French Canadian: 32 (0.5%)
- French: 31 (0.5%)
- Norwegian: 29 (0.5%)
- Austrian: 27 (0.5%)
- South African: 25 (0.4%)
- Israeli: 22 (0.4%)
- Ugandan: 21 (0.4%)
- Dutch: 20 (0.3%)
- Russian: 18 (0.3%)
- Greek: 18 (0.3%)
- Czechoslovakian: 17 (0.3%)
- Iranian: 15 (0.3%)
- Welsh: 12 (0.2%)
- Scandinavian: 9 (0.2%)
- Hungarian: 8 (0.1%)
- Northern European: 7 (0.1%)
- Danish: 5 (0.08%)
- Swedish: 5 (0.08%)
- Armenian: 4 (0.07%)
- Celtic: 3 (0.05%)
- Turkish: 3 (0.05%)
- Swiss: 1 (0.02%)
Most common places of birth for foreign-born residents (%):
| Vinings: | 15.0% (219) |
| Georgia: | 1.7% (19,012) |
| Vinings: | 13.8% (201) |
| Georgia: | 1.6% (18,211) |
| Vinings: | 10.5% (153) |
| Georgia: | 4.6% (51,270) |
| Vinings: | 9.0% (131) |
| Georgia: | 9.2% (103,325) |
| Vinings: | 5.8% (85) |
| Georgia: | 0.4% (4,193) |
| Vinings: | 4.9% (71) |
| Georgia: | 1.6% (17,643) |
| Vinings: | 4.4% (64) |
| Georgia: | 3.9% (43,756) |
| Vinings: | 4.0% (59) |
| Georgia: | 0.5% (6,116) |
| Vinings: | 3.7% (54) |
| Georgia: | 0.8% (8,849) |
| Vinings: | 3.4% (50) |
| Georgia: | 0.2% (2,141) |
| Vinings: | 2.7% (39) |
| Georgia: | 4.1% (45,797) |
| Vinings: | 2.6% (38) |
| Georgia: | 20.0% (223,400) |
| Vinings: | 2.3% (33) |
| Georgia: | 3.5% (39,227) |
| Vinings: | 2.2% (32) |
| Georgia: | 1.0% (11,747) |
| Vinings: | 2.1% (31) |
| Georgia: | 0.6% (6,963) |
| Vinings: | 1.7% (25) |
| Georgia: | 0.4% (5,023) |
| Vinings: | 1.6% (24) |
| Georgia: | 0.3% (3,330) |
| Vinings: | 1.6% (24) |
| Georgia: | 1.2% (12,946) |
| Vinings: | 1.6% (23) |
| Georgia: | 2.5% (27,846) |
Place of birth for U.S.-born residents:
- This state: 4,506
- Other state: 6,809
- Northeast: 1,510
- Midwest: 1,639
- South: 3,148
- West: 501
74.8% of Vinings residents lived in the same house 1 years ago.
Out of people who lived in different houses, 26.3% lived in this county.
Out of people who lived in different counties, 41.9% lived in Georgia.
| Vinings: | 74.8% |
| State average: | 86.6% |
Education attainment for males 25 years and older:
- No schooling: 0
- Nursery to 4th grade: 0
- 5th and 6th grade: 0
- 7th and 8th grade: 0
- 9th grade: 0
- 10th grade: 0
- 11th grade: 34
- 12th grade, no diploma: 28
- High school graduate (or equivalency): 416
- Less than 1 year of college: 150
- Some college more than 1 year, no degree: 743
- Associate degree: 196
- Bachelor's degree: 2,570
- Master's degree: 727
- Professional school degree: 357
- Doctorate degree: 83

Education attainment for females 25 years and older:
- No schooling: 0
- Nursery to 4th grade: 0
- 5th and 6th grade: 0
- 7th and 8th grade: 0
- 9th grade: 0
- 10th grade: 0
- 11th grade: 21
- 12th grade, no diploma: 11
- High school graduate (or equivalency): 472
- Less than 1 year of college: 124
- Some college more than 1 year, no degree: 827
- Associate degree: 240
- Bachelor's degree: 1,851
- Master's degree: 1,054
- Professional school degree: 372
- Doctorate degree: 129


Housing units in structures:
- One, detached: 1,158
- One, attached: 1,061
- Two: 105
- 3 or 4: 229
- 5 to 9: 884
- 10 to 19: 2,110
- 20 to 49: 1,123
- 50 or more: 1,431
- Mobile homes: 9
Housing units lacking complete kitchen facilities in 2022: 1.0%
House/condo owner moved in on average 7 years ago
Renter moved in on average 1 years ago

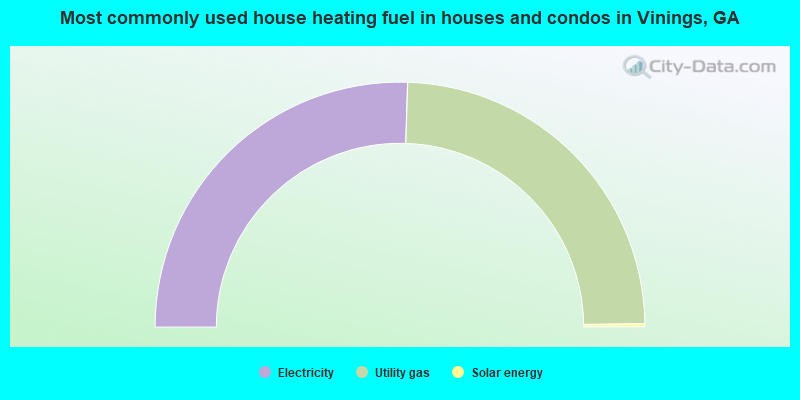
- 51.0%Electricity
- 48.6%Utility gas
- 0.4%Solar energy
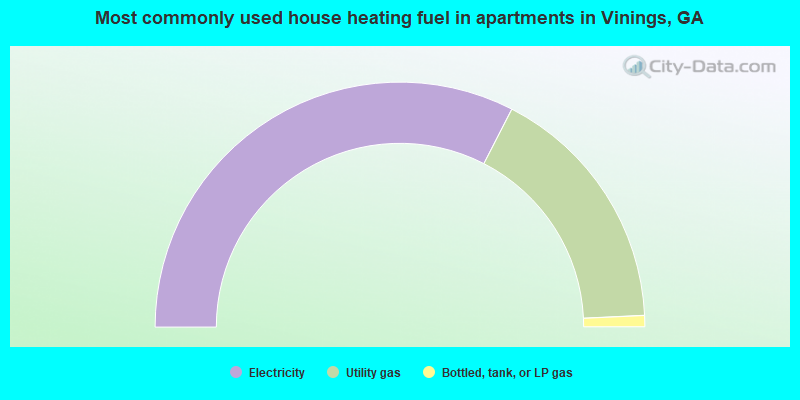
- 65.1%Electricity
- 33.4%Utility gas
- 1.5%Bottled, tank, or LP gas
Private vs. public school enrollment:
| Here: | 38.0% |
| Georgia: | 12.1% |
| Here: | 51.1% |
| Georgia: | 10.8% |
| Here: | 9.3% |
| Georgia: | 17.1% |


