Jump to a detailed profile or search site with Google Custom Search

Visalia, CA (California) Houses and Residents

Estimated median house or condo value in 2022: $360,500 (it was $112,200 in 2000)
Visalia:

$360,500
California:

$715,900
Lower value quartile - upper value quartile: $275,400 - $456,500

Mean price in 2022:

Detached houses: $387,761
Here:

$387,761
State:

$988,808

Townhouses or other attached units: $250,931
Here:

$250,931
State:

$838,546

In 2-unit structures: $312,320
Here:

$312,320
State:

$1,138,100

In 3-to-4-unit structures: $388,113
Here:

$388,113
State:

$824,253

In 5-or-more-unit structures: $779,809
Here:

$779,809
State:

$730,996

Mobile homes: $71,024
Here:

$71,024
State:

$184,506

Total population: 129,281 (Urban population: 91,106, Rural population: 407 (all nonfarm))

Houses: 49,550 (46,975 occupied: 28,743 owner occupied, 18,232 renter occupied)

% of renters here:

39%
State:

44%

Housing density: 1,734 houses/condos per square mile

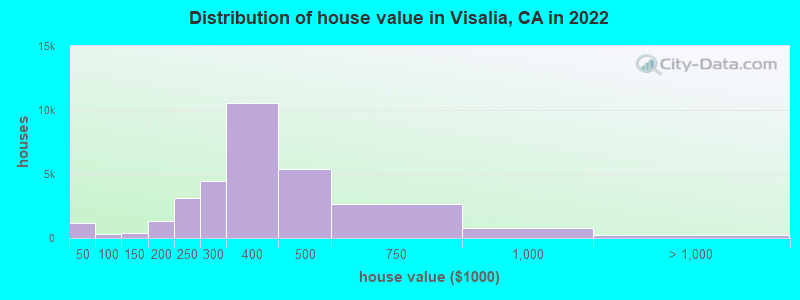
Median price asked for vacant for-sale houses and condos in 2022: $410,921.

Median contract rent in 2022: $1,221 (lower quartile is $929, upper quartile is $1,555)


Median rent asked for vacant for-rent units in 2022: $2,337


Median gross rent in Visalia, CA in 2022: $1,483

Housing units in Visalia with a mortgage: 20,328 (1,077 second mortgage, 136 home equity loan, 716 both second mortgage and home equity loan)
Houses without a mortgage: 164

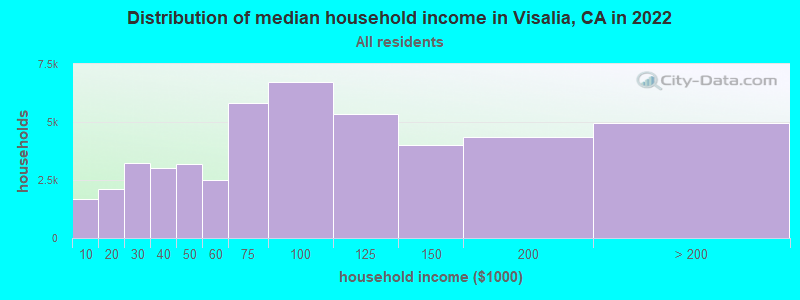
Median household income for houses/condos with a mortgage: $111,863

Median household income for apartments without a mortgage: $74,111

Median monthly housing costs: $1,472

Compare current foreclosures in Visalia, CA:

Check out more offers in Visalia, CA.
Powered by Foreclosure.com

Settings
X
Data:
Loading data...
Based on 2000-2022 data
Loading data...

123
Hide US histogram

Latest news about housing in Visalia, CA collected exclusively by city-data.com from local newspapers, TV, and radio stations

Visalia, California Age and Sex of Residents
Median year house/condo built: 1992

Median year apartment built: 1986

Household type by relationship:

Households: 143,965
  • Male householders: 24,352 (4,657 living alone), Female householders: 22,623 (4,792 living alone)
  • 21,178 spouses (20,890 opposite-sex spouses), 6,501 unmarried partners, (6,258 opposite-sex unmarried partners), 44,697 children (40,560 natural, 1,160 adopted, 2,977 stepchildren), 5,425 grandchildren, 4,274 brothers or sisters, 4,544 parents, 0 foster children, 3,720 other relatives, 4,379 non-relatives
  • In group quarters: 2,272

Size of family households: 10,822 2-persons, 7,102 3-persons, 7,140 4-persons, 4,991 5-persons, 2,269 6-persons, 863 7-or-more-persons.

Size of nonfamily households: 9,449 1-person, 3,529 2-persons, 345 3-persons, 158 4-persons, 307 6-persons.

21,131 married couples with children.
12,286 single-parent households (2,418 men, 9,868 women).

64.6% of residents of Visalia speak English at home.
30.9% of residents speak Spanish at home (73% speak English very well, 10% speak English well, 11% speak English not well, 6% don't speak English at all).
1.7% of residents speak other Indo-European language at home (86% speak English very well, 8% speak English well, 4% speak English not well, 2% don't speak English at all).
3.6% of residents speak Asian or Pacific Island language at home (69% speak English very well, 20% speak English well, 8% speak English not well, 3% don't speak English at all).
0.7% of residents speak other language at home (83% speak English very well, 13% speak English well, 2% speak English not well, 1% don't speak English at all).

Foreign born population: 21,913 (15.2%)
(49.1% of them are naturalized citizens)

Median number of rooms in houses and condos:
Here:

6.1
State:

6.0

Median number of rooms in apartments
Here:

4.4
State:

3.9

Owner-occupied Renter-occupied
Bedrooms in owner-occupied houses and condos in Visalia, California
  • Bedrooms in owner-occupied houses and condos in Visalia, California
  • 291no bedroom
  • 2201 bedroom
  • 2,1002 bedrooms
  • 17,4393 bedrooms
  • 7,6954 bedrooms
  • 9985+ bedrooms
Bedrooms in renter-occupied apartments in Visalia, California
  • Bedrooms in renter-occupied apartments in Visalia, California
  • 993no bedroom
  • 1,5611 bedroom
  • 7,5542 bedrooms
  • 6,1393 bedrooms
  • 1,8194 bedrooms
  • 1665+ bedrooms
Owner-occupied Renter-occupied
Cars and other vehicles available in Visalia in owner-occupied houses/condos
  • Cars and other vehicles available in Visalia in owner-occupied houses/condos
  • 336no vehicle
  • 6,2291 vehicle
  • 12,1722 vehicles
  • 6,0973 vehicles
  • 2,6454 vehicles
  • 1,2645+ vehicles
Cars and other vehicles available in Visalia in renter-occupied apartments
  • Cars and other vehicles available in Visalia in renter-occupied apartments
  • 943no vehicle
  • 6,7751 vehicle
  • 6,8302 vehicles
  • 2,5523 vehicles
  • 6574 vehicles
  • 4755+ vehicles
Owner-occupied Renter-occupied
Rooms in owner-occupied houses in Visalia, California
  • Rooms in owner-occupied houses in Visalia, California
  • 2911 room
  • 1162 rooms
  • 1913 rooms
  • 2,1624 rooms
  • 6,1745 rooms
  • 8,9226 rooms
  • 5,6837 rooms
  • 2,9478 rooms
  • 2,2579+ rooms
Rooms in renter-occupied apartments in Visalia, California
  • Rooms in renter-occupied apartments in Visalia, California
  • 9931 room
  • 2332 rooms
  • 2,2693 rooms
  • 6,2014 rooms
  • 3,6245 rooms
  • 1,8656 rooms
  • 1,3537 rooms
  • 1,3948 rooms
  • 3009+ rooms
Year house built
Median 2022 house/condo value by year built
Median house/condo value by year householder moved into unit
Breakdown of mean house values by ages of householders
Owners and renters by unit type in Visalia, CA
  • Visalia, CA household income distribution

  • Distribution of median household income in Visalia, CA in 2022
  • 1,665Less than $10,000
  • 2,132$10,000 to $19,999
  • 3,248$20,000 to $29,999
  • 3,011$30,000 to $39,999
  • 3,210$40,000 to $49,999
  • 2,482$50,000 to $59,999
  • 5,830$60,000 to $74,999
  • 6,709$75,000 to $99,999
  • 5,364$100,000 to $124,999
  • 4,004$125,000 to $149,999
  • 4,352$150,000 to $199,999
  • 4,968$200,000 or more
  • Home value of owner - occupied houses in 2022 in Visalia, CA

  • Distribution of house value in Visalia, CA in 2022
  • 438Less than $10,000
  • 147$10,000 to $14,999
  • 77$15,000 to $19,999
  • 91$20,000 to $24,999
  • 121$25,000 to $29,999
  • 114$30,000 to $34,999
  • 130$35,000 to $39,999
  • 70$40,000 to $49,999
  • 57$50,000 to $59,999
  • 56$60,000 to $69,999
  • 53$70,000 to $79,999
  • 69$80,000 to $89,999
  • 38$90,000 to $99,999
  • 170$100,000 to $124,999
  • 196$125,000 to $149,999
  • 706$150,000 to $174,999
  • 650$175,000 to $199,999
  • 3,103$200,000 to $249,999
  • 4,425$250,000 to $299,999
  • 10,510$300,000 to $399,999
  • 5,369$400,000 to $499,999
  • 2,685$500,000 to $749,999
  • 808$750,000 to $999,999
  • 168$1,000,000 to $1,499,999
  • 26$1,500,000 to $1,999,999
  • 64$2,000,000 or more
  • Rent paid by renters in 2022 in Visalia, CA

  • Distribution of rent paid by renters in Visalia, CA in 2022
  • 27Less than $100
  • 6$150 to $199
  • 39$200 to $249
  • 114$250 to $299
  • 147$300 to $349
  • 49$350 to $399
  • 31$400 to $449
  • 238$450 to $499
  • 537$500 to $549
  • 236$550 to $599
  • 390$600 to $649
  • 234$650 to $699
  • 998$700 to $749
  • 444$750 to $799
  • 1,501$800 to $899
  • 2,000$900 to $999
  • 4,320$1,000 to $1,249
  • 2,861$1,250 to $1,499
  • 2,860$1,500 to $1,999
  • 411$2,000 to $2,499
  • 195$2,500 to $2,999
  • 86$3,000 to $3,499
  • 189$3,500 or more
  • 1,011No cash rent
Time Leaving Home To Go To Work in 2022

Percentage of workers working in this county: 84.9%
Number of people working at home: 4,194 (6.7% of all workers)

Travel time (in minutes) to work in 2022

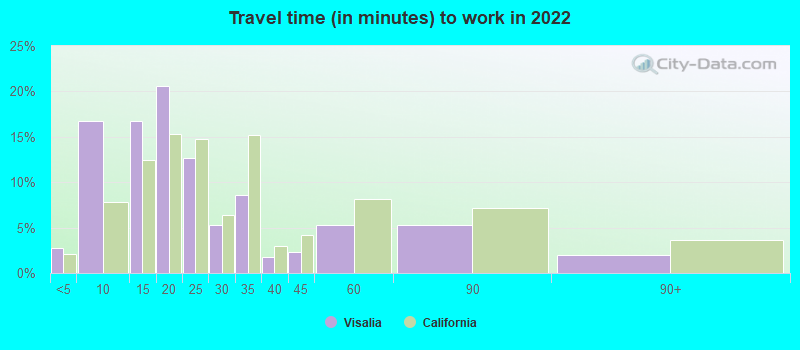
Travel time to work (commute)

  • Less than 5 minutes: 1,754
  • 5 to 9 minutes: 9,880
  • 10 to 14 minutes: 13,466
  • 15 to 19 minutes: 11,653
  • 20 to 24 minutes: 6,537
  • 25 to 29 minutes: 3,752
  • 30 to 34 minutes: 3,964
  • 35 to 39 minutes: 1,040
  • 40 to 44 minutes: 2,488
  • 45 to 59 minutes: 4,346
  • 60 to 89 minutes: 2,335
  • 90 or more minutes: 1,121
Means of transportation to work in 2022 - Visalia

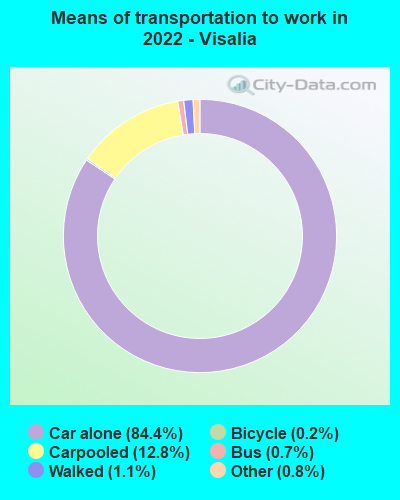
Means of transportation to work:

  • Drove a car alone: 52,719 (76.8%)
  • Carpooled: 9,963 (14.5%)
  • Bus: 188 (0.3%)
  • Light rail, streetcar or trolley: 9 (0.0%)
  • Taxi: 410 (0.6%)
  • Bicycle: 100 (0.1%)
  • Walked: 667 (1.0%)
  • Worked at home: 4,194 (6.1%)
Class of Workers in 2022
  • Unemployment by race in 2022
  • Unemployment rate for White non-Hispanic residents
  • 3.9%Males
  • 4.8%Females
  • Unemployment rate for Black residents
  • 2.3%Males
  • 3.8%Females
  • Unemployment rate for American Indian and Alaska Native residents
  • 10.1%Males
  • 5.3%Females
  • Unemployment rate for Asian residents
  • 8.6%Males
  • 6.7%Females
  • Unemployment rate for other race residents
  • 4.4%Males
  • 4.4%Females
  • Unemployment rate for two or more race residents
  • 4.1%Males
  • 4.5%Females
  • Unemployment rate for Hispanic or Latino residents
  • 3.4%Males
  • 2.7%Females
Year of entry for the foreign-born population in Visalia, California
  • Year of entry for the foreign-born population in Visalia, California
  • 3,5202010 or later
  • 4,3062000 to 2009
  • 4,3831990 to 1999
  • 4,6141980 to 1989
  • 1,7671970 to 1979
  • 1,577Before 1970
Ancestries in Visalia, CA

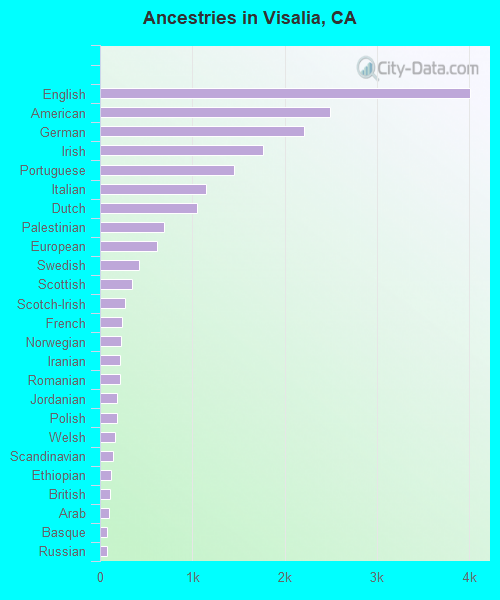
First ancestries reported:

  • English: 4,015 (4.6%)
  • American: 2,493 (2.9%)
  • German: 2,212 (2.6%)
  • Irish: 1,763 (2.0%)
  • Portuguese: 1,450 (1.7%)
  • Italian: 1,150 (1.3%)
  • Dutch: 1,053 (1.2%)
  • Palestinian: 690 (0.8%)
  • European: 613 (0.7%)
  • Swedish: 422 (0.5%)
  • Scottish: 349 (0.4%)
  • Scotch-Irish: 275 (0.3%)
  • French: 239 (0.3%)
  • Norwegian: 224 (0.3%)
  • Iranian: 222 (0.3%)
  • Romanian: 215 (0.2%)
  • Jordanian: 189 (0.2%)
  • Polish: 186 (0.2%)
  • Welsh: 160 (0.2%)
  • Scandinavian: 146 (0.2%)
  • Ethiopian: 116 (0.1%)
  • British: 111 (0.1%)
  • Arab: 94 (0.1%)
  • Basque: 77 (0.09%)
  • Russian: 74 (0.09%)
  • Ukrainian: 63 (0.07%)
  • Egyptian: 59 (0.07%)
  • Armenian: 59 (0.07%)
  • Brazilian: 53 (0.06%)
  • Nigerian: 49 (0.06%)
  • Danish: 47 (0.05%)
  • African: 47 (0.05%)
  • Hungarian: 39 (0.05%)
  • Belizean: 35 (0.04%)
  • Moroccan: 33 (0.04%)
  • Austrian: 32 (0.04%)
  • French Canadian: 26 (0.03%)
  • Swiss: 26 (0.03%)
  • Lebanese: 25 (0.03%)
  • Finnish: 25 (0.03%)
  • Eastern European: 24 (0.03%)
  • Czech: 24 (0.03%)
  • Serbian: 24 (0.03%)
  • Belgian: 23 (0.03%)
  • Israeli: 18 (0.02%)
  • Czechoslovakian: 17 (0.02%)
  • Celtic: 17 (0.02%)
  • Haitian: 16 (0.02%)
  • Guyanese: 14 (0.02%)
  • Northern European: 14 (0.02%)
  • Greek: 11 (0.01%)
  • Canadian: 8 (0.01%)

Most common places of birth for foreign-born residents (%):

Mexico
Visalia:

64.0% (12,923)
California:

37.2% (3,881,193)

China, excluding Hong Kong and Taiwan
Visalia:

3.4% (686)
California:

6.6% (684,672)

Thailand
Visalia:

2.8% (567)
California:

0.6% (65,335)

Philippines
Visalia:

2.7% (538)
California:

7.8% (818,297)

Guatemala
Visalia:

2.5% (511)
California:

2.8% (290,436)

Laos
Visalia:

2.5% (497)
California:

0.5% (48,911)

Korea
Visalia:

2.3% (466)
California:

3.0% (315,248)

India
Visalia:

2.2% (444)
California:

5.2% (539,184)

Peru
Visalia:

2.1% (420)
California:

0.7% (74,025)

Place of birth for U.S.-born residents:

  • This state: 104,903
  • Other state: 15,688
  • Northeast: 2,299
  • Midwest: 4,676
  • South: 5,030
  • West: 3,683

92.1% of Visalia residents lived in the same house 1 years ago.
   Out of people who lived in different houses, 39.1% lived in this county.
   Out of people who lived in different counties, 82.7% lived in California.


Visalia:

92.1%
State average:

88.9%

Education attainment for males 25 years and older:

  • No schooling: 2,438
  • Nursery to 4th grade: 785
  • 5th and 6th grade: 1,008
  • 7th and 8th grade: 804
  • 9th grade: 104
  • 10th grade: 198
  • 11th grade: 1,063
  • 12th grade, no diploma: 1,231
  • High school graduate (or equivalency): 12,421
  • Less than 1 year of college: 3,253
  • Some college more than 1 year, no degree: 8,350
  • Associate degree: 5,376
  • Bachelor's degree: 5,514
  • Master's degree: 2,788
  • Professional school degree: 1,421
  • Doctorate degree: 789
Educational Attainment for Males

Education attainment for females 25 years and older:

  • No schooling: 1,310
  • Nursery to 4th grade: 149
  • 5th and 6th grade: 642
  • 7th and 8th grade: 705
  • 9th grade: 245
  • 10th grade: 299
  • 11th grade: 718
  • 12th grade, no diploma: 724
  • High school graduate (or equivalency): 11,265
  • Less than 1 year of college: 2,845
  • Some college more than 1 year, no degree: 9,627
  • Associate degree: 6,006
  • Bachelor's degree: 7,129
  • Master's degree: 3,274
  • Professional school degree: 724
  • Doctorate degree: 509
Educational Attainment for Females
Visalia marital status for males
Visalia marital status for females

Housing units in structures:

  • One, detached: 35,913
  • One, attached: 2,050
  • Two: 2,727
  • 3 or 4: 3,798
  • 5 to 9: 1,388
  • 10 to 19: 346
  • 20 to 49: 699
  • 50 or more: 870
  • Mobile homes: 1,709
  • Boats, RVs, vans, etc.: 50

Median worth of mobile homes: $53,537

Housing units lacking complete plumbing facilities in 2022: 0.5%

Housing units lacking complete kitchen facilities in 2022: 1.3%

House/condo owner moved in on average 8 years ago

Renter moved in on average 3 years ago

Year householders moved into residence in Visalia
Houses and condos Apartments
Most commonly used house heating fuel in houses and condos in Visalia, CA
  • 79.0%Utility gas
  • 16.4%Electricity
  • 2.1%Solar energy
  • 1.0%Bottled, tank, or LP gas
  • 1.0%No fuel used
  • 0.4%Wood
Most commonly used house heating fuel in apartments in Visalia, CA
  • 67.6%Utility gas
  • 28.0%Electricity
  • 1.9%Bottled, tank, or LP gas
  • 1.0%No fuel used
  • 0.9%Solar energy
  • 0.4%Other fuel
  • 0.2%Wood

Private vs. public school enrollment:

Students in private schools in grades 1 to 8 (elementary and middle school): 1,706
Here:

9.5%
California:

10.5%

Students in private schools in grades 9 to 12 (high school): 350
Here:

4.4%
California:

8.5%

Students in private undergraduate colleges: 410
Here:

5.4%
California:

15.9%
School Enrollment by Level of School for Male Students
School Enrollment by Level of School for Female Students
Age and Sex of Sensory-Disabled Noninstitutionalized Residents
Age and Sex of Physically-Disabled Noninstitutionalized Residents
Age and Sex of Mentally-Disabled Noninstitutionalized Residents
Age and Sex of Self-Care Disabled Noninstitutionalized Residents
Age and Sex of Go-Outside-Home Disabled Noninstitutionalized Residents
Age and Sex of Noninstitutionalized Residents with Employment Disability