Jump to a detailed profile or search site with Google Custom Search

Vista, CA (California) Houses and Residents

Estimated median house or condo value in 2022: $739,500 (it was $188,700 in 2000)
Vista:

$739,500
California:

$715,900
Lower value quartile - upper value quartile: $561,900 - $919,200

Mean price in 2022:

Detached houses: $836,229
Here:

$836,229
State:

$988,808

Townhouses or other attached units: $574,490
Here:

$574,490
State:

$838,546

In 2-unit structures: $477,072
Here:

$477,072
State:

$1,138,100

In 3-to-4-unit structures: $574,633
Here:

$574,633
State:

$824,253

In 5-or-more-unit structures: $916,335
Here:

$916,335
State:

$730,996

Mobile homes: $175,609
Here:

$175,609
State:

$184,506

Occupied boats, RVs, vans, etc.: $58,488
Here:

$58,488
State:

$204,957

Total population: 98,079 (Urban population: 90,081, Rural population: 50 (all nonfarm))

Houses: 34,700 (33,232 occupied: 18,277 owner occupied, 14,955 renter occupied)

% of renters here:

45%
State:

44%

Housing density: 1,857 houses/condos per square mile

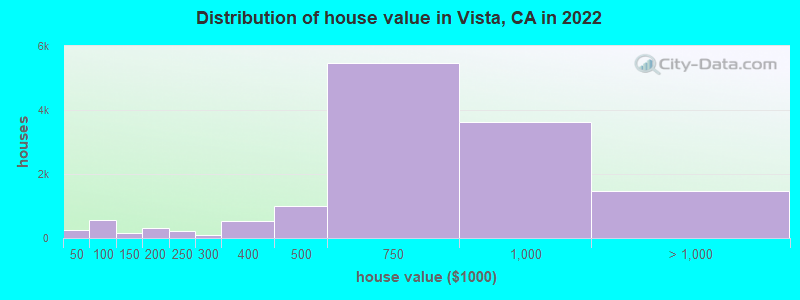
Median price asked for vacant for-sale houses and condos in 2022: $1,291,412.

Median contract rent in 2022: $1,874 (lower quartile is $1,523, upper quartile is over $2,000)


Median rent asked for vacant for-rent units in 2022: $1,929


Median gross rent in Vista, CA in 2022: over $2,000

Housing units in Vista with a mortgage: 12,972 (997 second mortgage, 45 home equity loan, 683 both second mortgage and home equity loan)
Houses without a mortgage: 47

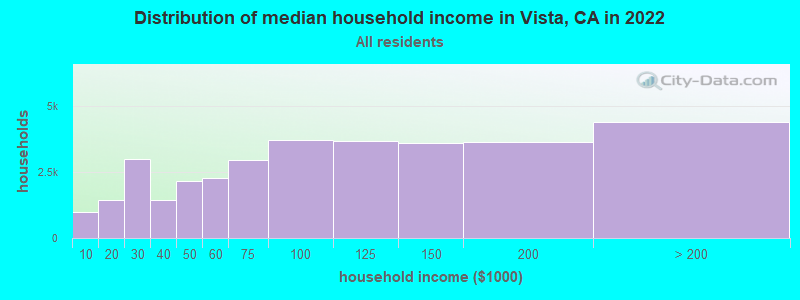
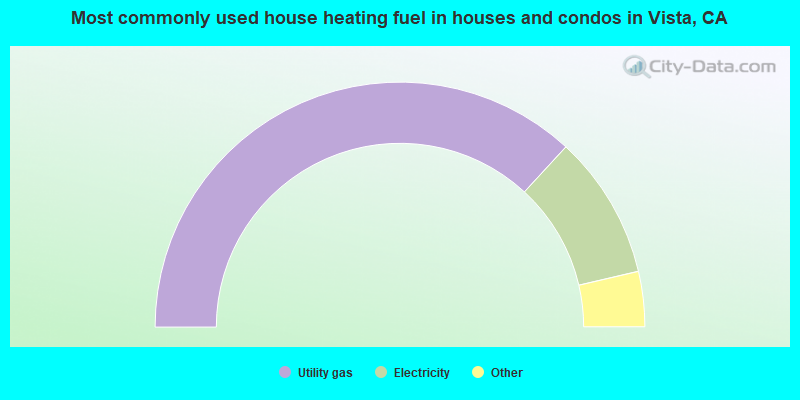
Median household income for houses/condos with a mortgage: $133,624

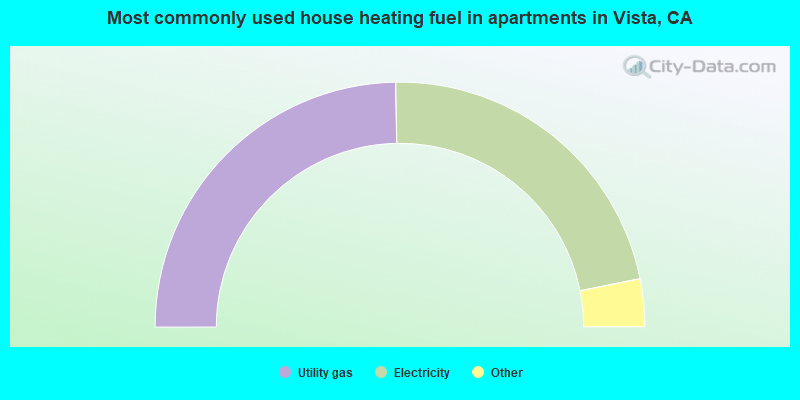
Median household income for apartments without a mortgage: $62,093

Median monthly housing costs: $2,076

Compare current foreclosures in Vista, CA:

Check out more offers in Vista, CA.
Powered by Foreclosure.com

Settings
X
Data:
Loading data...
Based on 2000-2022 data
Loading data...

123
Hide US histogram

Latest news about housing in Vista, CA collected exclusively by city-data.com from local newspapers, TV, and radio stations

Vista, California Age and Sex of Residents
Median year house/condo built: 1983

Median year apartment built: 1987

Household type by relationship:

Households: 97,766
  • Male householders: 17,706 (3,468 living alone), Female householders: 15,526 (4,150 living alone)
  • 16,881 spouses (16,291 opposite-sex spouses), 1,998 unmarried partners, (1,684 opposite-sex unmarried partners), 25,542 children (24,553 natural, 376 adopted, 613 stepchildren), 3,239 grandchildren, 2,779 brothers or sisters, 3,216 parents, 0 foster children, 3,487 other relatives, 4,764 non-relatives
  • In group quarters: 2,628

Size of family households: 8,413 2-persons, 5,180 3-persons, 4,358 4-persons, 2,446 5-persons, 1,590 6-persons, 988 7-or-more-persons.

Size of nonfamily households: 7,618 1-person, 2,250 2-persons, 95 3-persons, 123 4-persons, 171 5-persons.

11,228 married couples with children.
3,327 single-parent households (1,603 men, 1,724 women).

58.4% of residents of Vista speak English at home.
34.8% of residents speak Spanish at home (65% speak English very well, 16% speak English well, 11% speak English not well, 8% don't speak English at all).
2.3% of residents speak other Indo-European language at home (82% speak English very well, 16% speak English well, 2% speak English not well).
3.1% of residents speak Asian or Pacific Island language at home (56% speak English very well, 29% speak English well, 14% speak English not well, 1% don't speak English at all).
0.7% of residents speak other language at home (62% speak English very well, 10% speak English well, 11% speak English not well, 17% don't speak English at all).

Foreign born population: 23,655 (24.2%)
(57.3% of them are naturalized citizens)

Median number of rooms in houses and condos:
Here:

5.5
State:

6.0

Median number of rooms in apartments
Here:

3.8
State:

3.9

Owner-occupied Renter-occupied
Bedrooms in owner-occupied houses and condos in Vista, California
  • Bedrooms in owner-occupied houses and condos in Vista, California
  • 0no bedroom
  • 5311 bedroom
  • 2,8312 bedrooms
  • 10,3943 bedrooms
  • 3,8774 bedrooms
  • 6445+ bedrooms
Bedrooms in renter-occupied apartments in Vista, California
  • Bedrooms in renter-occupied apartments in Vista, California
  • 1,177no bedroom
  • 3,5401 bedroom
  • 6,5392 bedrooms
  • 2,6983 bedrooms
  • 8884 bedrooms
  • 1135+ bedrooms
Owner-occupied Renter-occupied
Cars and other vehicles available in Vista in owner-occupied houses/condos
  • Cars and other vehicles available in Vista in owner-occupied houses/condos
  • 293no vehicle
  • 3,7161 vehicle
  • 8,9452 vehicles
  • 3,0573 vehicles
  • 1,2344 vehicles
  • 1,0325+ vehicles
Cars and other vehicles available in Vista in renter-occupied apartments
  • Cars and other vehicles available in Vista in renter-occupied apartments
  • 579no vehicle
  • 5,8971 vehicle
  • 5,7432 vehicles
  • 1,5663 vehicles
  • 6514 vehicles
  • 5195+ vehicles
Owner-occupied Renter-occupied
Rooms in owner-occupied houses in Vista, California
  • Rooms in owner-occupied houses in Vista, California
  • 01 room
  • 862 rooms
  • 1,0463 rooms
  • 2,7524 rooms
  • 5,0935 rooms
  • 3,7686 rooms
  • 2,4937 rooms
  • 1,4238 rooms
  • 1,6169+ rooms
Rooms in renter-occupied apartments in Vista, California
  • Rooms in renter-occupied apartments in Vista, California
  • 1,1771 room
  • 1,9632 rooms
  • 2,9243 rooms
  • 4,7944 rooms
  • 2,8165 rooms
  • 5896 rooms
  • 4717 rooms
  • 1408 rooms
  • 819+ rooms
Year house built
Median 2022 house/condo value by year built
Median house/condo value by year householder moved into unit
Breakdown of mean house values by ages of householders
Owners and renters by unit type in Vista, CA
  • Vista, CA household income distribution

  • Distribution of median household income in Vista, CA in 2022
  • 981Less than $10,000
  • 1,439$10,000 to $19,999
  • 2,991$20,000 to $29,999
  • 1,445$30,000 to $39,999
  • 2,145$40,000 to $49,999
  • 2,275$50,000 to $59,999
  • 2,956$60,000 to $74,999
  • 3,714$75,000 to $99,999
  • 3,667$100,000 to $124,999
  • 3,591$125,000 to $149,999
  • 3,643$150,000 to $199,999
  • 4,385$200,000 or more
  • Home value of owner - occupied houses in 2022 in Vista, CA

  • Distribution of house value in Vista, CA in 2022
  • 138Less than $10,000
  • 22$10,000 to $14,999
  • 29$15,000 to $19,999
  • 23$25,000 to $29,999
  • 13$35,000 to $39,999
  • 37$40,000 to $49,999
  • 185$50,000 to $59,999
  • 108$60,000 to $69,999
  • 93$70,000 to $79,999
  • 129$80,000 to $89,999
  • 24$90,000 to $99,999
  • 116$100,000 to $124,999
  • 50$125,000 to $149,999
  • 181$150,000 to $174,999
  • 122$175,000 to $199,999
  • 212$200,000 to $249,999
  • 84$250,000 to $299,999
  • 526$300,000 to $399,999
  • 990$400,000 to $499,999
  • 5,480$500,000 to $749,999
  • 3,621$750,000 to $999,999
  • 1,203$1,000,000 to $1,499,999
  • 17$1,500,000 to $1,999,999
  • 244$2,000,000 or more
  • Rent paid by renters in 2022 in Vista, CA

  • Distribution of rent paid by renters in Vista, CA in 2022
  • 18Less than $100
  • 33$150 to $199
  • 34$200 to $249
  • 11$250 to $299
  • 24$300 to $349
  • 38$350 to $399
  • 15$400 to $449
  • 16$450 to $499
  • 48$500 to $549
  • 45$550 to $599
  • 140$600 to $649
  • 13$650 to $699
  • 14$700 to $749
  • 107$750 to $799
  • 111$800 to $899
  • 109$900 to $999
  • 802$1,000 to $1,249
  • 1,312$1,250 to $1,499
  • 6,468$1,500 to $1,999
  • 2,878$2,000 to $2,499
  • 1,681$2,500 to $2,999
  • 671$3,000 to $3,499
  • 438$3,500 or more
  • 618No cash rent
Time Leaving Home To Go To Work in 2022

Percentage of workers working in this county: 97.3%
Number of people working at home: 7,400 (14.7% of all workers)

Travel time (in minutes) to work in 2022

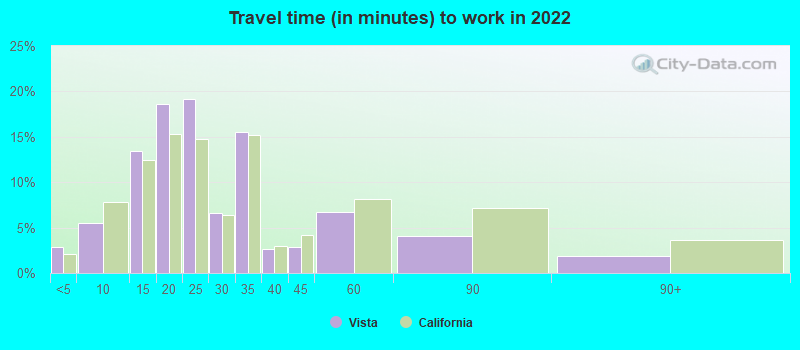
Travel time to work (commute)

  • Less than 5 minutes: 1,284
  • 5 to 9 minutes: 1,342
  • 10 to 14 minutes: 3,923
  • 15 to 19 minutes: 7,250
  • 20 to 24 minutes: 8,239
  • 25 to 29 minutes: 1,846
  • 30 to 34 minutes: 8,498
  • 35 to 39 minutes: 1,016
  • 40 to 44 minutes: 1,685
  • 45 to 59 minutes: 2,645
  • 60 to 89 minutes: 2,207
  • 90 or more minutes: 772
Means of transportation to work in 2022 - Vista

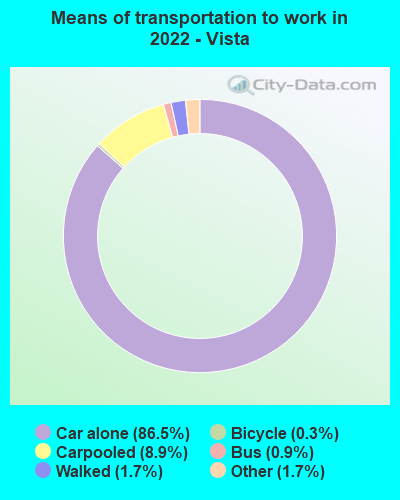
Means of transportation to work:

  • Drove a car alone: 30,786 (70.9%)
  • Carpooled: 3,291 (7.6%)
  • Bus: 289 (0.7%)
  • Light rail, streetcar or trolley: 8 (0.0%)
  • Taxi: 635 (1.5%)
  • Bicycle: 120 (0.3%)
  • Walked: 684 (1.6%)
  • Worked at home: 7,400 (17.1%)
Class of Workers in 2022
  • Unemployment by race in 2022
  • Unemployment rate for White non-Hispanic residents
  • 6.0%Males
  • 6.4%Females
  • Unemployment rate for Black residents
  • 2.0%Males
  • 5.0%Females
  • Unemployment rate for American Indian and Alaska Native residents
  • 2.8%Males
  • 0.7%Females
  • Unemployment rate for Asian residents
  • 1.7%Males
  • 4.8%Females
  • Unemployment rate for other race residents
  • 3.8%Males
  • 4.9%Females
  • Unemployment rate for two or more race residents
  • 8.3%Males
  • 7.8%Females
  • Unemployment rate for Hispanic or Latino residents
  • 7.0%Males
  • 4.4%Females
Year of entry for the foreign-born population in Vista, California
  • Year of entry for the foreign-born population in Vista, California
  • 2,2582010 or later
  • 5,7392000 to 2009
  • 6,4821990 to 1999
  • 7,6901980 to 1989
  • 3,1601970 to 1979
  • 2,738Before 1970
Ancestries in Vista, CA

First ancestries reported:

  • German: 2,614 (4.3%)
  • English: 2,373 (3.9%)
  • Irish: 2,370 (3.9%)
  • Italian: 1,628 (2.7%)
  • Swedish: 1,070 (1.8%)
  • American: 904 (1.5%)
  • Polish: 584 (1.0%)
  • Scottish: 568 (0.9%)
  • French: 497 (0.8%)
  • European: 395 (0.7%)
  • Danish: 340 (0.6%)
  • Norwegian: 285 (0.5%)
  • African: 253 (0.4%)
  • Scandinavian: 188 (0.3%)
  • Russian: 171 (0.3%)
  • Jamaican: 162 (0.3%)
  • British: 161 (0.3%)
  • Lebanese: 156 (0.3%)
  • Dutch: 146 (0.2%)
  • Finnish: 116 (0.2%)
  • Iranian: 113 (0.2%)
  • Greek: 104 (0.2%)
  • Scotch-Irish: 98 (0.2%)
  • Northern European: 96 (0.2%)
  • Czech: 92 (0.2%)
  • Hungarian: 78 (0.1%)
  • Romanian: 75 (0.1%)
  • Portuguese: 74 (0.1%)
  • Brazilian: 73 (0.1%)
  • Ukrainian: 68 (0.1%)
  • Somali: 67 (0.1%)
  • Serbian: 64 (0.1%)
  • Moroccan: 63 (0.1%)
  • French Canadian: 59 (0.10%)
  • Cypriot: 58 (0.10%)
  • Belgian: 57 (0.09%)
  • Egyptian: 56 (0.09%)
  • Swiss: 55 (0.09%)
  • Albanian: 54 (0.09%)
  • South African: 53 (0.09%)
  • Trinidadian and Tobagonian: 52 (0.09%)
  • Basque: 50 (0.08%)
  • Croatian: 49 (0.08%)
  • Welsh: 37 (0.06%)
  • Canadian: 34 (0.06%)
  • Assyrian: 31 (0.05%)
  • Ghanaian: 30 (0.05%)
  • Eastern European: 22 (0.04%)
  • Austrian: 17 (0.03%)
  • Slovak: 17 (0.03%)
  • Nigerian: 17 (0.03%)
  • Pennsylvania German: 16 (0.03%)
  • Haitian: 15 (0.02%)
  • Iraqi: 14 (0.02%)
  • Afghan: 13 (0.02%)
  • Yugoslavian: 12 (0.02%)
  • Jordanian: 5 (0.01%)
  • Syrian: 4 (0.01%)

Most common places of birth for foreign-born residents (%):

Mexico
Vista:

69.0% (15,527)
California:

37.2% (3,881,193)

Philippines
Vista:

4.5% (1,007)
California:

7.8% (818,297)

Japan
Vista:

1.8% (410)
California:

1.0% (103,575)

China, excluding Hong Kong and Taiwan
Vista:

1.8% (396)
California:

6.6% (684,672)

Canada
Vista:

1.6% (359)
California:

1.2% (127,477)

Place of birth for U.S.-born residents:

  • This state: 52,863
  • Other state: 19,248
  • Northeast: 4,377
  • Midwest: 5,840
  • South: 4,678
  • West: 4,353

90.7% of Vista residents lived in the same house 1 years ago.
   Out of people who lived in different houses, 40.9% lived in this county.
   Out of people who lived in different counties, 65.5% lived in California.


Vista:

90.7%
State average:

88.9%

Education attainment for males 25 years and older:

  • No schooling: 1,464
  • Nursery to 4th grade: 504
  • 5th and 6th grade: 1,771
  • 7th and 8th grade: 205
  • 9th grade: 393
  • 10th grade: 485
  • 11th grade: 633
  • 12th grade, no diploma: 1,168
  • High school graduate (or equivalency): 7,691
  • Less than 1 year of college: 2,195
  • Some college more than 1 year, no degree: 6,124
  • Associate degree: 2,958
  • Bachelor's degree: 6,694
  • Master's degree: 1,369
  • Professional school degree: 596
  • Doctorate degree: 656
Educational Attainment for Males

Education attainment for females 25 years and older:

  • No schooling: 1,380
  • Nursery to 4th grade: 485
  • 5th and 6th grade: 1,474
  • 7th and 8th grade: 444
  • 9th grade: 272
  • 10th grade: 244
  • 11th grade: 442
  • 12th grade, no diploma: 1,126
  • High school graduate (or equivalency): 6,663
  • Less than 1 year of college: 1,803
  • Some college more than 1 year, no degree: 4,351
  • Associate degree: 3,270
  • Bachelor's degree: 7,544
  • Master's degree: 2,816
  • Professional school degree: 481
  • Doctorate degree: 567
Educational Attainment for Females
Vista marital status for males
Vista marital status for females

Housing units in structures:

  • One, detached: 17,451
  • One, attached: 3,382
  • Two: 387
  • 3 or 4: 1,696
  • 5 to 9: 3,877
  • 10 to 19: 2,524
  • 20 to 49: 1,208
  • 50 or more: 2,930
  • Mobile homes: 1,201
  • Boats, RVs, vans, etc.: 44

Median worth of mobile homes: $182,881

Housing units lacking complete plumbing facilities in 2022: 0.8%

Housing units lacking complete kitchen facilities in 2022: 2.2%

House/condo owner moved in on average 11 years ago

Renter moved in on average 3 years ago

Year householders moved into residence in Vista
Houses and condos Apartments
Most commonly used house heating fuel in houses and condos in Vista, CA
  • 73.7%Utility gas
  • 19.0%Electricity
  • 3.8%Bottled, tank, or LP gas
  • 1.4%Solar energy
  • 1.1%No fuel used
  • 0.8%Wood
  • 0.1%Other fuel
Most commonly used house heating fuel in apartments in Vista, CA
  • 49.5%Utility gas
  • 44.3%Electricity
  • 2.9%No fuel used
  • 2.8%Bottled, tank, or LP gas
  • 0.3%Solar energy
  • 0.3%Wood

Private vs. public school enrollment:

Students in private schools in grades 1 to 8 (elementary and middle school): 580
Here:

5.7%
California:

10.5%

Students in private schools in grades 9 to 12 (high school): 229
Here:

5.0%
California:

8.5%

Students in private undergraduate colleges: 411
Here:

10.8%
California:

15.9%
School Enrollment by Level of School for Male Students
School Enrollment by Level of School for Female Students
Age and Sex of Sensory-Disabled Noninstitutionalized Residents
Age and Sex of Physically-Disabled Noninstitutionalized Residents
Age and Sex of Mentally-Disabled Noninstitutionalized Residents
Age and Sex of Self-Care Disabled Noninstitutionalized Residents
Age and Sex of Go-Outside-Home Disabled Noninstitutionalized Residents
Age and Sex of Noninstitutionalized Residents with Employment Disability