Wagram, NC (North Carolina) Houses and Residents
| Wagram: | $117,424 |
| North Carolina: | $280,600 |
Mean price in 2022:
Detached houses: $163,015
Here: $163,015 State: $375,326 Mobile homes: $66,508
Here: $66,508 State: $124,933
Total population: 813 (Urban population: 0, Rural population: 790 (all nonfarm))
Houses: 458 (373 occupied: 279 owner occupied, 99 renter occupied)
| % of renters here: | 26% |
| State: | 33% |
Housing density: 312 houses/condos per square mile
Median price asked for vacant for-sale houses and condos in 2022 in this county: $99,502.
Median contract rent in 2022: $508
Median rent asked for vacant for-rent units in 2022: $396
Median gross rent in Wagram, NC in 2022: $827
Housing units in Wagram with a mortgage: 121 (0 second mortgage, 0 home equity loan, 0 both second mortgage and home equity loan)
Houses without a mortgage: 6
Median household income for houses/condos with a mortgage: $97,597
Median household income for apartments without a mortgage: $44,793
Median monthly housing costs: $756
Compare current foreclosures near Wagram, NC:
| Photo | Address | Area | Beds / Baths | Price | Details |
|---|---|---|---|---|---|

|
#1
Marlboro St # B
Wagram, NC 28396
|
- sq. feet
|
- baths - beds |
show details | |

|
#2
Hillcreek Rd
Wagram, NC 28396
|
- sq. feet
|
- baths - beds |
show details | |

|
#3
Carolina St
Maxton, NC 28364
|
- sq. feet
|
1 baths 3 beds |
$69,900
|
show details |

|
#4
Fairway Dr
Laurinburg, NC 28352
|
3,352 sq. feet
|
3 baths 4 beds |
show details | |

|
#5
Alder Rd
Laurinburg, NC 28352
|
1,000 sq. feet
|
1 baths 3 beds |
show details | |

|
#6
School St
Lumber Bridge, NC 28357
|
2,805 sq. feet
|
1 baths 3 beds |
show details | |

|
#7
Cypress Dr
Raeford, NC 28376
|
1,222 sq. feet
|
2 baths 3 beds |
show details | |

|
#8
Church St
Laurel Hill, NC 28351
|
2,084 sq. feet
|
2 baths 3 beds |
show details | |

|
#9
Kenwyn Dr
Laurinburg, NC 28352
|
1,429 sq. feet
|
2 baths 2 beds |
show details | |

|
#10
Bunch Rd
Laurel Hill, NC 28351
|
2,128 sq. feet
|
2 baths 3 beds |
show details |
| Photo | Address | Area | Beds / Baths | Price | Details |
|---|---|---|---|---|---|

|
#11
Turnpike Rd
Laurinburg, NC 28352
|
1,702 sq. feet
|
2 baths 3 beds |
show details | |

|
#12
X Way Rd
Laurinburg, NC 28352
|
2,789 sq. feet
|
3 baths 4 beds |
show details | |

|
#13
Malcolm St
Laurinburg, NC 28352
|
1,008 sq. feet
|
1 baths 2 beds |
show details | |

|
#14
Lombard St
Maxton, NC 28364
|
1,248 sq. feet
|
1 baths 3 beds |
show details | |

|
#15
Summer Ln
Laurinburg, NC 28352
|
1,406 sq. feet
|
2 baths 3 beds |
show details | |

|
#16
Hargraves St
Laurel Hill, NC 28351
|
1,746 sq. feet
|
2 baths 3 beds |
show details | |

|
#17
Shaw Rd
Laurinburg, NC 28352
|
1,420 sq. feet
|
2 baths 3 beds |
show details | |

|
#18
S Pine St
Laurinburg, NC 28352
|
1,932 sq. feet
|
2 baths 4 beds |
show details | |

|
#19
Heflin Rd
Aberdeen, NC 28315
|
1,344 sq. feet
|
2 baths 3 beds |
show details | |

|
#20
Mount Zion Church Rd
Red Springs, NC 28377
|
3,457 sq. feet
|
2 baths 4 beds |
show details |
| Photo | Address | Area | Beds / Baths | Price | Details |
|---|---|---|---|---|---|

|
#21
Shannon Dr
Laurel Hill, NC 28351
|
1,464 sq. feet
|
2 baths 3 beds |
show details | |

|
#22
Douglas Ave
Laurinburg, NC 28352
|
1,012 sq. feet
|
1 baths 3 beds |
show details | |

|
#23
Muse St
Laurinburg, NC 28352
|
1,483 sq. feet
|
1 baths 3 beds |
show details | |

|
#24
E Delaware Ave
Southern Pines, NC 28387
|
1,443 sq. feet
|
2 baths 3 beds |
show details | |

|
#25
N Caledonia Rd
Laurinburg, NC 28352
|
900 sq. feet
|
1 baths 2 beds |
show details | |

|
#26
Bryants Cir
Maxton, NC 28364
|
1,581 sq. feet
|
2 baths 3 beds |
show details | |

|
#27
E South St
Aberdeen, NC 28315
|
1,008 sq. feet
|
1 baths 3 beds |
show details | |

|
#28
Salley Mcnair Rd
Laurinburg, NC 28352
|
2,109 sq. feet
|
2 baths 4 beds |
show details | |

|
#29
Pine St
Shannon, NC 28386
|
1,350 sq. feet
|
2 baths 3 beds |
show details | |

|
#30
Purcell Rd
Laurinburg, NC 28352
|
1,334 sq. feet
|
2 baths 3 beds |
show details |
| Photo | Address | Area | Beds / Baths | Price | Details |
|---|---|---|---|---|---|

|
#31
Old Johns Rd
Laurinburg, NC 28352
|
1,152 sq. feet
|
2 baths 3 beds |
show details | |

|
#32
W New England Ave
Pinebluff, NC 28373
|
1,528 sq. feet
|
2 baths 3 beds |
show details | |

|
#33
Barnes Dr
Laurinburg, NC 28352
|
1,584 sq. feet
|
1 baths 3 beds |
show details | |

|
#34
Nc Highway 130 W
Maxton, NC 28364
|
480 sq. feet
|
1 baths 2 beds |
show details | |

|
#35
Deep Branch Rd
Pembroke, NC 28372
|
1,680 sq. feet
|
2 baths 3 beds |
show details | |

|
#36
W Philadelphia Ave
Pinebluff, NC 28373
|
1,353 sq. feet
|
1 baths 3 beds |
show details | |

|
#37
Nc Highway 71 N
Maxton, NC 28364
|
1,649 sq. feet
|
2 baths 3 beds |
show details | |

|
#38
Queensdale St
Laurinburg, NC 28352
|
1,256 sq. feet
|
1 baths 3 beds |
show details | |

|
#39
Montclair Dr
Laurinburg, NC 28352
|
2,074 sq. feet
|
2 baths 3 beds |
show details | |

|
#40
Old Lowery Rd
Shannon, NC 28386
|
2,260 sq. feet
|
3 baths 4 beds |
show details |
| Photo | Address | Area | Beds / Baths | Price | Details |
|---|---|---|---|---|---|

|
#41
Fairway Dr
Laurinburg, NC 28352
|
2,108 sq. feet
|
3 baths 4 beds |
show details | |

|
#42
N Us 1 Hwy
Hoffman, NC 28347
|
1,620 sq. feet
|
2 baths - beds |
show details | |

|
#43
Baldwin Rd
Lumber Bridge, NC 28357
|
2,052 sq. feet
|
2 baths - beds |
show details | |

|
#44
Canter Dr
Raeford, NC 28376
|
2,330 sq. feet
|
3 baths - beds |
show details | |

|
#45
Pickler Rd
Aberdeen, NC 28315
|
1,025 sq. feet
|
1 baths - beds |
show details | |

|
#46
Celtic Ct
Raeford, NC 28376
|
1,248 sq. feet
|
2 baths - beds |
show details | |

|
#47
Rocky Mountain Dr
Raeford, NC 28376
|
1,845 sq. feet
|
2 baths - beds |
show details | |

|
#48
Army Rd
Raeford, NC 28376
|
2,052 sq. feet
|
2 baths - beds |
show details | |

|
#49
Woodbine Dr
Raeford, NC 28376
|
1,296 sq. feet
|
2 baths - beds |
show details | |

|
Check over 1 million property listings on Foreclosure.com!
|
browse all offers | |||

Latest news about housing in Wagram, NC collected exclusively by city-data.com from local newspapers, TV, and radio stations

 | Does anyone else find rural, southern NC creepy? (80 replies) |
| Wagram, NC (11 replies) |

Median year apartment built: 1962
Household type by relationship:
Households: 966- Male householders: 191 (81 living alone), Female householders: 178 (55 living alone)
130 spouses (128 opposite-sex spouses), 11 unmarried partners, (8 opposite-sex unmarried partners), 304 children (289 natural, 1 adopted, 14 stepchildren), 54 grandchildren, 19 brothers or sisters, 19 parents, 0 foster children, 14 other relatives, 40 non-relatives
- In group quarters: 2
Size of family households: 124 2-persons, 39 3-persons, 33 4-persons, 23 5-persons, 5 6-persons, 4 7-or-more-persons.
Size of nonfamily households: 139 1-person, 5 2-persons, 2 4-persons.
74 married couples with children.
42 single-parent households (15 men, 27 women).
97.0% of residents of Wagram speak English at home.
2.4% of residents speak Spanish at home (100% speak English well).
0.4% of residents speak other language at home (100% speak English very well).
Foreign born population: 22 (2.3%)
(0.0% of them are naturalized citizens)
| Here: | 5.8 |
| State: | 6.4 |
| Here: | 5.0 |
| State: | 4.4 |

- Bedrooms in owner-occupied houses and condos in Wagram, North Carolina
- 0no bedroom
- 01 bedroom
- 272 bedrooms
- 1903 bedrooms
- 534 bedrooms
- 95+ bedrooms

- Bedrooms in renter-occupied apartments in Wagram, North Carolina
- 0no bedroom
- 21 bedroom
- 212 bedrooms
- 663 bedrooms
- 104 bedrooms
- 05+ bedrooms

- Cars and other vehicles available in Wagram in owner-occupied houses/condos
- 27no vehicle
- 441 vehicle
- 1172 vehicles
- 533 vehicles
- 254 vehicles
- 135+ vehicles

- Cars and other vehicles available in Wagram in renter-occupied apartments
- 13no vehicle
- 281 vehicle
- 492 vehicles
- 53 vehicles
- 44 vehicles
- 05+ vehicles

- Rooms in owner-occupied houses in Wagram, North Carolina
- 01 room
- 02 rooms
- 03 rooms
- 134 rooms
- 955 rooms
- 986 rooms
- 137 rooms
- 228 rooms
- 399+ rooms

- Rooms in renter-occupied apartments in Wagram, North Carolina
- 01 room
- 02 rooms
- 73 rooms
- 134 rooms
- 585 rooms
- 186 rooms
- 27 rooms
- 28 rooms
- 09+ rooms


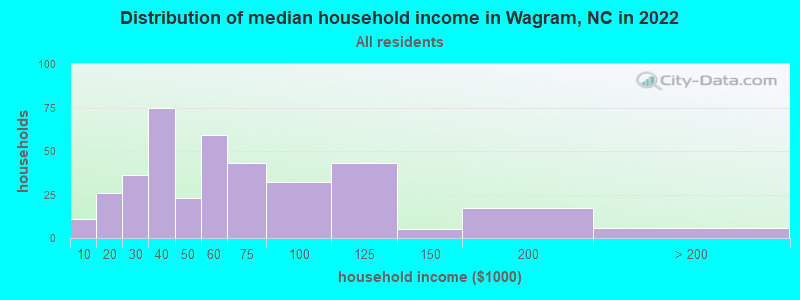
Wagram, NC household income distribution

- 11Less than $10,000
- 26$10,000 to $19,999
- 36$20,000 to $29,999
- 75$30,000 to $39,999
- 23$40,000 to $49,999
- 59$50,000 to $59,999
- 43$60,000 to $74,999
- 32$75,000 to $99,999
- 43$100,000 to $124,999
- 5$125,000 to $149,999
- 17$150,000 to $199,999
- 6$200,000 or more
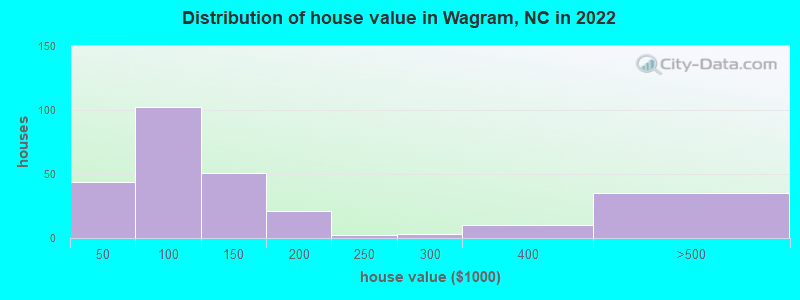
Home value of owner - occupied houses in 2022 in Wagram, NC
-
- 2Less than $10,000
- 5$20,000 to $24,999
- 2$25,000 to $29,999
- 6$30,000 to $34,999
- 5$35,000 to $39,999
- 22$40,000 to $49,999
- 5$50,000 to $59,999
- 27$60,000 to $69,999
- 20$70,000 to $79,999
- 11$80,000 to $89,999
- 16$90,000 to $99,999
- 30$100,000 to $124,999
- 20$125,000 to $149,999
- 18$150,000 to $174,999
- 2$175,000 to $199,999
- 1$200,000 to $249,999
- 3$250,000 to $299,999
- 9$300,000 to $399,999
- 34$400,000 to $499,999
Rent paid by renters in 2022 in Wagram, NC
-
- 19$200 to $249
- 2$350 to $399
- 3$400 to $449
- 6$450 to $499
- 2$500 to $549
- 2$550 to $599
- 10$600 to $649
- 1$700 to $749
- 3$750 to $799
- 3$800 to $899
- 1$900 to $999
- 34No cash rent


Percentage of workers working in this county: 59.3%
Number of people working at home: 22 (4.9% of all workers)
Travel time to work (commute)
- Less than 5 minutes: 11
- 5 to 9 minutes: 5
- 10 to 14 minutes: 41
- 15 to 19 minutes: 65
- 20 to 24 minutes: 67
- 25 to 29 minutes: 85
- 30 to 34 minutes: 56
- 35 to 39 minutes: 18
- 40 to 44 minutes: 4
- 45 to 59 minutes: 35
- 60 to 89 minutes: 5
- 90 or more minutes: 20
Means of transportation to work:
- Drove a car alone: 239 (75.4%)
- Carpooled: 55 (17.4%)
- Bus or trolley bus: 2 (0.6%)
- Walked: 3 (0.9%)
- Other means: 13 (4.1%)
- Worked at home: 5 (1.6%)

- Unemployment by race in 2022
- Unemployment rate for White non-Hispanic residents
- 5.8%Males
- 9.3%Females
- Unemployment rate for Black residents
- 7.2%Males
- 9.8%Females
- Unemployment rate for American Indian and Alaska Native residents
- 11.6%Males
- 13.5%Females
- Unemployment rate for Hispanic or Latino residents
- 47.6%Females

- Year of entry for the foreign-born population in Wagram, North Carolina
- 02010 or later
- 02000 to 2009
- 201990 to 1999
- 01980 to 1989
- 11970 to 1979
- 1Before 1970

First ancestries reported:
- English: 65 (7.9%)
- Danish: 36 (4.4%)
- German: 27 (3.3%)
- European: 26 (3.2%)
- American: 18 (2.2%)
- Scotch-Irish: 11 (1.3%)
- Irish: 5 (0.6%)
- African: 4 (0.5%)
- Scottish: 2 (0.2%)
- Welsh: 2 (0.2%)
- Eastern European: 1 (0.1%)
Most common places of birth for foreign-born residents (%):
| Wagram: | 86.4% (19) |
| North Carolina: | 24.7% (214,776) |
Place of birth for U.S.-born residents:
- This state: 734
- Other state: 193
- Northeast: 77
- Midwest: 15
- South: 83
- West: 16
94.9% of Wagram residents lived in the same house 1 years ago.
Out of people who lived in different houses, 20.9% lived in this county.
Out of people who lived in different counties, 69.2% lived in North Carolina.
| Wagram: | 94.9% |
| State average: | 87.3% |
Education attainment for males 25 years and older:
- No schooling: 3
- Nursery to 4th grade: 0
- 5th and 6th grade: 0
- 7th and 8th grade: 4
- 9th grade: 7
- 10th grade: 11
- 11th grade: 4
- 12th grade, no diploma: 0
- High school graduate (or equivalency): 138
- Less than 1 year of college: 20
- Some college more than 1 year, no degree: 76
- Associate degree: 24
- Bachelor's degree: 41
- Master's degree: 3
- Professional school degree: 0
- Doctorate degree: 20

Education attainment for females 25 years and older:
- No schooling: 0
- Nursery to 4th grade: 2
- 5th and 6th grade: 0
- 7th and 8th grade: 3
- 9th grade: 11
- 10th grade: 5
- 11th grade: 9
- 12th grade, no diploma: 5
- High school graduate (or equivalency): 88
- Less than 1 year of college: 5
- Some college more than 1 year, no degree: 73
- Associate degree: 41
- Bachelor's degree: 38
- Master's degree: 13
- Professional school degree: 0
- Doctorate degree: 0


Housing units in structures:
- One, detached: 413
- Two: 7
- Mobile homes: 37
Median worth of mobile homes: $64,471
Housing units lacking complete kitchen facilities in 2022: 7.2%
House/condo owner moved in on average 23 years ago
Renter moved in on average 5 years ago

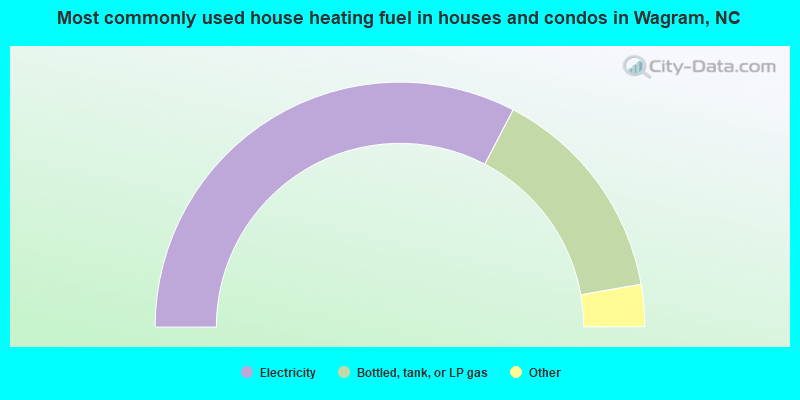
- 65.5%Electricity
- 29.2%Bottled, tank, or LP gas
- 3.4%Utility gas
- 1.9%Wood
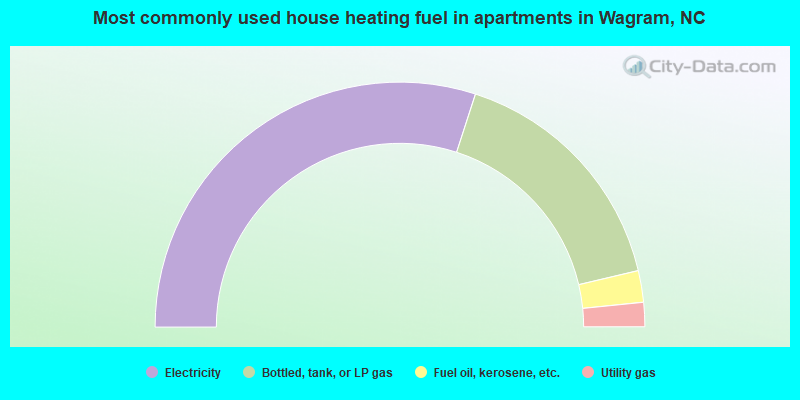
- 60.0%Electricity
- 32.6%Bottled, tank, or LP gas
- 4.2%Fuel oil, kerosene, etc.
- 3.2%Utility gas
Private vs. public school enrollment:
| Here: | 5.2% |
| North Carolina: | 13.8% |
| Here: | 0.0% |
| North Carolina: | 11.9% |
| Here: | 0.0% |
| North Carolina: | 19.3% |


