Wailuku, HI (Hawaii) Houses and Residents
| Wailuku: | $830,096 |
| Hawaii: | $820,100 |
Mean price in 2022:
Detached houses: $1,014,064
Here: $1,014,064 State: $1,035,348 Townhouses or other attached units: $920,592
Here: $920,592 State: $976,474 In 2-unit structures: $601,065
Here: $601,065 State: $928,739 In 3-to-4-unit structures: $529,059
Here: $529,059 State: $758,960 In 5-or-more-unit structures: $487,294
Here: $487,294 State: $584,974
Total population: 15,313 (Urban population: 12,297 (all inside urban clusters), Rural population: 122 (all nonfarm))
Houses: 6,752 (6,028 occupied: 4,275 owner occupied, 1,942 renter occupied)
| % of renters here: | 31% |
| State: | 37% |
Housing density: 1,333 houses/condos per square mile
Median price asked for vacant for-sale houses and condos in 2022: $578,685.
Median contract rent in 2022: $1,256 (lower quartile is $888, upper quartile is $1,923)
Median rent asked for vacant for-rent units in 2022: $1,368
Median gross rent in Wailuku, HI in 2022: $1,460
Housing units in Wailuku with a mortgage: 2,587 (529 second mortgage, 0 home equity loan, 353 both second mortgage and home equity loan)
Houses without a mortgage: 14
Median household income for houses/condos with a mortgage: $109,637
Median household income for apartments without a mortgage: $70,431
Median monthly housing costs: $1,526
Compare current foreclosures near Wailuku, HI:
| Photo | Address | Area | Beds / Baths | Price | Details |
|---|---|---|---|---|---|

|
#1
Kalawi Pl
Wailuku, HI 96793
|
1,042 sq. feet
|
1 baths 3 beds |
show details | |

|
#2
Upalu St
Wailuku, HI 96793
|
960 sq. feet
|
2 baths 3 beds |
show details | |

|
#3
Hilinai St
Wailuku, HI 96793
|
1,082 sq. feet
|
2 baths 3 beds |
show details | |

|
#4
Meakanu Ln Apt 204
Wailuku, HI 96793
|
935 sq. feet
|
2 baths 2 beds |
show details | |

|
#5
Hoomau St
Wailuku, HI 96793
|
1,621 sq. feet
|
3 baths 5 beds |
show details | |

|
#6
Puuloa St
Wailuku, HI 96793
|
1,000 sq. feet
|
1 baths 3 beds |
show details | |

|
#7
Haunani Pl
Wailuku, HI 96793
|
2,632 sq. feet
|
2 baths 3 beds |
show details | |

|
#8
Maunaleo St
Wailuku, HI 96793
|
2,279 sq. feet
|
3 baths 4 beds |
show details | |

|
#9
Ainaola St
Wailuku, HI 96793
|
3,351 sq. feet
|
4 baths 6 beds |
show details | |

|
#10
Akaiki Pl
Wailuku, HI 96793
|
2,526 sq. feet
|
4 baths 6 beds |
show details |
| Photo | Address | Area | Beds / Baths | Price | Details |
|---|---|---|---|---|---|

|
#11
Komo Ohia St
Wailuku, HI 96793
|
1,416 sq. feet
|
2 baths 3 beds |
show details | |

|
#12
Akaiki Pl
Wailuku, HI 96793
|
1,231 sq. feet
|
2 baths 3 beds |
show details | |

|
#13
Wells St Apt 103
Wailuku, HI 96793
|
- sq. feet
|
- baths - beds |
show details | |

|
#14
Wailani St Apt F
Wailuku, HI 96793
|
- sq. feet
|
- baths - beds |
show details | |

|
#15
Piha Poepoe Way, Unit 102
Wailuku, HI 96793
|
- sq. feet
|
- baths - beds |
show details | |

|
#16
Makua St
Wailuku, HI 96793
|
- sq. feet
|
- baths - beds |
show details | |

|
#17
Wili Pa Loop Ste 3b
Wailuku, HI 96793
|
- sq. feet
|
- baths - beds |
show details | |

|
#18
Ohana Hana Pl
Wailuku, HI 96793
|
- sq. feet
|
- baths - beds |
show details | |

|
#19
Kamahao St
Wailuku, HI 96793
|
1,452 sq. feet
|
- baths - beds |
show details | |

|
#20
Ihumai Pl
Wailuku, HI 96793
|
- sq. feet
|
- baths - beds |
show details |
| Photo | Address | Area | Beds / Baths | Price | Details |
|---|---|---|---|---|---|

|
#21
Makua St
Wailuku, HI 96793
|
- sq. feet
|
- baths - beds |
show details | |

|
#22
E Makaukau Loop
Wailuku, HI 96793
|
1,662 sq. feet
|
- baths - beds |
show details | |

|
#23
Kahekili Hwy
Wailuku, HI 96793
|
- sq. feet
|
- baths - beds |
show details | |

|
#24
Kaiwahine St
Kihei, HI 96753
|
1,075 sq. feet
|
2 baths 3 beds |
show details | |

|
#25
Halama St
Kihei, HI 96753
|
1,794 sq. feet
|
2 baths 3 beds |
show details | |

|
#26
S Kihei Rd Apt D204
Kihei, HI 96753
|
719 sq. feet
|
2 baths 2 beds |
show details | |

|
#27
Piimauna St
Makawao, HI 96768
|
1,770 sq. feet
|
2 baths 3 beds |
show details | |

|
#28
Kaualani Dr
Makawao, HI 96768
|
912 sq. feet
|
1 baths 3 beds |
show details | |

|
#29
Mahae St
Makawao, HI 96768
|
864 sq. feet
|
1 baths 3 beds |
show details | |

|
#30
Alea Pl
Makawao, HI 96768
|
2,336 sq. feet
|
2 baths 5 beds |
show details |
| Photo | Address | Area | Beds / Baths | Price | Details |
|---|---|---|---|---|---|

|
#31
Hokulani St
Makawao, HI 96768
|
1,304 sq. feet
|
2 baths 3 beds |
show details | |

|
#32
Ualani Pl
Makawao, HI 96768
|
1,194 sq. feet
|
2 baths 3 beds |
show details | |

|
#33
Haulani St
Makawao, HI 96768
|
1,664 sq. feet
|
2 baths 3 beds |
show details | |

|
#34
Kanakea Loop
Lahaina, HI 96761
|
1,025 sq. feet
|
1 baths 3 beds |
show details | |

|
#35
Kuli Puu St
Kihei, HI 96753
|
2,164 sq. feet
|
4 baths 6 beds |
show details | |

|
#36
Aina Lani Dr
Makawao, HI 96768
|
2,654 sq. feet
|
3 baths 3 beds |
show details | |

|
#37
Keonekai Rd Apt 1-103
Kihei, HI 96753
|
750 sq. feet
|
1 baths 2 beds |
show details | |

|
#38
E Welakahao Rd
Kihei, HI 96753
|
1,933 sq. feet
|
4 baths 6 beds |
show details | |

|
#39
Hunakai St
Kihei, HI 96753
|
1,200 sq. feet
|
2 baths 3 beds |
show details | |

|
#40
Pauoa St
Lahaina, HI 96761
|
1,688 sq. feet
|
2 baths 4 beds |
show details |
| Photo | Address | Area | Beds / Baths | Price | Details |
|---|---|---|---|---|---|

|
#41
Kupuna St
Kihei, HI 96753
|
1,840 sq. feet
|
3 baths 4 beds |
show details | |

|
#42
Waimahaihai St
Kihei, HI 96753
|
1,448 sq. feet
|
1 baths 3 beds |
show details | |

|
#43
Kauhikoa Rd
Haiku, HI 96708
|
1,392 sq. feet
|
2 baths 3 beds |
show details | |

|
#44
Haele Pl
Makawao, HI 96768
|
3,316 sq. feet
|
4 baths 7 beds |
show details | |

|
#45
Loulu Way
Makawao, HI 96768
|
3,263 sq. feet
|
3 baths 5 beds |
show details | |

|
#46
Lower Honoapiilani Rd
Lahaina, HI 96761
|
1,929 sq. feet
|
2 baths 3 beds |
show details | |

|
#47
Paliuli Pl
Kula, HI 96790
|
1,702 sq. feet
|
2 baths 3 beds |
show details | |

|
#48
Makalii St
Kahului, HI 96732
|
2,332 sq. feet
|
2 baths 5 beds |
show details | |

|
#49
Hoalike St
Kihei, HI 96753
|
2,060 sq. feet
|
2 baths 5 beds |
show details | |

|
Check over 1 million property listings on Foreclosure.com!
|
browse all offers | |||

Latest news about housing in Wailuku, HI collected exclusively by city-data.com from local newspapers, TV, and radio stations

 | The truth about MAUI (88 replies) |
| Understanding Maui Real Estate (59 replies) |
| Why is rent so high in Kihei now? (214 replies) |
| Moving to Maui with no car. Possible? (5 replies) |
| Live in Kihei, work in Wailuku (9 replies) |
| New Shipping Cost Info~ Matson (46 replies) |

Median year apartment built: 1981
Household type by relationship:
Households: 16,549- Male householders: 3,101 (867 living alone), Female householders: 2,818 (859 living alone)
3,021 spouses (2,973 opposite-sex spouses), 340 unmarried partners, (244 opposite-sex unmarried partners), 5,097 children (4,743 natural, 86 adopted, 267 stepchildren), 858 grandchildren, 40 brothers or sisters, 342 parents, 18 foster children, 421 other relatives, 344 non-relatives
- In group quarters: 143
Size of family households: 1,524 2-persons, 909 3-persons, 881 4-persons, 453 5-persons, 134 6-persons, 103 7-or-more-persons.
Size of nonfamily households: 1,819 1-person, 316 2-persons, 8 3-persons.
2,494 married couples with children.
921 single-parent households (242 men, 679 women).
79.3% of residents of Wailuku speak English at home.
3.7% of residents speak Spanish at home (71% speak English very well, 17% speak English well, 5% speak English not well, 8% don't speak English at all).
0.6% of residents speak other Indo-European language at home (100% speak English very well).
15.8% of residents speak Asian or Pacific Island language at home (57% speak English very well, 36% speak English well, 7% speak English not well).
0.5% of residents speak other language at home (80% speak English very well, 20% speak English well).
Foreign born population: 1,572 (9.5%)
(63.4% of them are naturalized citizens)
| Here: | 5.3 |
| State: | 5.5 |
| Here: | 3.4 |
| State: | 3.9 |

- Bedrooms in owner-occupied houses and condos in Wailuku, Hawaii
- 56no bedroom
- 1281 bedroom
- 8762 bedrooms
- 2,3623 bedrooms
- 6634 bedrooms
- 1915+ bedrooms

- Bedrooms in renter-occupied apartments in Wailuku, Hawaii
- 308no bedroom
- 5541 bedroom
- 5942 bedrooms
- 4273 bedrooms
- 484 bedrooms
- 125+ bedrooms

- Cars and other vehicles available in Wailuku in owner-occupied houses/condos
- 196no vehicle
- 1,1711 vehicle
- 1,9832 vehicles
- 6683 vehicles
- 1314 vehicles
- 1285+ vehicles

- Cars and other vehicles available in Wailuku in renter-occupied apartments
- 266no vehicle
- 9461 vehicle
- 6252 vehicles
- 883 vehicles
- 184 vehicles
- 05+ vehicles

- Rooms in owner-occupied houses in Wailuku, Hawaii
- 561 room
- 502 rooms
- 3483 rooms
- 8164 rooms
- 1,2945 rooms
- 8096 rooms
- 4557 rooms
- 2658 rooms
- 1829+ rooms

- Rooms in renter-occupied apartments in Wailuku, Hawaii
- 3001 room
- 3032 rooms
- 3333 rooms
- 6144 rooms
- 1895 rooms
- 1466 rooms
- 77 rooms
- 478 rooms
- 49+ rooms


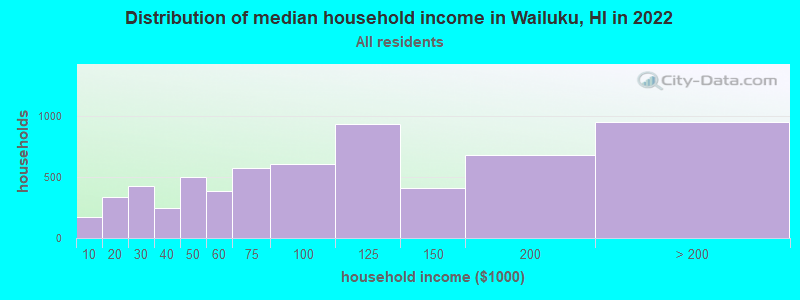
Wailuku, HI household income distribution

- 174Less than $10,000
- 337$10,000 to $19,999
- 424$20,000 to $29,999
- 246$30,000 to $39,999
- 498$40,000 to $49,999
- 381$50,000 to $59,999
- 574$60,000 to $74,999
- 604$75,000 to $99,999
- 928$100,000 to $124,999
- 405$125,000 to $149,999
- 679$150,000 to $199,999
- 948$200,000 or more
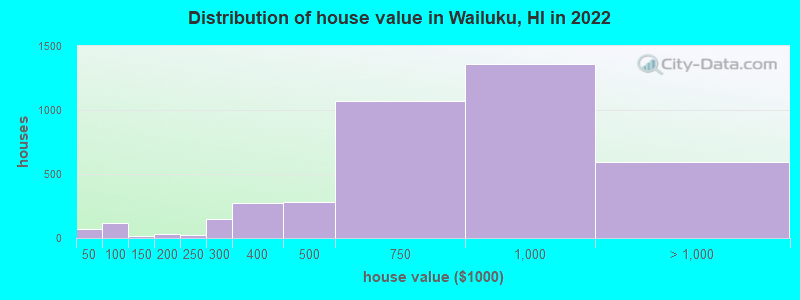
Home value of owner - occupied houses in 2022 in Wailuku, HI
-
- 32Less than $10,000
- 24$10,000 to $14,999
- 1$15,000 to $19,999
- 12$40,000 to $49,999
- 7$50,000 to $59,999
- 79$70,000 to $79,999
- 20$90,000 to $99,999
- 16$100,000 to $124,999
- 1$125,000 to $149,999
- 17$150,000 to $174,999
- 15$175,000 to $199,999
- 23$200,000 to $249,999
- 151$250,000 to $299,999
- 272$300,000 to $399,999
- 282$400,000 to $499,999
- 1,070$500,000 to $749,999
- 1,361$750,000 to $999,999
- 404$1,000,000 to $1,499,999
- 28$1,500,000 to $1,999,999
- 157$2,000,000 or more
Rent paid by renters in 2022 in Wailuku, HI
-
- 44$100 to $149
- 39$150 to $199
- 19$250 to $299
- 80$350 to $399
- 7$400 to $449
- 21$450 to $499
- 4$500 to $549
- 18$650 to $699
- 58$700 to $749
- 52$800 to $899
- 92$900 to $999
- 449$1,000 to $1,249
- 216$1,250 to $1,499
- 291$1,500 to $1,999
- 210$2,000 to $2,499
- 99$2,500 to $2,999
- 66$3,000 to $3,499
- 82No cash rent


Percentage of workers working in this county: 99.5%
Number of people working at home: 700 (8.7% of all workers)
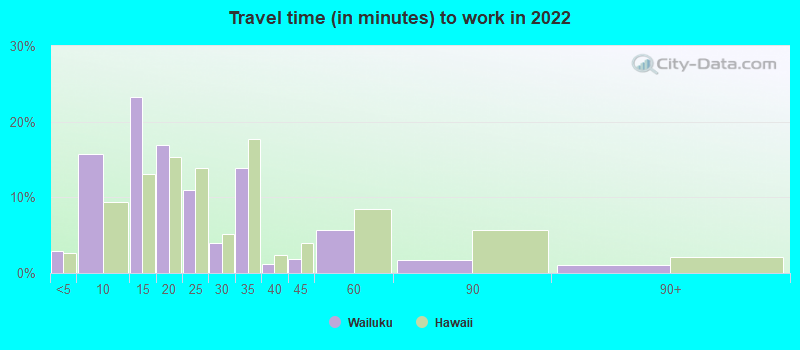
Travel time to work (commute)
- Less than 5 minutes: 269
- 5 to 9 minutes: 1,142
- 10 to 14 minutes: 1,659
- 15 to 19 minutes: 1,567
- 20 to 24 minutes: 637
- 25 to 29 minutes: 139
- 30 to 34 minutes: 836
- 35 to 39 minutes: 108
- 40 to 44 minutes: 119
- 45 to 59 minutes: 358
- 60 to 89 minutes: 305
- 90 or more minutes: 208
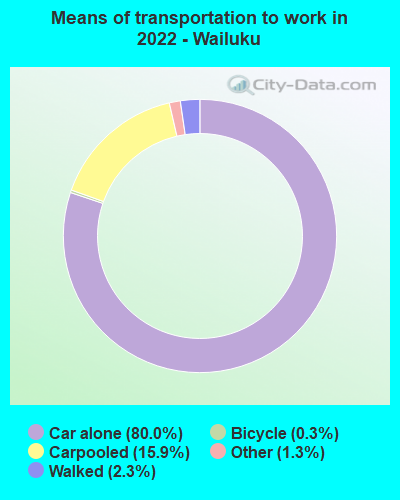
Means of transportation to work:
- Drove a car alone: 8,597 (74.2%)
- Carpooled: 1,789 (15.4%)
- Bus: 1 (0.0%)
- Taxi: 111 (1.0%)
- Bicycle: 50 (0.4%)
- Walked: 308 (2.7%)
- Worked at home: 700 (6.0%)

- Unemployment by race in 2022
- Unemployment rate for White non-Hispanic residents
- 1.7%Males
- 2.1%Females
- Unemployment rate for Asian residents
- 4.1%Males
- 3.8%Females
- Unemployment rate for two or more race residents
- 2.0%Males
- 1.7%Females
- Unemployment rate for Hispanic or Latino residents
- 3.6%Females

- Year of entry for the foreign-born population in Wailuku, Hawaii
- 4022010 or later
- 4762000 to 2009
- 3131990 to 1999
- 4661980 to 1989
- 2721970 to 1979
- 249Before 1970

First ancestries reported:
- English: 170 (2.2%)
- European: 136 (1.8%)
- German: 78 (1.0%)
- Swedish: 78 (1.0%)
- Polish: 76 (1.0%)
- Irish: 73 (1.0%)
- Portuguese: 44 (0.6%)
- Scottish: 44 (0.6%)
- Italian: 43 (0.6%)
- Austrian: 41 (0.5%)
- Czech: 25 (0.3%)
- Scotch-Irish: 25 (0.3%)
- Danish: 22 (0.3%)
- Welsh: 20 (0.3%)
- Northern European: 16 (0.2%)
- Arab: 9 (0.1%)
- Icelander: 8 (0.1%)
- French: 7 (0.09%)
- British: 6 (0.08%)
- Dutch: 6 (0.08%)
Most common places of birth for foreign-born residents (%):
| Wailuku: | 45.8% (916) |
| Hawaii: | 44.3% (115,679) |
| Wailuku: | 9.6% (192) |
| Hawaii: | 5.9% (15,525) |
| Wailuku: | 6.9% (137) |
| Hawaii: | 8.5% (22,321) |
| Wailuku: | 5.9% (118) |
| Hawaii: | 3.6% (9,389) |
| Wailuku: | 5.5% (110) |
| Hawaii: | 1.8% (4,752) |
| Wailuku: | 3.1% (62) |
| Hawaii: | 1.3% (3,276) |
| Wailuku: | 3.0% (59) |
| Hawaii: | 1.8% (4,635) |
| Wailuku: | 2.8% (56) |
| Hawaii: | 2.4% (6,146) |
| Wailuku: | 2.6% (52) |
| Hawaii: | 7.6% (19,835) |
| Wailuku: | 2.4% (47) |
| Hawaii: | 3.7% (9,622) |
| Wailuku: | 1.8% (36) |
| Hawaii: | 4.0% (10,430) |
Place of birth for U.S.-born residents:
- This state: 10,715
- Other state: 3,994
- Northeast: 982
- Midwest: 591
- South: 608
- West: 1,797
91.7% of Wailuku residents lived in the same house 1 years ago.
Out of people who lived in different houses, 41.4% lived in this county.
Out of people who lived in different counties, 38.6% lived in Hawaii.
| Wailuku: | 91.7% |
| State average: | 87.8% |
Education attainment for males 25 years and older:
- No schooling: 54
- Nursery to 4th grade: 0
- 5th and 6th grade: 25
- 7th and 8th grade: 72
- 9th grade: 63
- 10th grade: 44
- 11th grade: 50
- 12th grade, no diploma: 70
- High school graduate (or equivalency): 1,713
- Less than 1 year of college: 359
- Some college more than 1 year, no degree: 991
- Associate degree: 565
- Bachelor's degree: 1,442
- Master's degree: 296
- Professional school degree: 112
- Doctorate degree: 31

Education attainment for females 25 years and older:
- No schooling: 49
- Nursery to 4th grade: 11
- 5th and 6th grade: 24
- 7th and 8th grade: 54
- 9th grade: 43
- 10th grade: 34
- 11th grade: 87
- 12th grade, no diploma: 42
- High school graduate (or equivalency): 1,456
- Less than 1 year of college: 357
- Some college more than 1 year, no degree: 835
- Associate degree: 539
- Bachelor's degree: 1,334
- Master's degree: 389
- Professional school degree: 94
- Doctorate degree: 75


Housing units in structures:
- One, detached: 3,924
- One, attached: 740
- Two: 95
- 3 or 4: 295
- 5 to 9: 589
- 10 to 19: 413
- 20 to 49: 324
- 50 or more: 316
- Mobile homes: 52
Housing units lacking complete kitchen facilities in 2022: 1.8%
House/condo owner moved in on average 13 years ago
Renter moved in on average 3 years ago

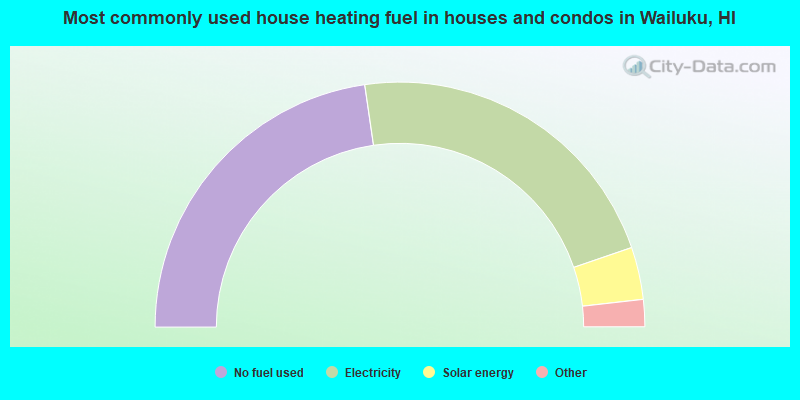
- 45.4%No fuel used
- 44.1%Electricity
- 6.9%Solar energy
- 2.2%Utility gas
- 1.4%Bottled, tank, or LP gas
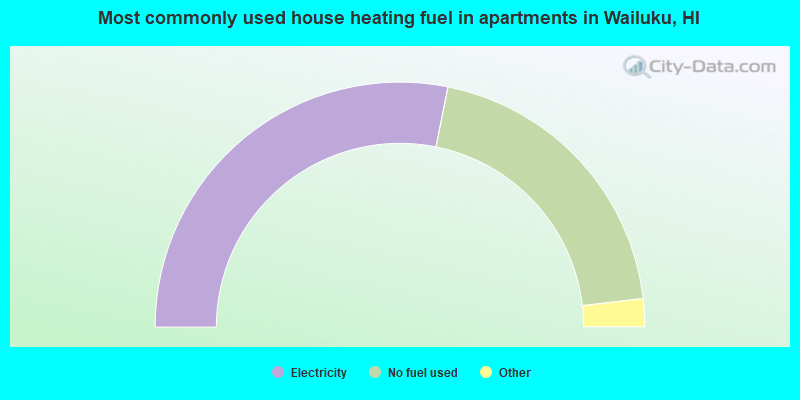
- 56.3%Electricity
- 40.0%No fuel used
- 2.7%Bottled, tank, or LP gas
- 0.7%Solar energy
- 0.3%Other fuel
Private vs. public school enrollment:
| Here: | 33.4% |
| Hawaii: | 21.6% |
| Here: | 13.1% |
| Hawaii: | 21.5% |
| Here: | 26.0% |
| Hawaii: | 23.3% |


