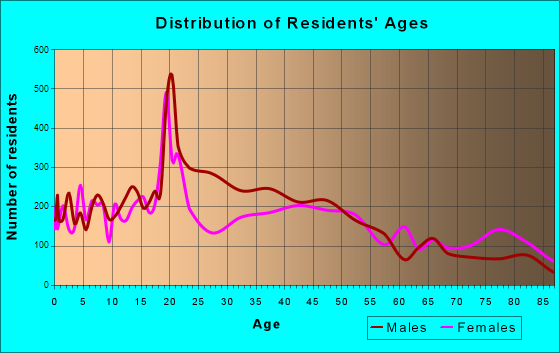
Walla Walla, WA (Washington) Houses and Residents
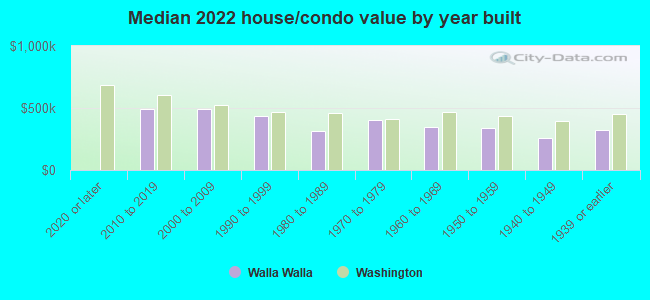
| Walla Walla: | $378,343 |
| Washington: | $569,500 |
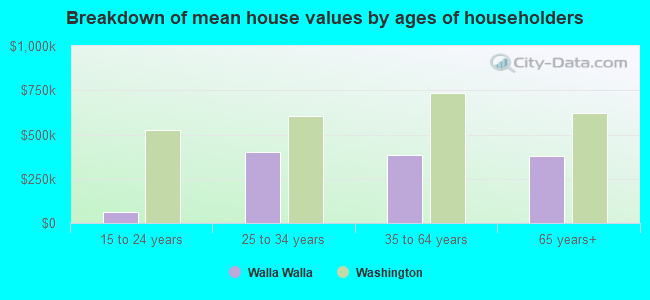
Mean price in 2022:
Detached houses: $383,285
Here: $383,285 State: $734,307 Townhouses or other attached units: $485,914
Here: $485,914 State: $657,697 In 5-or-more-unit structures: $299,980
Here: $299,980 State: $503,183 Mobile homes: $60,509
Here: $60,509 State: $218,362
Total population: 31,910 (Urban population: 29,792 (all inside urban clusters), Rural population: 0)
Houses: 14,437 (13,253 occupied: 8,036 owner occupied, 5,263 renter occupied)
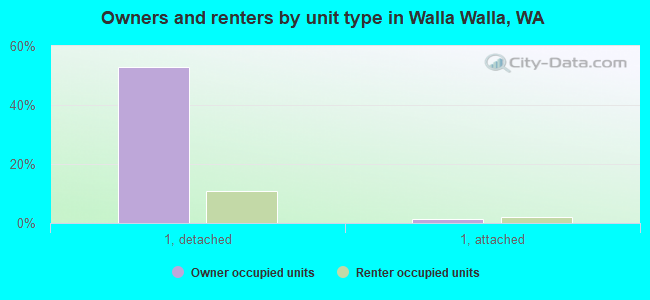
| % of renters here: | 40% |
| State: | 36% |
Housing density: 1,335 houses/condos per square mile
Median price asked for vacant for-sale houses and condos in 2022: $215,192.
Median contract rent in 2022: $988 (lower quartile is $722, upper quartile is $1,264)
Median rent asked for vacant for-rent units in 2022: $2,010
Median gross rent in Walla Walla, WA in 2022: $1,135
Housing units in Walla Walla with a mortgage: 4,242 (291 second mortgage, 4 home equity loan, 171 both second mortgage and home equity loan)
Houses without a mortgage: 56
Median household income for houses/condos with a mortgage: $88,255
Median household income for apartments without a mortgage: $63,809
Median monthly housing costs: $1,077
Compare current foreclosures in Walla Walla, WA:
| Photo | Address | Area | Beds / Baths | Price | Details |
|---|---|---|---|---|---|

|
#1
Lowell Dr
Walla Walla, WA 99362
|
1,345 sq. feet
|
2 baths 3 beds |
show details | |

|
#2
Avalon St
Walla Walla, WA 99362
|
1,019 sq. feet
|
2 baths 4 beds |
show details | |

|
#3
Leonard Dr
Walla Walla, WA 99362
|
1,150 sq. feet
|
2 baths 3 beds |
show details | |

|
#4
Jackson St
Walla Walla, WA 99362
|
884 sq. feet
|
1 baths 2 beds |
show details | |

|
#5
Highland Rd
Walla Walla, WA 99362
|
1,848 sq. feet
|
2 baths 3 beds |
show details | |

|
#6
Edith Ave
Walla Walla, WA 99362
|
1,568 sq. feet
|
2 baths 3 beds |
show details | |

|
#7
Hobson St
Walla Walla, WA 99362
|
2,326 sq. feet
|
3 baths 3 beds |
show details | |

|
#8
Boyer Dr
Walla Walla, WA 99362
|
1,081 sq. feet
|
1 baths 4 beds |
show details | |

|
#9
Elk Fork Dr
Walla Walla, WA 99362
|
2,243 sq. feet
|
2 baths 4 beds |
show details | |

|
#10
Hobson St
Walla Walla, WA 99362
|
1,367 sq. feet
|
1 baths 2 beds |
show details |
| Photo | Address | Area | Beds / Baths | Price | Details |
|---|---|---|---|---|---|

|
#11
Garden Dr
Walla Walla, WA 99362
|
2,028 sq. feet
|
3 baths 3 beds |
show details | |

|
#12
E Alder St
Walla Walla, WA 99362
|
2,064 sq. feet
|
2 baths 2 beds |
show details | |

|
#13
Van Donge Ln
Walla Walla, WA 99362
|
3,650 sq. feet
|
3 baths 5 beds |
show details | |

|
#14
Lincoln St
Walla Walla, WA 99362
|
722 sq. feet
|
1 baths 1 beds |
show details | |

|
#15
Catherine St
Walla Walla, WA 99362
|
3,242 sq. feet
|
3 baths 6 beds |
show details | |

|
#16
Sunset Dr
Walla Walla, WA 99362
|
2,271 sq. feet
|
3 baths 3 beds |
show details | |

|
#17
Aspen St
Walla Walla, WA 99362
|
1,212 sq. feet
|
2 baths 3 beds |
show details | |

|
#18
Martha St
Walla Walla, WA 99362
|
1,516 sq. feet
|
1 baths 3 beds |
show details | |

|
#19
Avalon St
Walla Walla, WA 99362
|
1,979 sq. feet
|
2 baths 4 beds |
show details | |

|
#20
Garrison St
Walla Walla, WA 99362
|
1,260 sq. feet
|
2 baths 3 beds |
show details |
| Photo | Address | Area | Beds / Baths | Price | Details |
|---|---|---|---|---|---|

|
#21
Bush St
Walla Walla, WA 99362
|
2,001 sq. feet
|
2 baths 5 beds |
show details | |

|
#22
Frankland St
Walla Walla, WA 99362
|
792 sq. feet
|
1 baths 2 beds |
show details | |

|
#23
Defence St
Walla Walla, WA 99362
|
806 sq. feet
|
1 baths - beds |
show details | |

|
#24
Portland Ave
Walla Walla, WA 99362
|
1,454 sq. feet
|
2 baths - beds |
show details | |

|
#25
Melrose St
Walla Walla, WA 99362
|
1,460 sq. feet
|
2 baths - beds |
show details | |

|
#26
Isaacs Ave, Trlr 25
Walla Walla, WA 99362
|
450 sq. feet
|
1 baths - beds |
show details | |

|
#27
Wellington Ave
Walla Walla, WA 99362
|
1,211 sq. feet
|
2 baths - beds |
show details | |

|
#28
Mill Creek Rd
Walla Walla, WA 99362
|
1,831 sq. feet
|
1 baths - beds |
show details | |

|
#29
Melrose St Apt A
Walla Walla, WA 99362
|
- sq. feet
|
- baths - beds |
show details | |

|
#30
Gloria Ln
Walla Walla, WA 99362
|
- sq. feet
|
- baths - beds |
show details |
| Photo | Address | Area | Beds / Baths | Price | Details |
|---|---|---|---|---|---|

|
#31
Plaza Way
Walla Walla, WA 99362
|
- sq. feet
|
- baths - beds |
show details | |

|
#32
W Sumach St
Walla Walla, WA 99362
|
- sq. feet
|
- baths - beds |
show details | |

|
#33
S Wilbur Ave Apt 87
Walla Walla, WA 99362
|
- sq. feet
|
- baths - beds |
show details | |

|
#34
Truman St
Walla Walla, WA 99362
|
- sq. feet
|
- baths - beds |
show details | |

|
#35
Fairway Dr Apt 224
Walla Walla, WA 99362
|
- sq. feet
|
- baths - beds |
show details | |

|
#36
Plaza Way
Walla Walla, WA 99362
|
- sq. feet
|
- baths - beds |
show details | |

|
#37
E Isaacs Ave Apt E101
Walla Walla, WA 99362
|
- sq. feet
|
- baths - beds |
show details | |

|
#38
Herbert Pl
Walla Walla, WA 99362
|
- sq. feet
|
- baths - beds |
show details | |

|
#39
Merriam St Apt 8107
Walla Walla, WA 99362
|
- sq. feet
|
- baths - beds |
show details | |

|
#40
Portland Ave
Walla Walla, WA 99362
|
- sq. feet
|
- baths - beds |
show details |
| Photo | Address | Area | Beds / Baths | Price | Details |
|---|---|---|---|---|---|

|
#41
Figueroa St
Walla Walla, WA 99362
|
- sq. feet
|
- baths - beds |
show details | |

|
#42
E Isaacs Ave Apt E301
Walla Walla, WA 99362
|
- sq. feet
|
- baths - beds |
show details | |

|
#43
Boyer Ave
Walla Walla, WA 99362
|
- sq. feet
|
- baths - beds |
show details | |

|
#44
Ankeny St
Walla Walla, WA 99362
|
- sq. feet
|
- baths - beds |
show details | |

|
#45
University St
Walla Walla, WA 99362
|
- sq. feet
|
- baths - beds |
show details | |

|
#46
W Chestnut St
Walla Walla, WA 99362
|
- sq. feet
|
- baths - beds |
show details | |

|
#47
S Wilbur Ave Apt 15
Walla Walla, WA 99362
|
- sq. feet
|
- baths - beds |
show details | |

|
#48
S Wilbur Ave
Walla Walla, WA 99362
|
- sq. feet
|
- baths - beds |
show details | |

|
#49
S Gose St
Walla Walla, WA 99362
|
- sq. feet
|
- baths - beds |
show details | |

|
Check over 1 million property listings on Foreclosure.com!
|
browse all offers | |||


 | Maritime vs. real estate: Seattle’s decades-long rezoning fight (17 replies) |
| Working in Wallula: live in Tri-Cities or Walla Walla? (4 replies) |
| thoughts on walla walla? (47 replies) |
| Houses in decent areas in Spokane for 100K? (20 replies) |
| Microsoft to allow permanent work from home for up to half the time (19 replies) |
| Double WFH + baby moving to Washington (49 replies) |
Median year apartment built: 1972
Household type by relationship:
Households: 34,269- Male householders: 5,582 (1,649 living alone), Female householders: 7,444 (3,212 living alone)
5,137 spouses (5,084 opposite-sex spouses), 894 unmarried partners, (845 opposite-sex unmarried partners), 8,672 children (8,219 natural, 213 adopted, 238 stepchildren), 662 grandchildren, 168 brothers or sisters, 324 parents, 9 foster children, 369 other relatives, 1,459 non-relatives
- In group quarters: 3,546
Size of family households: 3,122 2-persons, 1,660 3-persons, 1,204 4-persons, 912 5-persons, 277 6-persons, 73 7-or-more-persons.
Size of nonfamily households: 5,131 1-person, 763 2-persons, 172 3-persons, 24 4-persons, 13 5-persons.
3,505 married couples with children.
2,328 single-parent households (722 men, 1,606 women).
78.8% of residents of Walla Walla speak English at home.
16.6% of residents speak Spanish at home (61% speak English very well, 17% speak English well, 18% speak English not well, 3% don't speak English at all).
2.6% of residents speak other Indo-European language at home (75% speak English very well, 15% speak English well, 10% speak English not well).
1.4% of residents speak Asian or Pacific Island language at home (63% speak English very well, 32% speak English well, 4% speak English not well, 1% don't speak English at all).
0.5% of residents speak other language at home (98% speak English very well, 2% speak English well).
Foreign born population: 3,644 (10.6%)
(63.3% of them are naturalized citizens)
| Here: | 6.6 |
| State: | 6.5 |
| Here: | 3.7 |
| State: | 3.9 |
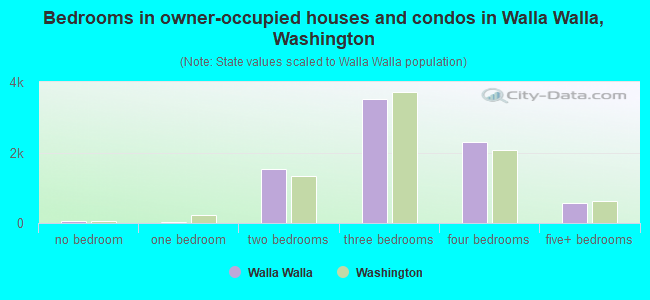
- Bedrooms in owner-occupied houses and condos in Walla Walla, Washington
- 60no bedroom
- 421 bedroom
- 1,5412 bedrooms
- 3,5303 bedrooms
- 2,2904 bedrooms
- 5735+ bedrooms
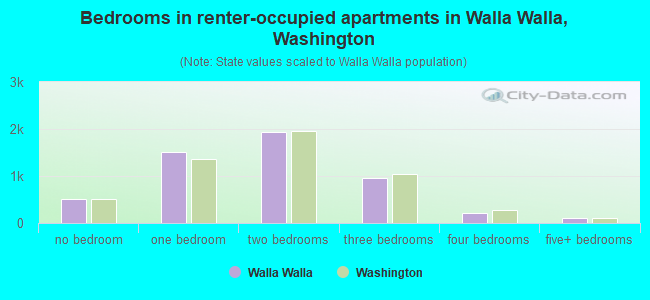
- Bedrooms in renter-occupied apartments in Walla Walla, Washington
- 512no bedroom
- 1,5111 bedroom
- 1,9392 bedrooms
- 9663 bedrooms
- 2194 bedrooms
- 1165+ bedrooms
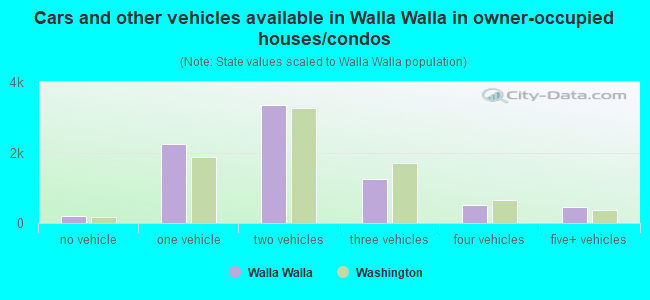
- Cars and other vehicles available in Walla Walla in owner-occupied houses/condos
- 212no vehicle
- 2,2491 vehicle
- 3,3572 vehicles
- 1,2483 vehicles
- 5194 vehicles
- 4535+ vehicles
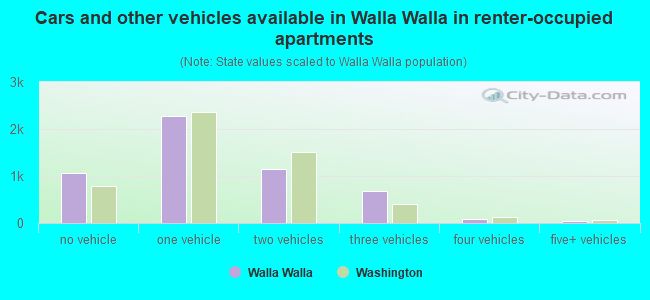
- Cars and other vehicles available in Walla Walla in renter-occupied apartments
- 1,065no vehicle
- 2,2661 vehicle
- 1,1392 vehicles
- 6733 vehicles
- 864 vehicles
- 345+ vehicles
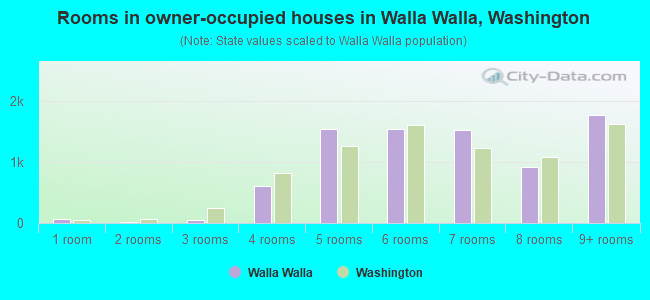
- Rooms in owner-occupied houses in Walla Walla, Washington
- 601 room
- 92 rooms
- 563 rooms
- 6044 rooms
- 1,5395 rooms
- 1,5426 rooms
- 1,5347 rooms
- 9158 rooms
- 1,7779+ rooms
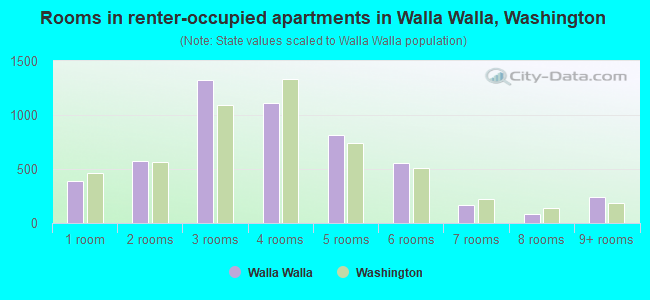
- Rooms in renter-occupied apartments in Walla Walla, Washington
- 3901 room
- 5722 rooms
- 1,3263 rooms
- 1,1144 rooms
- 8135 rooms
- 5566 rooms
- 1657 rooms
- 828 rooms
- 2459+ rooms
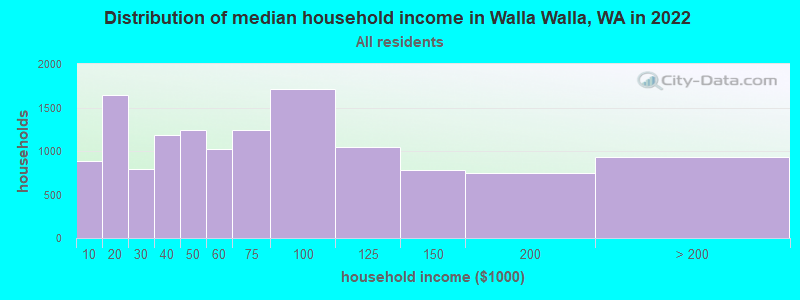
Walla Walla, WA household income distribution

- 888Less than $10,000
- 1,641$10,000 to $19,999
- 790$20,000 to $29,999
- 1,181$30,000 to $39,999
- 1,242$40,000 to $49,999
- 1,025$50,000 to $59,999
- 1,241$60,000 to $74,999
- 1,714$75,000 to $99,999
- 1,043$100,000 to $124,999
- 781$125,000 to $149,999
- 752$150,000 to $199,999
- 936$200,000 or more
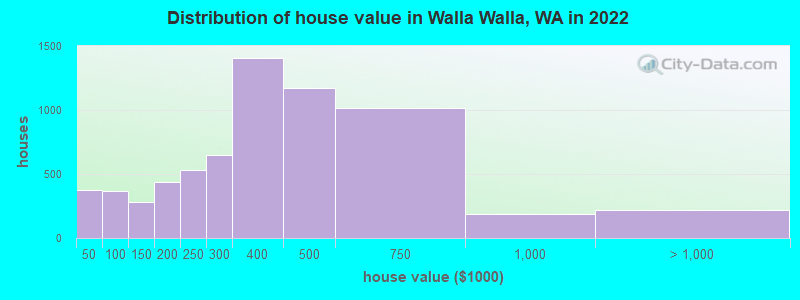
Home value of owner - occupied houses in 2022 in Walla Walla, WA
-
- 191Less than $10,000
- 73$15,000 to $19,999
- 16$20,000 to $24,999
- 8$25,000 to $29,999
- 15$30,000 to $34,999
- 69$40,000 to $49,999
- 52$50,000 to $59,999
- 46$60,000 to $69,999
- 101$70,000 to $79,999
- 60$80,000 to $89,999
- 35$90,000 to $99,999
- 150$100,000 to $124,999
- 127$125,000 to $149,999
- 176$150,000 to $174,999
- 264$175,000 to $199,999
- 527$200,000 to $249,999
- 648$250,000 to $299,999
- 1,406$300,000 to $399,999
- 1,169$400,000 to $499,999
- 1,016$500,000 to $749,999
- 185$750,000 to $999,999
- 143$1,000,000 to $1,499,999
- 19$1,500,000 to $1,999,999
- 54$2,000,000 or more
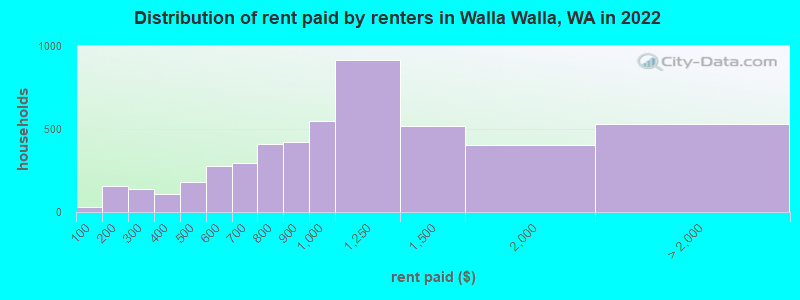
Rent paid by renters in 2022 in Walla Walla, WA
-
- 29Less than $100
- 158$150 to $199
- 75$200 to $249
- 65$250 to $299
- 91$300 to $349
- 19$350 to $399
- 108$400 to $449
- 73$450 to $499
- 230$500 to $549
- 47$550 to $599
- 225$600 to $649
- 70$650 to $699
- 163$700 to $749
- 243$750 to $799
- 421$800 to $899
- 545$900 to $999
- 915$1,000 to $1,249
- 516$1,250 to $1,499
- 402$1,500 to $1,999
- 268$2,000 to $2,499
- 106$2,500 to $2,999
- 20$3,000 to $3,499
- 5$3,500 or more
- 128No cash rent
Percentage of workers working in this county: 96.8%
Number of people working at home: 2,479 (16.2% of all workers)
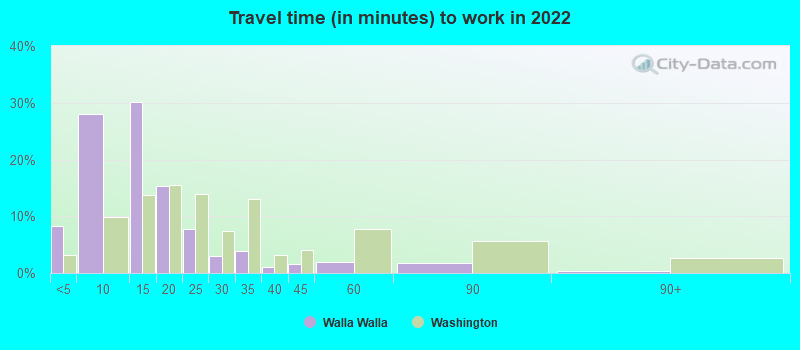
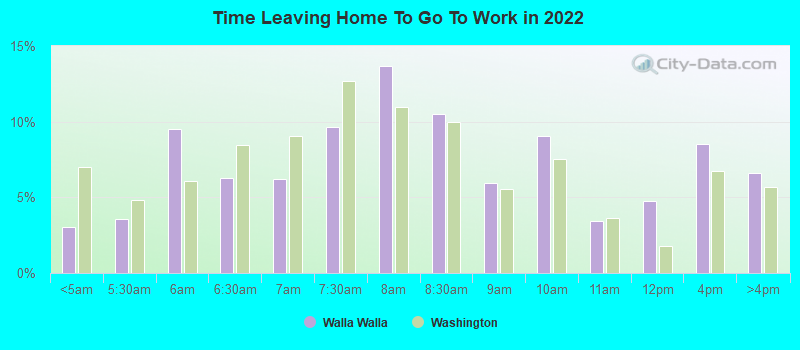
Travel time to work (commute)
- Less than 5 minutes: 1,460
- 5 to 9 minutes: 4,312
- 10 to 14 minutes: 4,206
- 15 to 19 minutes: 1,473
- 20 to 24 minutes: 468
- 25 to 29 minutes: 105
- 30 to 34 minutes: 342
- 35 to 39 minutes: 179
- 40 to 44 minutes: 69
- 45 to 59 minutes: 114
- 60 to 89 minutes: 297
- 90 or more minutes: 97
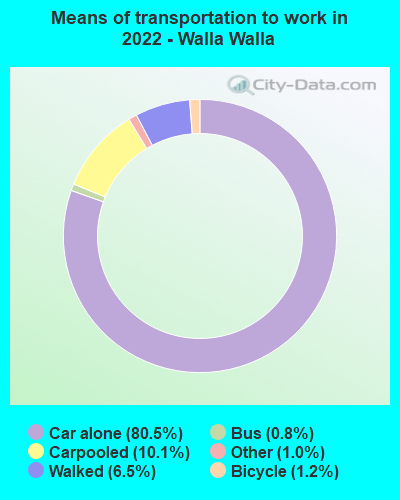
Means of transportation to work:
- Drove a car alone: 15,005 (69.9%)
- Carpooled: 1,940 (9.0%)
- Bus: 95 (0.4%)
- Light rail, streetcar or trolley: 2 (0.0%)
- Taxi: 172 (0.8%)
- Bicycle: 202 (0.9%)
- Walked: 1,236 (5.8%)
- Worked at home: 2,479 (11.6%)
- Unemployment by race in 2022
- Unemployment rate for White non-Hispanic residents
- 3.5%Males
- 4.1%Females
- Unemployment rate for American Indian and Alaska Native residents
- 74.6%Females
- Unemployment rate for Asian residents
- 11.5%Males
- 6.9%Females
- Unemployment rate for other race residents
- 7.1%Males
- Unemployment rate for two or more race residents
- 3.9%Males
- 7.8%Females
- Unemployment rate for Hispanic or Latino residents
- 10.2%Males
- 9.5%Females
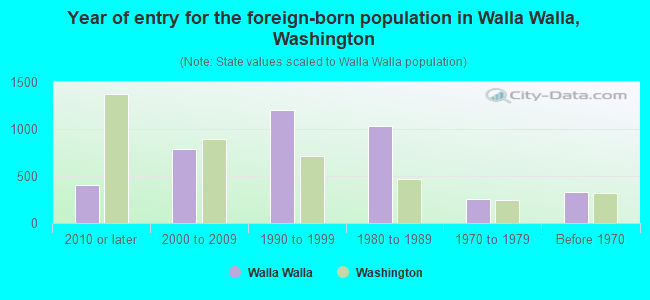
- Year of entry for the foreign-born population in Walla Walla, Washington
- 4042010 or later
- 7872000 to 2009
- 1,2041990 to 1999
- 1,0321980 to 1989
- 2541970 to 1979
- 332Before 1970
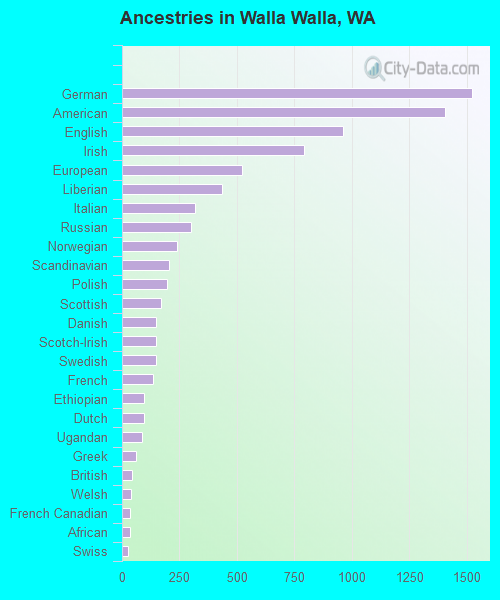
First ancestries reported:
- German: 1,520 (9.5%)
- American: 1,406 (8.7%)
- English: 961 (6.0%)
- Irish: 793 (4.9%)
- European: 524 (3.3%)
- Liberian: 437 (2.7%)
- Italian: 319 (2.0%)
- Russian: 300 (1.9%)
- Norwegian: 240 (1.5%)
- Scandinavian: 204 (1.3%)
- Polish: 197 (1.2%)
- Scottish: 168 (1.0%)
- Danish: 149 (0.9%)
- Scotch-Irish: 147 (0.9%)
- Swedish: 147 (0.9%)
- French: 134 (0.8%)
- Ethiopian: 95 (0.6%)
- Dutch: 94 (0.6%)
- Ugandan: 86 (0.5%)
- Greek: 61 (0.4%)
- British: 43 (0.3%)
- Welsh: 40 (0.2%)
- French Canadian: 34 (0.2%)
- African: 33 (0.2%)
- Swiss: 27 (0.2%)
- Eastern European: 25 (0.2%)
- Yugoslavian: 24 (0.1%)
- Canadian: 22 (0.1%)
- Finnish: 21 (0.1%)
- Northern European: 14 (0.09%)
- Ukrainian: 14 (0.09%)
- Czech: 14 (0.09%)
- Estonian: 12 (0.07%)
- Czechoslovakian: 12 (0.07%)
- Portuguese: 11 (0.07%)
- Turkish: 11 (0.07%)
- Lithuanian: 10 (0.06%)
- New Zealander: 9 (0.06%)
- Kenyan: 2 (0.01%)
Most common places of birth for foreign-born residents (%):
| Walla Walla: | 43.3% (1,579) |
| Washington: | 21.1% (241,655) |
| Walla Walla: | 10.5% (381) |
| Washington: | 0.1% (1,150) |
| Walla Walla: | 6.3% (229) |
| Washington: | 0.3% (3,673) |
| Walla Walla: | 5.3% (194) |
| Washington: | 7.4% (84,470) |
| Walla Walla: | 5.3% (194) |
| Washington: | 1.2% (13,745) |
| Walla Walla: | 2.7% (98) |
| Washington: | 1.6% (17,938) |
| Walla Walla: | 2.5% (92) |
| Washington: | 4.3% (48,886) |
| Walla Walla: | 2.3% (83) |
| Washington: | 8.9% (101,353) |
| Walla Walla: | 2.3% (83) |
| Washington: | 4.1% (47,238) |
| Walla Walla: | 2.2% (79) |
| Washington: | 0.4% (4,914) |
| Walla Walla: | 1.9% (68) |
| Washington: | 1.6% (17,761) |
Place of birth for U.S.-born residents:
- This state: 16,394
- Other state: 12,938
- Northeast: 869
- Midwest: 2,171
- South: 1,842
- West: 8,054
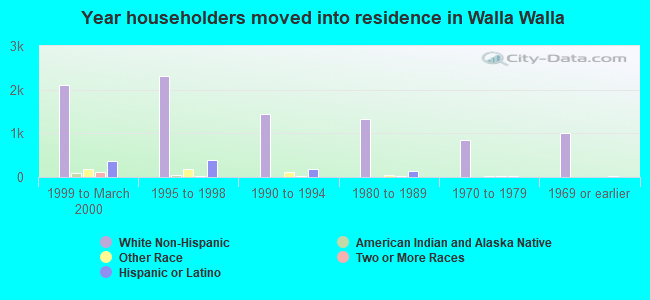
82.1% of Walla Walla residents lived in the same house 1 years ago.
Out of people who lived in different houses, 29.9% lived in this county.
Out of people who lived in different counties, 64.1% lived in Washington.
| Walla Walla: | 82.1% |
| State average: | 85.2% |
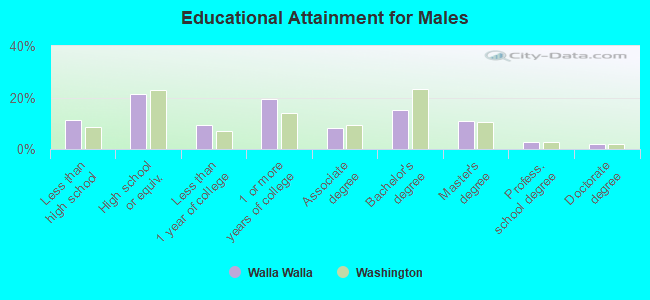
Education attainment for males 25 years and older:
- No schooling: 127
- Nursery to 4th grade: 79
- 5th and 6th grade: 69
- 7th and 8th grade: 119
- 9th grade: 98
- 10th grade: 341
- 11th grade: 248
- 12th grade, no diploma: 269
- High school graduate (or equivalency): 2,537
- Less than 1 year of college: 1,095
- Some college more than 1 year, no degree: 2,284
- Associate degree: 957
- Bachelor's degree: 1,778
- Master's degree: 1,267
- Professional school degree: 318
- Doctorate degree: 231
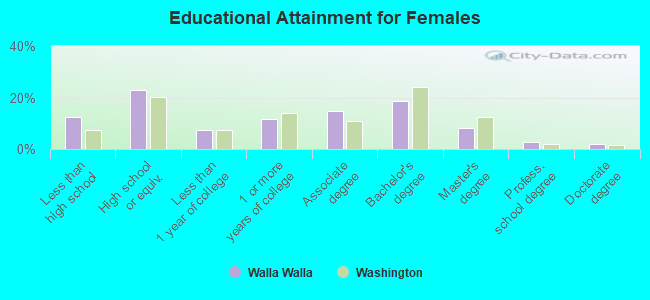
Education attainment for females 25 years and older:
- No schooling: 319
- Nursery to 4th grade: 149
- 5th and 6th grade: 24
- 7th and 8th grade: 193
- 9th grade: 57
- 10th grade: 62
- 11th grade: 118
- 12th grade, no diploma: 412
- High school graduate (or equivalency): 2,487
- Less than 1 year of college: 813
- Some college more than 1 year, no degree: 1,251
- Associate degree: 1,602
- Bachelor's degree: 2,015
- Master's degree: 898
- Professional school degree: 284
- Doctorate degree: 191
Housing units in structures:
- One, detached: 9,663
- One, attached: 657
- Two: 473
- 3 or 4: 609
- 5 to 9: 948
- 10 to 19: 233
- 20 to 49: 650
- 50 or more: 747
- Mobile homes: 392
- Boats, RVs, vans, etc.: 59
Median worth of mobile homes: $73,614
Housing units lacking complete kitchen facilities in 2022: 4.2%
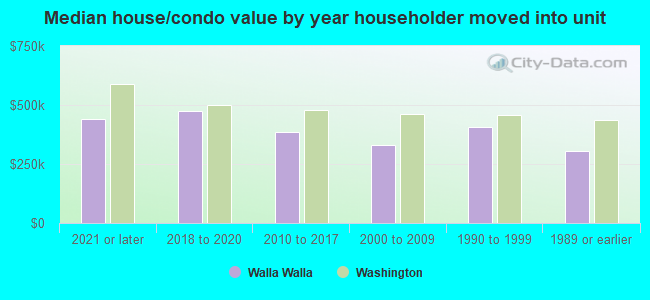
House/condo owner moved in on average 12 years ago
Renter moved in on average 4 years ago
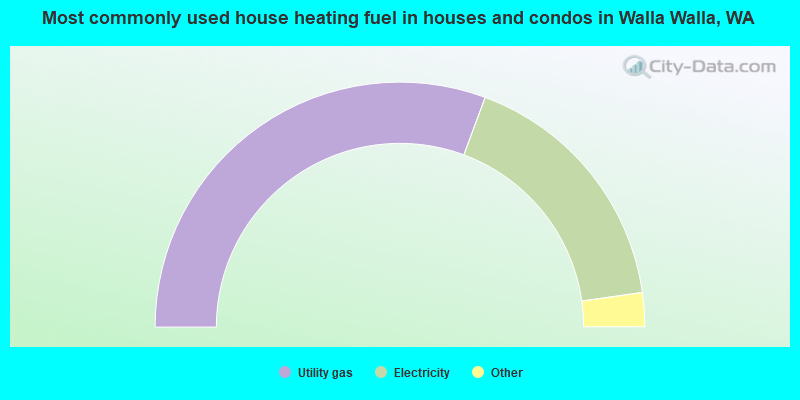
- 61.4%Utility gas
- 34.2%Electricity
- 1.7%Bottled, tank, or LP gas
- 1.7%Wood
- 0.6%Fuel oil, kerosene, etc.
- 0.3%Solar energy
- 0.2%Other fuel
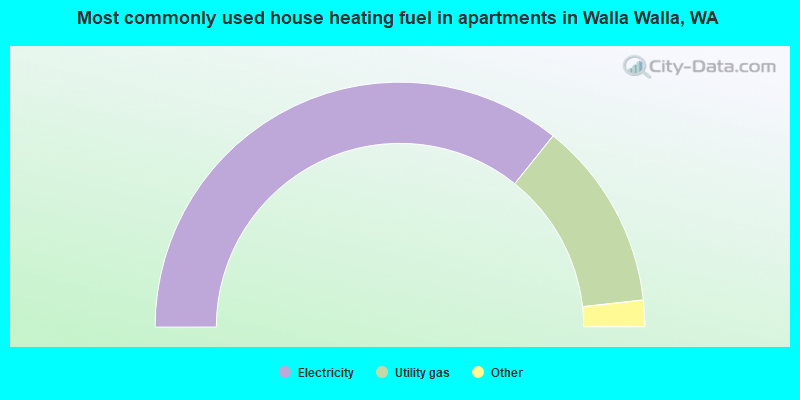
- 71.5%Electricity
- 25.0%Utility gas
- 1.5%Bottled, tank, or LP gas
- 1.1%No fuel used
- 0.3%Fuel oil, kerosene, etc.
- 0.3%Coal or coke
- 0.2%Wood
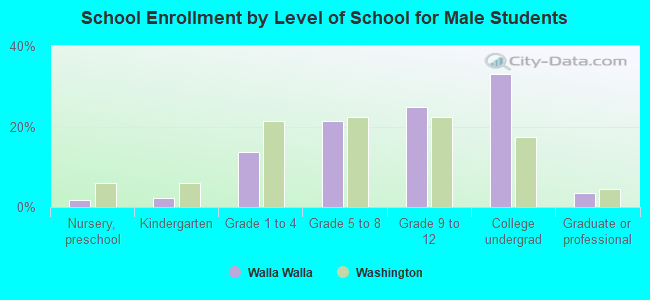
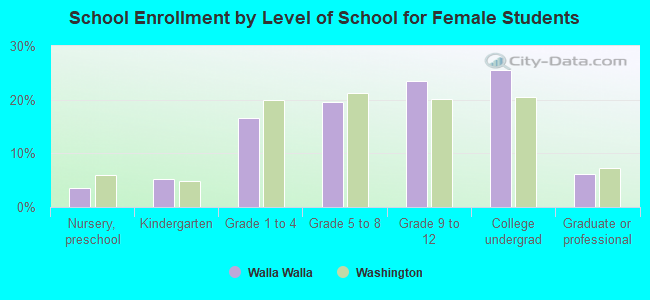
Private vs. public school enrollment:
| Here: | 1.3% |
| Washington: | 12.4% |
| Here: | 1.9% |
| Washington: | 9.2% |
| Here: | 44.4% |
| Washington: | 16.5% |