Jump to a detailed profile or search site with Google Custom Search

Walnut Creek, CA (California) Houses and Residents

Estimated median house or condo value in 2022: $1,055,400 (it was $337,700 in 2000)
Walnut Creek:

$1,055,400
California:

$715,900
Lower value quartile - upper value quartile: $655,900 - $1,579,200

Mean price in 2022:

Detached houses: $1,444,724
Here:

$1,444,724
State:

$988,808

Townhouses or other attached units: $907,154
Here:

$907,154
State:

$838,546

In 2-unit structures: $853,897
Here:

$853,897
State:

$1,138,100

In 3-to-4-unit structures: $653,735
Here:

$653,735
State:

$824,253

In 5-or-more-unit structures: $616,134
Here:

$616,134
State:

$730,996

Total population: 67,673 (Urban population: 64,134, Rural population: 449 (all nonfarm))

Houses: 32,480 (31,583 occupied: 20,252 owner occupied, 11,331 renter occupied)

% of renters here:

36%
State:

44%

Housing density: 1,631 houses/condos per square mile

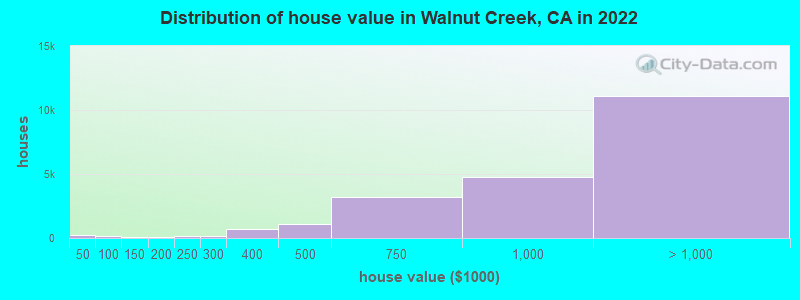
Median price asked for vacant for-sale houses and condos in 2022: $389,145.

Median contract rent in 2022: over $2,000 (lower quartile is $1,690, upper quartile is over $2,000)


Median rent asked for vacant for-rent units in 2022: $2,323


Median gross rent in Walnut Creek, CA in 2022: over $2,000

Housing units in Walnut Creek with a mortgage: 11,893 (1,446 second mortgage, 46 home equity loan, 1,400 both second mortgage and home equity loan)
Houses without a mortgage: 216

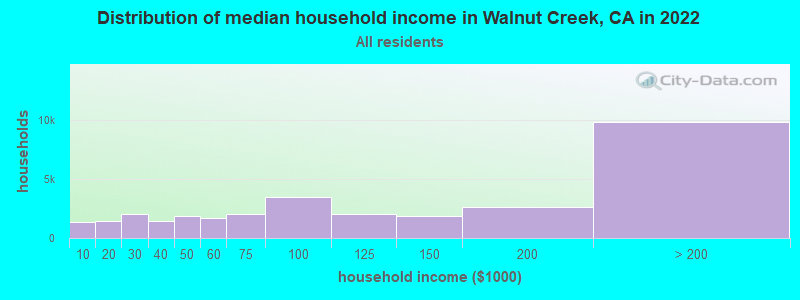
Median household income for houses/condos with a mortgage: $215,412

Median household income for apartments without a mortgage: $67,544

Median monthly housing costs: $2,397

Compare current foreclosures in Walnut Creek, CA:

Check out more offers in Walnut Creek, CA.
Powered by Foreclosure.com

Settings
X
Data:
Loading data...
Based on 2000-2022 data
Loading data...

123
Hide US histogram

Walnut Creek, California Age and Sex of Residents
Median year house/condo built: 1971

Median year apartment built: 1979

Household type by relationship:

Households: 68,969
  • Male householders: 14,574 (4,549 living alone), Female householders: 17,009 (8,541 living alone)
  • 13,533 spouses (13,377 opposite-sex spouses), 1,580 unmarried partners, (1,580 opposite-sex unmarried partners), 17,560 children (16,526 natural, 436 adopted, 598 stepchildren), 537 grandchildren, 143 brothers or sisters, 543 parents, 64 foster children, 803 other relatives, 1,494 non-relatives
  • In group quarters: 1,129

Size of family households: 7,816 2-persons, 2,812 3-persons, 3,671 4-persons, 1,247 5-persons, 812 6-persons, 76 7-or-more-persons.

Size of nonfamily households: 13,090 1-person, 1,877 2-persons, 144 3-persons, 38 4-persons.

8,203 married couples with children.
1,681 single-parent households (373 men, 1,308 women).

72.5% of residents of Walnut Creek speak English at home.
6.4% of residents speak Spanish at home (77% speak English very well, 18% speak English well, 5% speak English not well, 1% don't speak English at all).
9.8% of residents speak other Indo-European language at home (71% speak English very well, 17% speak English well, 7% speak English not well, 5% don't speak English at all).
9.6% of residents speak Asian or Pacific Island language at home (54% speak English very well, 32% speak English well, 11% speak English not well, 3% don't speak English at all).
2.3% of residents speak other language at home (68% speak English very well, 22% speak English well, 9% speak English not well, 1% don't speak English at all).

Foreign born population: 14,194 (20.6%)
(62.5% of them are naturalized citizens)

Median number of rooms in houses and condos:
Here:

5.9
State:

6.0

Median number of rooms in apartments
Here:

3.5
State:

3.9

Owner-occupied Renter-occupied
Bedrooms in owner-occupied houses and condos in Walnut Creek, California
  • Bedrooms in owner-occupied houses and condos in Walnut Creek, California
  • 64no bedroom
  • 1,2231 bedroom
  • 6,7742 bedrooms
  • 5,2573 bedrooms
  • 4,9664 bedrooms
  • 1,9685+ bedrooms
Bedrooms in renter-occupied apartments in Walnut Creek, California
  • Bedrooms in renter-occupied apartments in Walnut Creek, California
  • 1,321no bedroom
  • 3,2551 bedroom
  • 5,0272 bedrooms
  • 1,2413 bedrooms
  • 4064 bedrooms
  • 815+ bedrooms
Owner-occupied Renter-occupied
Cars and other vehicles available in Walnut Creek in owner-occupied houses/condos
  • Cars and other vehicles available in Walnut Creek in owner-occupied houses/condos
  • 882no vehicle
  • 9,1961 vehicle
  • 6,3712 vehicles
  • 2,5633 vehicles
  • 9464 vehicles
  • 2945+ vehicles
Cars and other vehicles available in Walnut Creek in renter-occupied apartments
  • Cars and other vehicles available in Walnut Creek in renter-occupied apartments
  • 1,232no vehicle
  • 5,7811 vehicle
  • 4,0132 vehicles
  • 3053 vehicles
  • 04 vehicles
  • 05+ vehicles
Owner-occupied Renter-occupied
Rooms in owner-occupied houses in Walnut Creek, California
  • Rooms in owner-occupied houses in Walnut Creek, California
  • 01 room
  • 2472 rooms
  • 1,6123 rooms
  • 3,6134 rooms
  • 3,4745 rooms
  • 3,1036 rooms
  • 2,3997 rooms
  • 3,3818 rooms
  • 2,4239+ rooms
Rooms in renter-occupied apartments in Walnut Creek, California
  • Rooms in renter-occupied apartments in Walnut Creek, California
  • 1,3211 room
  • 1,3862 rooms
  • 2,9863 rooms
  • 2,9154 rooms
  • 1,6825 rooms
  • 4936 rooms
  • 2687 rooms
  • 08 rooms
  • 2809+ rooms
Year house built
Median 2022 house/condo value by year built
Median house/condo value by year householder moved into unit
Breakdown of mean house values by ages of householders
Owners and renters by unit type in Walnut Creek, CA
  • Walnut Creek, CA household income distribution

  • Distribution of median household income in Walnut Creek, CA in 2022
  • 1,322Less than $10,000
  • 1,404$10,000 to $19,999
  • 2,051$20,000 to $29,999
  • 1,411$30,000 to $39,999
  • 1,833$40,000 to $49,999
  • 1,705$50,000 to $59,999
  • 2,018$60,000 to $74,999
  • 3,509$75,000 to $99,999
  • 1,999$100,000 to $124,999
  • 1,848$125,000 to $149,999
  • 2,642$150,000 to $199,999
  • 9,841$200,000 or more
  • Home value of owner - occupied houses in 2022 in Walnut Creek, CA

  • Distribution of house value in Walnut Creek, CA in 2022
  • 168Less than $10,000
  • 8$10,000 to $14,999
  • 35$25,000 to $29,999
  • 36$30,000 to $34,999
  • 26$50,000 to $59,999
  • 4$60,000 to $69,999
  • 14$70,000 to $79,999
  • 112$80,000 to $89,999
  • 39$100,000 to $124,999
  • 26$125,000 to $149,999
  • 27$150,000 to $174,999
  • 26$175,000 to $199,999
  • 139$200,000 to $249,999
  • 133$250,000 to $299,999
  • 681$300,000 to $399,999
  • 1,065$400,000 to $499,999
  • 3,236$500,000 to $749,999
  • 4,798$750,000 to $999,999
  • 6,355$1,000,000 to $1,499,999
  • 3,033$1,500,000 to $1,999,999
  • 1,685$2,000,000 or more
  • Rent paid by renters in 2022 in Walnut Creek, CA

  • Distribution of rent paid by renters in Walnut Creek, CA in 2022
  • 41$200 to $249
  • 165$250 to $299
  • 78$300 to $349
  • 71$350 to $399
  • 110$400 to $449
  • 23$450 to $499
  • 31$550 to $599
  • 45$600 to $649
  • 21$650 to $699
  • 42$700 to $749
  • 10$750 to $799
  • 25$800 to $899
  • 59$900 to $999
  • 244$1,000 to $1,249
  • 292$1,250 to $1,499
  • 1,918$1,500 to $1,999
  • 2,390$2,000 to $2,499
  • 1,824$2,500 to $2,999
  • 1,299$3,000 to $3,499
  • 1,761$3,500 or more
  • 480No cash rent
Time Leaving Home To Go To Work in 2022

Percentage of workers working in this county: 74.1%
Number of people working at home: 8,324 (27.4% of all workers)

Travel time (in minutes) to work in 2022

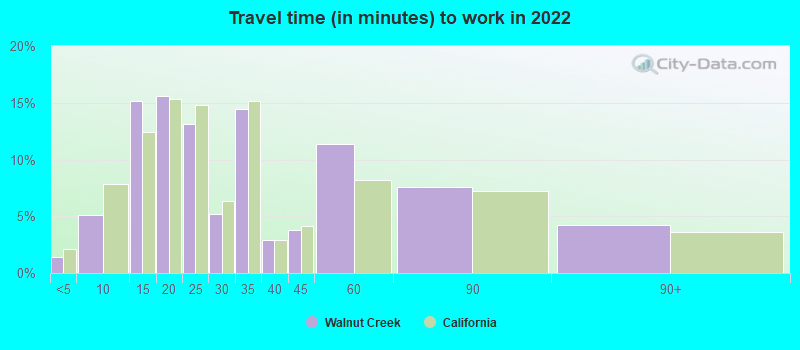
Travel time to work (commute)

  • Less than 5 minutes: 433
  • 5 to 9 minutes: 1,493
  • 10 to 14 minutes: 3,628
  • 15 to 19 minutes: 2,445
  • 20 to 24 minutes: 3,001
  • 25 to 29 minutes: 1,370
  • 30 to 34 minutes: 2,945
  • 35 to 39 minutes: 475
  • 40 to 44 minutes: 1,186
  • 45 to 59 minutes: 1,717
  • 60 to 89 minutes: 2,370
  • 90 or more minutes: 950
Means of transportation to work in 2022 - Walnut Creek

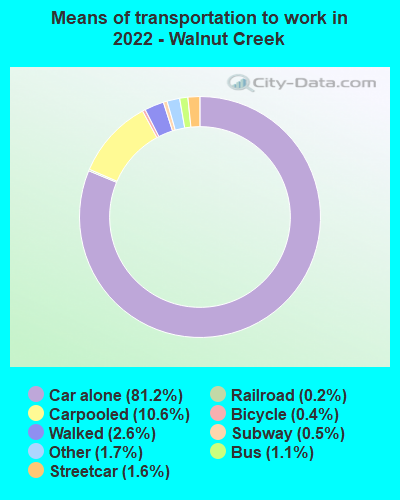
Means of transportation to work:

  • Drove a car alone: 37,336 (64.8%)
  • Carpooled: 5,433 (9.4%)
  • Bus: 411 (0.7%)
  • Subway or elevated rail: 508 (0.9%)
  • Long-distance train or commuter rail: 190 (0.3%)
  • Light rail, streetcar or trolley: 77 (0.1%)
  • Ferryboat: 17 (0.0%)
  • Taxi: 834 (1.4%)
  • Bicycle: 129 (0.2%)
  • Walked: 1,705 (3.0%)
  • Worked at home: 9,901 (17.2%)
Class of Workers in 2022
  • Unemployment by race in 2022
  • Unemployment rate for White non-Hispanic residents
  • 4.5%Males
  • 7.1%Females
  • Unemployment rate for Black residents
  • 3.9%Males
  • 0.8%Females
  • Unemployment rate for American Indian and Alaska Native residents
  • 27.3%Females
  • Unemployment rate for Asian residents
  • 3.2%Males
  • 2.6%Females
  • Unemployment rate for other race residents
  • 8.1%Females
  • Unemployment rate for two or more race residents
  • 3.9%Males
  • 3.2%Females
  • Unemployment rate for Hispanic or Latino residents
  • 7.9%Males
  • 7.0%Females
Year of entry for the foreign-born population in Walnut Creek, California
  • Year of entry for the foreign-born population in Walnut Creek, California
  • 5,5572010 or later
  • 2,5642000 to 2009
  • 2,7591990 to 1999
  • 2,7831980 to 1989
  • 1,8911970 to 1979
  • 2,995Before 1970
Ancestries in Walnut Creek, CA

First ancestries reported:

  • English: 2,992 (8.3%)
  • German: 2,570 (7.2%)
  • Irish: 1,696 (4.7%)
  • Italian: 1,466 (4.1%)
  • European: 1,331 (3.7%)
  • American: 1,243 (3.5%)
  • Iranian: 999 (2.8%)
  • Polish: 706 (2.0%)
  • Russian: 680 (1.9%)
  • Scottish: 662 (1.8%)
  • Ukrainian: 509 (1.4%)
  • Norwegian: 502 (1.4%)
  • Eastern European: 421 (1.2%)
  • French: 418 (1.2%)
  • Welsh: 370 (1.0%)
  • Portuguese: 352 (1.0%)
  • Dutch: 230 (0.6%)
  • Armenian: 201 (0.6%)
  • Czech: 193 (0.5%)
  • Greek: 192 (0.5%)
  • Scotch-Irish: 192 (0.5%)
  • Ethiopian: 191 (0.5%)
  • Israeli: 183 (0.5%)
  • Finnish: 178 (0.5%)
  • British: 174 (0.5%)
  • Northern European: 169 (0.5%)
  • Czechoslovakian: 165 (0.5%)
  • Bulgarian: 151 (0.4%)
  • Arab: 129 (0.4%)
  • Swedish: 126 (0.4%)
  • African: 123 (0.3%)
  • Afghan: 114 (0.3%)
  • French Canadian: 101 (0.3%)
  • Syrian: 100 (0.3%)
  • Palestinian: 99 (0.3%)
  • Canadian: 91 (0.3%)
  • Egyptian: 83 (0.2%)
  • Austrian: 83 (0.2%)
  • Swiss: 76 (0.2%)
  • Nigerian: 68 (0.2%)
  • Danish: 67 (0.2%)
  • Yugoslavian: 65 (0.2%)
  • Croatian: 59 (0.2%)
  • Lebanese: 58 (0.2%)
  • Brazilian: 53 (0.1%)
  • Lithuanian: 49 (0.1%)
  • Turkish: 48 (0.1%)
  • Belgian: 43 (0.1%)
  • Jamaican: 38 (0.1%)
  • Hungarian: 37 (0.1%)
  • Romanian: 35 (0.10%)
  • Serbian: 32 (0.09%)
  • Scandinavian: 30 (0.08%)
  • Jordanian: 26 (0.07%)
  • Iraqi: 23 (0.06%)
  • Slovak: 20 (0.06%)
  • Cypriot: 18 (0.05%)
  • Slavic: 18 (0.05%)
  • Celtic: 15 (0.04%)
  • Trinidadian and Tobagonian: 13 (0.04%)
  • Assyrian: 9 (0.03%)
  • Latvian: 8 (0.02%)
  • Slovene: 8 (0.02%)
  • Ghanaian: 6 (0.02%)
  • Icelander: 5 (0.01%)

Most common places of birth for foreign-born residents (%):

China, excluding Hong Kong and Taiwan
Walnut Creek:

9.5% (1,480)
California:

6.6% (684,672)

India
Walnut Creek:

9.0% (1,401)
California:

5.2% (539,184)

Iran
Walnut Creek:

6.8% (1,058)
California:

2.0% (206,004)

Canada
Walnut Creek:

4.2% (661)
California:

1.2% (127,477)

Mexico
Walnut Creek:

4.0% (631)
California:

37.2% (3,881,193)

Korea
Walnut Creek:

3.9% (614)
California:

3.0% (315,248)

Philippines
Walnut Creek:

3.8% (592)
California:

7.8% (818,297)

Russia
Walnut Creek:

3.7% (574)
California:

0.7% (71,932)

Ukraine
Walnut Creek:

2.9% (460)
California:

0.6% (60,761)

Taiwan
Walnut Creek:

2.9% (451)
California:

1.7% (176,274)

Vietnam
Walnut Creek:

2.4% (377)
California:

4.9% (512,335)

England
Walnut Creek:

2.4% (368)
California:

0.6% (57,953)

United Kingdom, excluding England and Scotland
Walnut Creek:

2.2% (349)
California:

0.6% (60,582)

Panama
Walnut Creek:

2.2% (346)
California:

0.1% (9,209)

Peru
Walnut Creek:

2.2% (343)
California:

0.7% (74,025)

Algeria
Walnut Creek:

2.0% (309)
California:

0.0% (4,729)

Germany
Walnut Creek:

2.0% (305)
California:

0.7% (73,304)

Afghanistan
Walnut Creek:

1.7% (266)
California:

0.5% (53,260)

Hong Kong
Walnut Creek:

1.7% (262)
California:

1.0% (105,215)

Bangladesh
Walnut Creek:

1.6% (243)
California:

0.2% (18,366)

Place of birth for U.S.-born residents:

  • This state: 37,145
  • Other state: 16,414
  • Northeast: 5,084
  • Midwest: 5,195
  • South: 2,781
  • West: 3,354

84.1% of Walnut Creek residents lived in the same house 1 years ago.
   Out of people who lived in different houses, 29.1% lived in this county.
   Out of people who lived in different counties, 78.7% lived in California.


Walnut Creek:

84.1%
State average:

88.9%

Education attainment for males 25 years and older:

  • No schooling: 331
  • Nursery to 4th grade: 21
  • 5th and 6th grade: 256
  • 7th and 8th grade: 0
  • 9th grade: 38
  • 10th grade: 52
  • 11th grade: 0
  • 12th grade, no diploma: 132
  • High school graduate (or equivalency): 1,811
  • Less than 1 year of college: 1,724
  • Some college more than 1 year, no degree: 1,309
  • Associate degree: 1,434
  • Bachelor's degree: 8,620
  • Master's degree: 4,805
  • Professional school degree: 2,143
  • Doctorate degree: 1,011
Educational Attainment for Males

Education attainment for females 25 years and older:

  • No schooling: 84
  • Nursery to 4th grade: 0
  • 5th and 6th grade: 30
  • 7th and 8th grade: 19
  • 9th grade: 70
  • 10th grade: 533
  • 11th grade: 0
  • 12th grade, no diploma: 266
  • High school graduate (or equivalency): 3,021
  • Less than 1 year of college: 1,046
  • Some college more than 1 year, no degree: 2,373
  • Associate degree: 2,591
  • Bachelor's degree: 9,389
  • Master's degree: 4,947
  • Professional school degree: 1,994
  • Doctorate degree: 1,199
Educational Attainment for Females
Walnut Creek marital status for males
Walnut Creek marital status for females

Housing units in structures:

  • One, detached: 12,386
  • One, attached: 4,523
  • Two: 563
  • 3 or 4: 2,793
  • 5 to 9: 2,401
  • 10 to 19: 1,653
  • 20 to 49: 1,899
  • 50 or more: 6,031
  • Mobile homes: 231
Housing units lacking complete plumbing facilities in 2022: 0.1%

Housing units lacking complete kitchen facilities in 2022: 1.7%

House/condo owner moved in on average 11 years ago

Renter moved in on average 2 years ago

Year householders moved into residence in Walnut Creek
Houses and condos Apartments
Most commonly used house heating fuel in houses and condos in Walnut Creek, CA
  • 69.3%Utility gas
  • 27.7%Electricity
  • 1.1%Bottled, tank, or LP gas
  • 1.0%Solar energy
  • 0.5%No fuel used
  • 0.2%Wood
Most commonly used house heating fuel in apartments in Walnut Creek, CA
  • 52.7%Electricity
  • 44.4%Utility gas
  • 1.0%Bottled, tank, or LP gas
  • 0.8%No fuel used
  • 0.6%Solar energy
  • 0.3%Fuel oil, kerosene, etc.
  • 0.1%Other fuel
  • 0.1%Wood

Private vs. public school enrollment:

Students in private schools in grades 1 to 8 (elementary and middle school): 1,267
Here:

22.4%
California:

10.5%

Students in private schools in grades 9 to 12 (high school): 402
Here:

14.1%
California:

8.5%

Students in private undergraduate colleges: 339
Here:

12.4%
California:

15.9%
School Enrollment by Level of School for Male Students
School Enrollment by Level of School for Female Students
Age and Sex of Sensory-Disabled Noninstitutionalized Residents
Age and Sex of Physically-Disabled Noninstitutionalized Residents
Age and Sex of Mentally-Disabled Noninstitutionalized Residents
Age and Sex of Self-Care Disabled Noninstitutionalized Residents
Age and Sex of Go-Outside-Home Disabled Noninstitutionalized Residents
Age and Sex of Noninstitutionalized Residents with Employment Disability