Walpole, MA (Massachusetts) Houses and Residents
| Walpole: | $548,474 |
| Massachusetts: | $534,700 |
Mean price in 2022:
Detached houses: $642,576
Here: $642,576 State: $651,570 Townhouses or other attached units: $543,721
Here: $543,721 State: $617,749 In 2-unit structures: $365,649
Here: $365,649 State: $594,808 In 3-to-4-unit structures: $605,877
Here: $605,877 State: $601,912 In 5-or-more-unit structures: $428,214
Here: $428,214 State: $555,768
Total population: 5,918 (Urban population: 5,844, Rural population: 11 (all nonfarm))
Houses: 2,880 (2,716 occupied: 2,186 owner occupied, 516 renter occupied)
| % of renters here: | 19% |
| State: | 38% |
Housing density: 1,009 houses/condos per square mile
Median price asked for vacant for-sale houses and condos in 2022 in this county: $751,928.
Median contract rent in 2022: $1,637 (lower quartile is $697, upper quartile is over $2,000)
Median rent asked for vacant for-rent units in 2022: $691
Median gross rent in Walpole, MA in 2022: $1,623
Housing units in Walpole with a mortgage: 1,408 (225 second mortgage, 0 home equity loan, 215 both second mortgage and home equity loan)
Houses without a mortgage: 112
Median household income for houses/condos with a mortgage: $164,058
Median household income for apartments without a mortgage: $71,416
Median monthly housing costs: $1,925
Compare current foreclosures near Walpole, MA:
| Photo | Address | Area | Beds / Baths | Price | Details |
|---|---|---|---|---|---|

|
#1
Granite St
Walpole, MA 02081
|
2,370 sq. feet
|
3 baths 4 beds |
show details | |

|
#2
Oak Hill Dr
Walpole, MA 02081
|
1,708 sq. feet
|
2 baths 4 beds |
show details | |

|
#3
South St
Walpole, MA 02081
|
1,590 sq. feet
|
1 baths 3 beds |
show details | |

|
#4
Breezewood Ln
Walpole, MA 02081
|
1,056 sq. feet
|
1 baths 3 beds |
show details | |

|
#5
East St
Walpole, MA 02081
|
- sq. feet
|
- baths - beds |
show details | |

|
#6
West St Ste 3
Walpole, MA 02081
|
- sq. feet
|
- baths - beds |
show details | |

|
#7
Johnson Rd
North Weymouth, MA 02191
|
748 sq. feet
|
1 baths 2 beds |
$365,000
|
show details |

|
#8
Stillman St
Framingham, MA 01702
|
1,122 sq. feet
|
1 baths 2 beds |
$418,000
|
show details |

|
#9
Boyd St
Boston, MA 02124
|
3,970 sq. feet
|
3 baths 9 beds |
$650,000
|
show details |

|
#10
Adams St
Hyde Park, MA 02136
|
1,988 sq. feet
|
2 baths 4 beds |
$499,200
|
show details |
| Photo | Address | Area | Beds / Baths | Price | Details |
|---|---|---|---|---|---|

|
#11
Loomis St
North Attleboro, MA 02760
|
2,294 sq. feet
|
2 baths 4 beds |
$700,000
|
show details |

|
#12
Tall Oaks Dr Unit 508
South Weymouth, MA 02190
|
1,300 sq. feet
|
2 baths 2 beds |
$285,000
|
show details |

|
#13
Cook Rd
Cumberland, RI 02864
|
2,050 sq. feet
|
2 baths 4 beds |
$724,900
|
show details |

|
#14
Broadway
North Attleboro, MA 02760
|
2,602 sq. feet
|
3 baths 5 beds |
show details | |

|
#15
Kendrick Ave Apt 307
Quincy, MA 02169
|
1,234 sq. feet
|
2 baths 2 beds |
show details | |

|
#16
Bittersweet Ln
Randolph, MA 02368
|
882 sq. feet
|
1 baths 2 beds |
show details | |

|
#17
Church St
Boston, MA 02122
|
3,663 sq. feet
|
3 baths 6 beds |
show details | |

|
#18
S Franklin St
Holbrook, MA 02343
|
940 sq. feet
|
2 baths 2 beds |
show details | |

|
#19
Riverside Rd
Franklin, MA 02038
|
3,093 sq. feet
|
2 baths 4 beds |
show details | |

|
#20
Cedar St
Ashland, MA 01721
|
2,756 sq. feet
|
3 baths 4 beds |
show details |
| Photo | Address | Area | Beds / Baths | Price | Details |
|---|---|---|---|---|---|

|
#21
Marcy Rd
Mattapan, MA 02126
|
1,168 sq. feet
|
1 baths 3 beds |
show details | |

|
#22
Neponset St
Canton, MA 02021
|
1,053 sq. feet
|
1 baths 2 beds |
show details | |

|
#23
Brahms St
Roslindale, MA 02131
|
1,604 sq. feet
|
1 baths 4 beds |
show details | |

|
#24
Rockland St
Abington, MA 02351
|
1,700 sq. feet
|
1 baths 4 beds |
show details | |

|
#25
Berkshire Ave
Sharon, MA 02067
|
1,289 sq. feet
|
2 baths 3 beds |
show details | |

|
#26
Grv St
Needham, MA 02492
|
6,542 sq. feet
|
4 baths 6 beds |
show details | |

|
#27
Magoun Ave
Brockton, MA 02301
|
868 sq. feet
|
1 baths 3 beds |
show details | |

|
#28
Ballou St
Quincy, MA 02169
|
1,758 sq. feet
|
1 baths 3 beds |
show details | |

|
#29
Pond St
Franklin, MA 02038
|
1,100 sq. feet
|
1 baths 3 beds |
show details | |

|
#30
Melville Ct
Brockton, MA 02301
|
1,140 sq. feet
|
2 baths 3 beds |
show details |
| Photo | Address | Area | Beds / Baths | Price | Details |
|---|---|---|---|---|---|

|
#31
Tamarack Ln
Abington, MA 02351
|
1,495 sq. feet
|
2 baths 2 beds |
show details | |

|
#32
Tremont St
Brockton, MA 02301
|
1,470 sq. feet
|
2 baths 4 beds |
show details | |

|
#33
Pridemark Ln
Attleboro, MA 02703
|
1,340 sq. feet
|
1 baths 2 beds |
show details | |

|
#34
Congress Pl
Dedham, MA 02026
|
1,966 sq. feet
|
2 baths 4 beds |
show details | |

|
#35
Goodnow Ln
Framingham, MA 01702
|
2,342 sq. feet
|
2 baths 4 beds |
show details | |

|
#36
Emily Jeffers Rd # L
Randolph, MA 02368
|
1,350 sq. feet
|
1 baths 3 beds |
show details | |

|
#37
Webster St
Randolph, MA 02368
|
1,080 sq. feet
|
1 baths 3 beds |
show details | |

|
#38
Rockwell Ave
Brockton, MA 02302
|
1,774 sq. feet
|
1 baths 3 beds |
show details | |

|
#39
Thomas St
Jamaica Plain, MA 02130
|
1,990 sq. feet
|
2 baths 2 beds |
show details | |

|
#40
Cappys Way
Brockton, MA 02302
|
2,128 sq. feet
|
2 baths 4 beds |
show details |
| Photo | Address | Area | Beds / Baths | Price | Details |
|---|---|---|---|---|---|

|
#41
Ridgehill Rd
Canton, MA 02021
|
1,196 sq. feet
|
1 baths 3 beds |
show details | |

|
#42
Gilbert Rd
Needham, MA 02492
|
1,778 sq. feet
|
2 baths 3 beds |
show details | |

|
#43
Richmond St
Boston, MA 02124
|
2,516 sq. feet
|
2 baths 4 beds |
show details | |

|
#44
Everett Cir
Hopkinton, MA 01748
|
5,180 sq. feet
|
3 baths 4 beds |
show details | |

|
#45
Vassar St # 2
Boston, MA 02121
|
1,076 sq. feet
|
1 baths 3 beds |
show details | |

|
#46
Harlem St
Boston, MA 02121
|
4,105 sq. feet
|
2 baths 6 beds |
show details | |

|
#47
Elliot Ave
Quincy, MA 02171
|
800 sq. feet
|
1 baths 2 beds |
show details | |

|
#48
Greenwood St
Boston, MA 02121
|
2,672 sq. feet
|
2 baths 6 beds |
show details | |

|
#49
Crane St
Norton, MA 02766
|
2,488 sq. feet
|
3 baths 4 beds |
show details | |

|
Check over 1 million property listings on Foreclosure.com!
|
browse all offers | |||

Latest news about housing in Walpole, MA collected exclusively by city-data.com from local newspapers, TV, and radio stations

 | How Much Massachusetts Households Make Per Year: Census Data (37 replies) |
| 2023 Real Estate Observations (5278 replies) |
| Buying Pulte Homes in Westwood (19 replies) |
| Trying to figure out this house situation (59 replies) |
| Rents rapidly climbing (62 replies) |
| towns that offer the most jobs per dollar of house (58 replies) |

Median year apartment built: 1972
Household type by relationship:
Households: 6,403- Male householders: 1,032 (189 living alone), Female householders: 1,655 (700 living alone)
1,278 spouses (1,278 opposite-sex spouses), 152 unmarried partners, (134 opposite-sex unmarried partners), 2,000 children (1,844 natural, 155 adopted, 0 stepchildren), 16 grandchildren, 31 brothers or sisters, 78 parents, 14 foster children, 88 other relatives, 53 non-relatives
- In group quarters: 2
Size of family households: 577 2-persons, 418 3-persons, 447 4-persons, 192 5-persons.
Size of nonfamily households: 929 1-person, 138 2-persons.
1,122 married couples with children.
135 single-parent households (10 men, 125 women).
85.4% of residents of Walpole speak English at home.
2.2% of residents speak Spanish at home (71% speak English very well, 29% speak English well).
7.3% of residents speak other Indo-European language at home (78% speak English very well, 22% speak English well).
0.8% of residents speak Asian or Pacific Island language at home (43% speak English very well, 20% speak English well, 37% speak English not well).
3.4% of residents speak other language at home (90% speak English very well, 10% speak English well).
Foreign born population: 673 (10.5%)
(68.6% of them are naturalized citizens)
| Here: | 6.3 |
| State: | 6.5 |
| Here: | 4.0 |
| State: | 4.0 |

- Bedrooms in owner-occupied houses and condos in Walpole, Massachusetts
- 0no bedroom
- 351 bedroom
- 5392 bedrooms
- 1,0353 bedrooms
- 4844 bedrooms
- 935+ bedrooms

- Bedrooms in renter-occupied apartments in Walpole, Massachusetts
- 48no bedroom
- 1411 bedroom
- 1912 bedrooms
- 803 bedrooms
- 224 bedrooms
- 335+ bedrooms

- Cars and other vehicles available in Walpole in owner-occupied houses/condos
- 74no vehicle
- 6931 vehicle
- 8882 vehicles
- 3083 vehicles
- 1784 vehicles
- 465+ vehicles

- Cars and other vehicles available in Walpole in renter-occupied apartments
- 25no vehicle
- 2631 vehicle
- 2282 vehicles
- 03 vehicles
- 04 vehicles
- 05+ vehicles

- Rooms in owner-occupied houses in Walpole, Massachusetts
- 01 room
- 02 rooms
- 853 rooms
- 1504 rooms
- 3515 rooms
- 6086 rooms
- 2397 rooms
- 3658 rooms
- 3889+ rooms

- Rooms in renter-occupied apartments in Walpole, Massachusetts
- 481 room
- 192 rooms
- 1473 rooms
- 904 rooms
- 935 rooms
- 636 rooms
- 07 rooms
- 48 rooms
- 519+ rooms


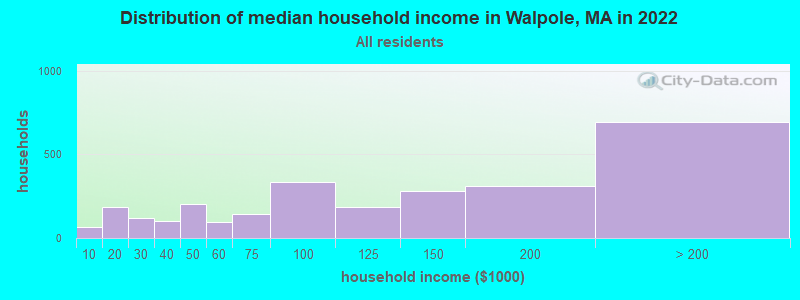
Walpole, MA household income distribution

- 65Less than $10,000
- 186$10,000 to $19,999
- 122$20,000 to $29,999
- 101$30,000 to $39,999
- 205$40,000 to $49,999
- 93$50,000 to $59,999
- 141$60,000 to $74,999
- 334$75,000 to $99,999
- 185$100,000 to $124,999
- 278$125,000 to $149,999
- 308$150,000 to $199,999
- 693$200,000 or more
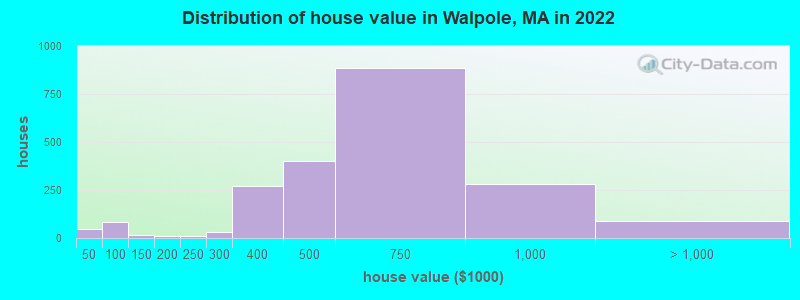
Home value of owner - occupied houses in 2022 in Walpole, MA
-
- 49Less than $10,000
- 83$80,000 to $89,999
- 16$100,000 to $124,999
- 8$175,000 to $199,999
- 13$200,000 to $249,999
- 29$250,000 to $299,999
- 270$300,000 to $399,999
- 399$400,000 to $499,999
- 882$500,000 to $749,999
- 278$750,000 to $999,999
- 85$1,000,000 to $1,499,999
Rent paid by renters in 2022 in Walpole, MA
-
- 45$350 to $399
- 11$450 to $499
- 36$650 to $699
- 8$700 to $749
- 7$900 to $999
- 17$1,000 to $1,249
- 25$1,250 to $1,499
- 123$1,500 to $1,999
- 54$2,000 to $2,499
- 40$2,500 to $2,999
- 89No cash rent


Percentage of workers working in this county: 62.1%
Number of people working at home: 670 (20.0% of all workers)
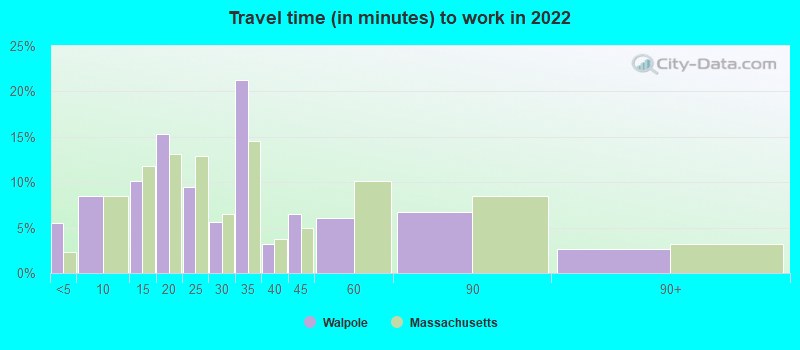
Travel time to work (commute)
- Less than 5 minutes: 120
- 5 to 9 minutes: 130
- 10 to 14 minutes: 153
- 15 to 19 minutes: 354
- 20 to 24 minutes: 102
- 25 to 29 minutes: 126
- 30 to 34 minutes: 493
- 35 to 39 minutes: 135
- 40 to 44 minutes: 111
- 45 to 59 minutes: 384
- 60 to 89 minutes: 251
- 90 or more minutes: 307
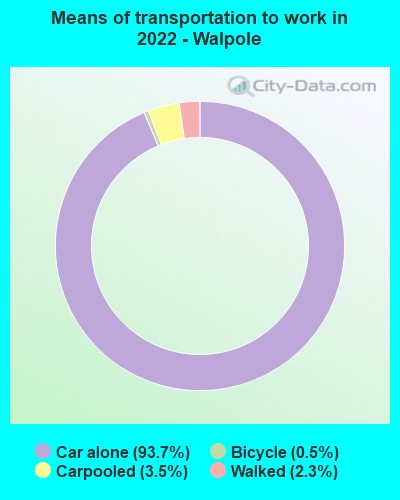
Means of transportation to work:
- Drove a car alone: 2,035 (72.2%)
- Carpooled: 73 (2.6%)
- Bicycle: 6 (0.2%)
- Walked: 47 (1.7%)
- Worked at home: 670 (23.8%)

- Unemployment by race in 2022
- Unemployment rate for White non-Hispanic residents
- 5.4%Males
- 1.8%Females

- Year of entry for the foreign-born population in Walpole, Massachusetts
- 1132010 or later
- 1412000 to 2009
- 1241990 to 1999
- 751980 to 1989
- 241970 to 1979
- 145Before 1970
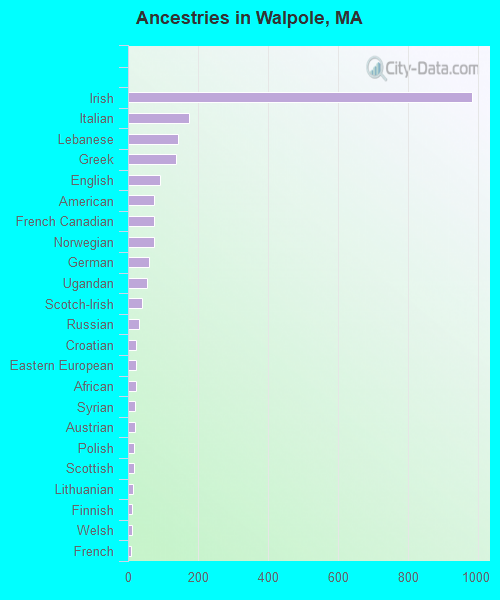
First ancestries reported:
- Irish: 983 (34.6%)
- Italian: 173 (6.1%)
- Lebanese: 142 (5.0%)
- Greek: 137 (4.8%)
- English: 92 (3.2%)
- American: 75 (2.6%)
- French Canadian: 74 (2.6%)
- Norwegian: 74 (2.6%)
- German: 60 (2.1%)
- Ugandan: 53 (1.9%)
- Scotch-Irish: 39 (1.4%)
- Russian: 31 (1.1%)
- Croatian: 24 (0.8%)
- Eastern European: 23 (0.8%)
- African: 23 (0.8%)
- Syrian: 20 (0.7%)
- Austrian: 19 (0.7%)
- Polish: 18 (0.6%)
- Scottish: 18 (0.6%)
- Lithuanian: 13 (0.5%)
- Finnish: 11 (0.4%)
- Welsh: 11 (0.4%)
- French: 9 (0.3%)
- Swedish: 6 (0.2%)
- Czech: 5 (0.2%)
Most common places of birth for foreign-born residents (%):
| Walpole: | 16.7% (112) |
| Massachusetts: | 6.8% (82,934) |
| Walpole: | 13.4% (90) |
| Massachusetts: | 1.1% (13,446) |
| Walpole: | 9.3% (62) |
| Massachusetts: | 0.8% (10,043) |
| Walpole: | 6.9% (46) |
| Massachusetts: | 0.0% (543) |
| Walpole: | 6.3% (42) |
| Massachusetts: | 0.4% (5,099) |
| Walpole: | 6.1% (41) |
| Massachusetts: | 0.6% (7,064) |
| Walpole: | 4.2% (28) |
| Massachusetts: | 0.3% (3,711) |
| Walpole: | 3.9% (26) |
| Massachusetts: | 0.5% (5,553) |
| Walpole: | 3.9% (26) |
| Massachusetts: | 0.6% (7,349) |
| Walpole: | 3.7% (25) |
| Massachusetts: | 0.2% (2,809) |
| Walpole: | 3.4% (23) |
| Massachusetts: | 0.5% (6,073) |
| Walpole: | 3.0% (20) |
| Massachusetts: | 8.4% (103,233) |
| Walpole: | 2.7% (18) |
| Massachusetts: | 0.3% (3,864) |
| Walpole: | 2.4% (16) |
| Massachusetts: | 2.7% (32,733) |
| Walpole: | 2.2% (15) |
| Massachusetts: | 1.5% (18,278) |
| Walpole: | 1.6% (11) |
| Massachusetts: | 2.3% (27,810) |
Place of birth for U.S.-born residents:
- This state: 4,566
- Other state: 1,080
- Northeast: 740
- Midwest: 172
- South: 109
- West: 27
94.2% of Walpole residents lived in the same house 1 years ago.
Out of people who lived in different houses, 34.3% lived in this county.
Out of people who lived in different counties, 67.1% lived in Massachusetts.
| Walpole: | 94.2% |
| State average: | 87.7% |
Education attainment for males 25 years and older:
- No schooling: 50
- Nursery to 4th grade: 0
- 5th and 6th grade: 0
- 7th and 8th grade: 0
- 9th grade: 0
- 10th grade: 19
- 11th grade: 0
- 12th grade, no diploma: 9
- High school graduate (or equivalency): 315
- Less than 1 year of college: 88
- Some college more than 1 year, no degree: 271
- Associate degree: 192
- Bachelor's degree: 695
- Master's degree: 186
- Professional school degree: 42
- Doctorate degree: 68

Education attainment for females 25 years and older:
- No schooling: 0
- Nursery to 4th grade: 0
- 5th and 6th grade: 6
- 7th and 8th grade: 3
- 9th grade: 0
- 10th grade: 0
- 11th grade: 0
- 12th grade, no diploma: 11
- High school graduate (or equivalency): 489
- Less than 1 year of college: 130
- Some college more than 1 year, no degree: 228
- Associate degree: 223
- Bachelor's degree: 1,027
- Master's degree: 562
- Professional school degree: 114
- Doctorate degree: 20


Housing units in structures:
- One, detached: 1,455
- One, attached: 567
- Two: 199
- 3 or 4: 95
- 5 to 9: 366
- 10 to 19: 129
- 20 to 49: 16
- 50 or more: 49
Housing units lacking complete kitchen facilities in 2022: 1.7%
House/condo owner moved in on average 14 years ago
Renter moved in on average 6 years ago

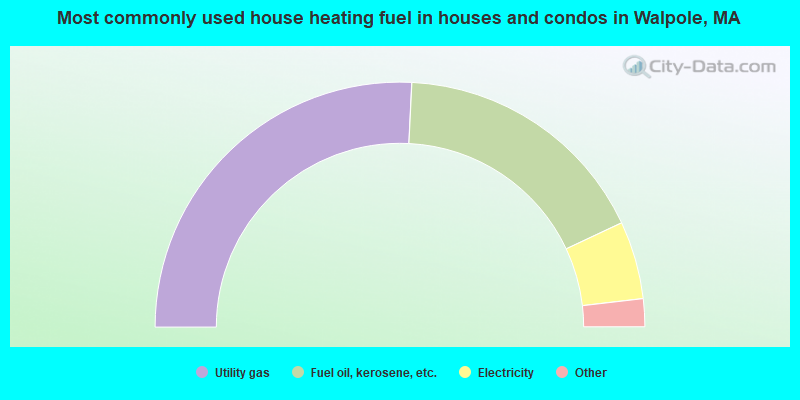
- 51.6%Utility gas
- 34.5%Fuel oil, kerosene, etc.
- 10.3%Electricity
- 2.0%Other fuel
- 1.7%Bottled, tank, or LP gas

- 44.8%Utility gas
- 32.7%Electricity
- 22.5%Fuel oil, kerosene, etc.
Private vs. public school enrollment:
| Here: | 11.7% |
| Massachusetts: | 10.3% |
| Here: | 9.9% |
| Massachusetts: | 12.3% |
| Here: | 44.0% |
| Massachusetts: | 51.2% |


