Washington Grove, MD (Maryland) Houses and Residents
| Washington Grove: | $593,356 |
| Maryland: | $398,100 |
Mean price in 2022:
Detached houses: $589,155
Here: $589,155 State: $526,819
Total population: 573 (Urban population: 483, Rural population: 0)
Houses: 311 (287 occupied: 276 owner occupied, 13 renter occupied)
| % of renters here: | 4% |
| State: | 32% |
Housing density: 944 houses/condos per square mile
Median price asked for vacant for-sale houses and condos in 2022: $831,882.
Median gross rent in Washington Grove, MD in 2022: $-630,897,631
Housing units in Washington Grove with a mortgage: 156 (12 second mortgage, 0 home equity loan, 10 both second mortgage and home equity loan)
Houses without a mortgage: 11
Median household income for houses/condos with a mortgage: $150,871
Median household income for apartments without a mortgage: $104,463
Median monthly housing costs: $1,488
Compare current foreclosures near Washington Grove, MD:
| Photo | Address | Area | Beds / Baths | Price | Details |
|---|---|---|---|---|---|

|
#1
Monroe St NW
Washington, DC 20010
|
- sq. feet
|
2 baths 2 beds |
$665,000
|
show details |

|
#2
Interlachen Dr Apt 111
Silver Spring, MD 20906
|
965 sq. feet
|
1 baths 2 beds |
$148,000
|
show details |

|
#3
Buchanan St NE
Washington, DC 20017
|
1,240 sq. feet
|
2 baths 3 beds |
$325,000
|
show details |

|
#4
Brooke Knolls Rd
Gaithersburg, MD 20882
|
1,704 sq. feet
|
3 baths 4 beds |
$681,500
|
show details |

|
#5
Eastern Ave NE
Washington, DC 20011
|
1,024 sq. feet
|
1 baths 3 beds |
$395,000
|
show details |

|
#6
Hammersmith Cir
Silver Spring, MD 20906
|
1,152 sq. feet
|
1 baths 3 beds |
$328,600
|
show details |

|
#7
Pooks Hill Rd Apt 1612s
Bethesda, MD 20814
|
1,250 sq. feet
|
1 baths 2 beds |
$289,000
|
show details |

|
#8
Wilson Ln Apt 204
Mc Lean, VA 22102
|
925 sq. feet
|
1 baths 2 beds |
$359,900
|
show details |

|
#9
Cathedral Ave NW Apt 108
Washington, DC 20016
|
765 sq. feet
|
1 baths 1 beds |
$269,900
|
show details |

|
#10
Sprigg St S
Frederick, MD 21704
|
2,442 sq. feet
|
4 baths 3 beds |
show details |
| Photo | Address | Area | Beds / Baths | Price | Details |
|---|---|---|---|---|---|

|
#11
Mcwhorter Farm Ct
Damascus, MD 20872
|
6,621 sq. feet
|
6 baths 5 beds |
show details | |

|
#12
Lakeland Dr
Sterling, VA 20164
|
2,143 sq. feet
|
2 baths 3 beds |
show details | |

|
#13
Counsellor Dr
Vienna, VA 22181
|
1,916 sq. feet
|
2 baths 5 beds |
show details | |

|
#14
Tremayne Pl Apt 309
Mc Lean, VA 22102
|
1,180 sq. feet
|
2 baths 2 beds |
show details | |

|
#15
Brassie Pl Apt 201
Montgomery Village, MD 20886
|
1,054 sq. feet
|
2 baths 2 beds |
show details | |

|
#16
Sargent Rd NE
Washington, DC 20017
|
1,360 sq. feet
|
2 baths 3 beds |
show details | |

|
#17
Carriage Hill Dr
Frederick, MD 21704
|
1,868 sq. feet
|
3 baths 3 beds |
show details | |

|
#18
Berryville Rd
Germantown, MD 20874
|
960 sq. feet
|
1 baths 3 beds |
show details | |

|
#19
Jefferson St NW
Washington, DC 20011
|
1,280 sq. feet
|
5 baths 6 beds |
show details | |

|
#20
Avena St
Silver Spring, MD 20902
|
1,188 sq. feet
|
2 baths 3 beds |
show details |
| Photo | Address | Area | Beds / Baths | Price | Details |
|---|---|---|---|---|---|

|
#21
Arkansas Ave
Herndon, VA 20170
|
1,025 sq. feet
|
1 baths 3 beds |
show details | |

|
#22
Manor Ln
Ellicott City, MD 21042
|
864 sq. feet
|
1 baths 2 beds |
show details | |

|
#23
S Arbory Ln
Laurel, MD 20707
|
1,283 sq. feet
|
3 baths 3 beds |
show details | |

|
#24
Navahoe St
Hyattsville, MD 20783
|
1,068 sq. feet
|
2 baths 3 beds |
show details | |

|
#25
Connecticut Ave NW Apt 606
Washington, DC 20008
|
160 sq. feet
|
1 baths 1 beds |
show details | |

|
#26
Palmetto Cir
Germantown, MD 20874
|
1,135 sq. feet
|
2 baths 3 beds |
show details | |

|
#27
Brooke Rd
Sandy Spring, MD 20860
|
5,046 sq. feet
|
4 baths 4 beds |
show details | |

|
#28
Pearl Fog Way
Dunn Loring, VA 22027
|
3,497 sq. feet
|
4 baths 4 beds |
show details | |

|
#29
Weather Worn Way Unit B
Columbia, MD 21046
|
1,146 sq. feet
|
2 baths - beds |
show details | |

|
#30
12th St NW
Washington, DC 20012
|
2,163 sq. feet
|
2 baths 5 beds |
show details |
| Photo | Address | Area | Beds / Baths | Price | Details |
|---|---|---|---|---|---|

|
#31
Alaska Ave NW
Washington, DC 20012
|
1,768 sq. feet
|
2 baths 3 beds |
show details | |

|
#32
Jefferson St NE
Washington, DC 20011
|
1,156 sq. feet
|
1 baths 3 beds |
show details | |

|
#33
Lisa Ct
Herndon, VA 20170
|
1,344 sq. feet
|
3 baths 3 beds |
show details | |

|
#34
Kings Ct
Herndon, VA 20170
|
1,260 sq. feet
|
1 baths 3 beds |
show details | |

|
#35
Emerson St NW
Washington, DC 20011
|
1,280 sq. feet
|
1 baths 3 beds |
show details | |

|
#36
Fairway Dr NE
Vienna, VA 22180
|
1,472 sq. feet
|
3 baths 4 beds |
show details | |

|
#37
2nd St NE
Washington, DC 20011
|
1,088 sq. feet
|
1 baths 2 beds |
show details | |

|
#38
Kansas Ave NW
Washington, DC 20011
|
1,484 sq. feet
|
1 baths 3 beds |
show details | |

|
#39
Florida Ave Apt 103
Herndon, VA 20170
|
1,048 sq. feet
|
1 baths 1 beds |
show details | |

|
#40
Newton Pl NW
Washington, DC 20010
|
1,320 sq. feet
|
1 baths 2 beds |
show details |
| Photo | Address | Area | Beds / Baths | Price | Details |
|---|---|---|---|---|---|

|
#41
Mckinley St NW
Washington, DC 20015
|
1,894 sq. feet
|
2 baths 3 beds |
show details | |

|
#42
Allison St NE
Washington, DC 20017
|
1,706 sq. feet
|
3 baths 4 beds |
show details | |

|
#43
Eagle Point Sq
Leesburg, VA 20176
|
3,982 sq. feet
|
3 baths 3 beds |
show details | |

|
#44
Spring Rd NW
Washington, DC 20010
|
1,280 sq. feet
|
1 baths 3 beds |
show details | |

|
#45
Clifton St NW
Washington, DC 20009
|
3,131 sq. feet
|
2 baths 5 beds |
show details | |

|
#46
E Beech Rd
Sterling, VA 20164
|
1,911 sq. feet
|
3 baths 5 beds |
show details | |

|
#47
Irving St NW
Washington, DC 20010
|
1,088 sq. feet
|
1 baths 3 beds |
show details | |

|
#48
Crescent Park Dr
Reston, VA 20190
|
1,076 sq. feet
|
2 baths 2 beds |
show details | |

|
#49
Asbury Pl NW
Washington, DC 20016
|
1,813 sq. feet
|
3 baths 4 beds |
show details | |

|
Check over 1 million property listings on Foreclosure.com!
|
browse all offers | |||


 | Gaitherburg - townhouses, sfh's, and future 'mixed-use' (9 replies) |
| Rockville area - safety questions for specific area/apartments (11 replies) |
| Washington Grove (7 replies) |
| Moving to North Beach, MD. Commute on 820 Bus? (11 replies) |
| ******Gaithersburg Development Thread****** (235 replies) |
| MoCo, Question about certain "bad" areas... (27 replies) |

Household type by relationship:
Households: 601- Male householders: 192 (85 living alone), Female householders: 91 (51 living alone)
123 spouses (121 opposite-sex spouses), 8 unmarried partners, (7 opposite-sex unmarried partners), 101 children (98 natural, 0 adopted, 2 stepchildren), 14 grandchildren, 6 brothers or sisters, 5 parents, 0 foster children, 46 other relatives, 8 non-relatives
Size of family households: 69 2-persons, 24 3-persons, 25 4-persons, 11 5-persons, 7 6-persons.
Size of nonfamily households: 156 1-person, 5 2-persons.
46 married couples with children.
1 single-parent households (1 men, 0 women).
85.9% of residents of Washington Grove speak English at home.
3.8% of residents speak Spanish at home (91% speak English very well, 9% speak English not well).
8.6% of residents speak other Indo-European language at home (94% speak English very well, 6% speak English well).
Foreign born population: 89 (14.8%)
(83.1% of them are naturalized citizens)
| Here: | 7.8 |
| State: | 7.3 |
| Here: | -666666666.0 |
| State: | 4.2 |

- Bedrooms in owner-occupied houses and condos in Washington Grove, Maryland
- 0no bedroom
- 131 bedroom
- 352 bedrooms
- 1403 bedrooms
- 684 bedrooms
- 205+ bedrooms

- Bedrooms in renter-occupied apartments in Washington Grove, Maryland
- 0no bedroom
- 01 bedroom
- 02 bedrooms
- 23 bedrooms
- 04 bedrooms
- 115+ bedrooms

- Cars and other vehicles available in Washington Grove in owner-occupied houses/condos
- 4no vehicle
- 1491 vehicle
- 822 vehicles
- 293 vehicles
- 114 vehicles
- 05+ vehicles

- Cars and other vehicles available in Washington Grove in renter-occupied apartments
- 0no vehicle
- 21 vehicle
- 112 vehicles
- 03 vehicles
- 04 vehicles
- 05+ vehicles

- Rooms in owner-occupied houses in Washington Grove, Maryland
- 01 room
- 02 rooms
- 23 rooms
- 124 rooms
- 395 rooms
- 236 rooms
- 317 rooms
- 848 rooms
- 849+ rooms

- Rooms in renter-occupied apartments in Washington Grove, Maryland
- 01 room
- 02 rooms
- 03 rooms
- 04 rooms
- 05 rooms
- 26 rooms
- 07 rooms
- 08 rooms
- 119+ rooms


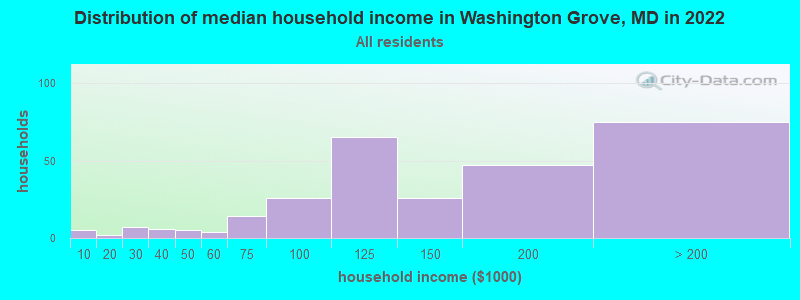
Washington Grove, MD household income distribution

- 5Less than $10,000
- 2$10,000 to $19,999
- 7$20,000 to $29,999
- 6$30,000 to $39,999
- 5$40,000 to $49,999
- 4$50,000 to $59,999
- 14$60,000 to $74,999
- 26$75,000 to $99,999
- 65$100,000 to $124,999
- 26$125,000 to $149,999
- 47$150,000 to $199,999
- 75$200,000 or more
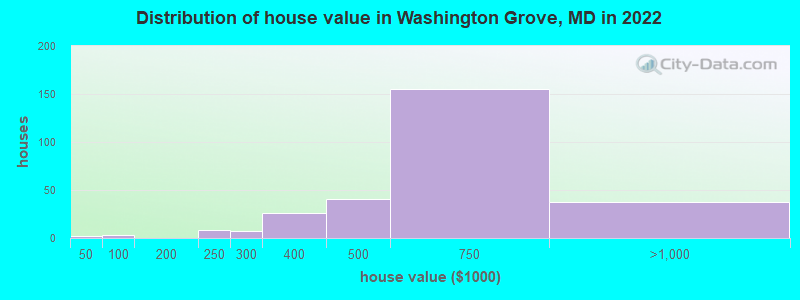
Home value of owner - occupied houses in 2022 in Washington Grove, MD
-
- 2Less than $10,000
- 3$60,000 to $69,999
- 8$200,000 to $249,999
- 6$250,000 to $299,999
- 25$300,000 to $399,999
- 41$400,000 to $499,999
- 154$500,000 to $749,999
- 35$750,000 to $999,999
- 2$1,000,000 to $1,499,999
Rent paid by renters in 2022 in Washington Grove, MD
-
- 2$1,500 to $1,999
- 9$2,000 to $2,499


Percentage of workers working in this county: 81.1%
Number of people working at home: 96 (25.9% of all workers)
Travel time to work (commute)
- Less than 5 minutes: 0
- 5 to 9 minutes: 53
- 10 to 14 minutes: 33
- 15 to 19 minutes: 37
- 20 to 24 minutes: 20
- 25 to 29 minutes: 3
- 30 to 34 minutes: 35
- 35 to 39 minutes: 10
- 40 to 44 minutes: 9
- 45 to 59 minutes: 46
- 60 to 89 minutes: 17
- 90 or more minutes: 6
Means of transportation to work:
- Drove a car alone: 167 (61.4%)
- Carpooled: 20 (7.4%)
- Bus or trolley bus: 1 (0.4%)
- Subway or elevated: 37 (13.6%)
- Railroad: 26 (9.6%)
- Walked: 3 (1.1%)
- Worked at home: 18 (6.6%)

- Unemployment by race in 2022
- Unemployment rate for White non-Hispanic residents
- 4.1%Males
- 1.1%Females

- Year of entry for the foreign-born population in Washington Grove, Maryland
- 222010 or later
- 252000 to 2009
- 71990 to 1999
- 131980 to 1989
- 31970 to 1979
- 15Before 1970
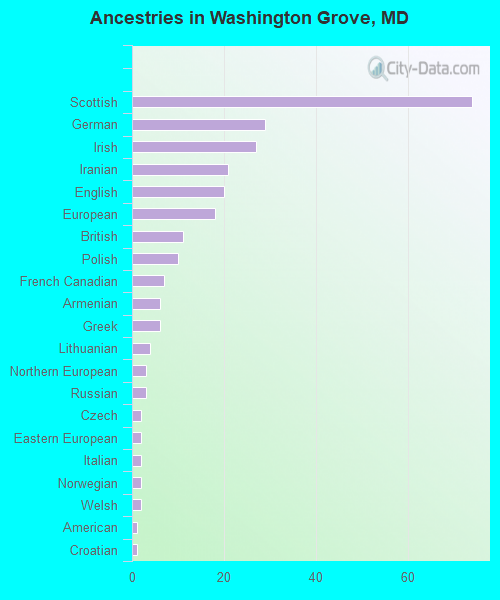
First ancestries reported:
- Scottish: 74 (21.8%)
- German: 29 (8.6%)
- Irish: 27 (8.0%)
- Iranian: 21 (6.2%)
- English: 20 (5.9%)
- European: 18 (5.3%)
- British: 11 (3.2%)
- Polish: 10 (2.9%)
- French Canadian: 7 (2.1%)
- Armenian: 6 (1.8%)
- Greek: 6 (1.8%)
- Lithuanian: 4 (1.2%)
- Northern European: 3 (0.9%)
- Russian: 3 (0.9%)
- Czech: 2 (0.6%)
- Eastern European: 2 (0.6%)
- Italian: 2 (0.6%)
- Norwegian: 2 (0.6%)
- Welsh: 2 (0.6%)
- American: 1 (0.3%)
- Croatian: 1 (0.3%)
Most common places of birth for foreign-born residents (%):
| Washington Grove: | 51.7% (46) |
| Maryland: | 0.2% (1,861) |
| Washington Grove: | 24.7% (22) |
| Maryland: | 1.3% (12,074) |
| Washington Grove: | 15.7% (14) |
| Maryland: | 12.0% (115,412) |
| Washington Grove: | 7.9% (7) |
| Maryland: | 0.1% (1,206) |
| Washington Grove: | 6.7% (6) |
| Maryland: | 0.9% (8,603) |
| Washington Grove: | 5.6% (5) |
| Maryland: | 0.7% (6,724) |
| Washington Grove: | 3.4% (3) |
| Maryland: | 0.1% (738) |
| Washington Grove: | 3.4% (3) |
| Maryland: | 3.4% (32,635) |
| Washington Grove: | 2.2% (2) |
| Maryland: | 0.5% (4,995) |
Place of birth for U.S.-born residents:
- This state: 193
- Other state: 306
- Northeast: 138
- Midwest: 56
- South: 76
- West: 26
94.4% of Washington Grove residents lived in the same house 1 years ago.
Out of people who lived in different houses, 36.7% lived in this county.
Out of people who lived in different counties, 0.0% lived in Maryland.
| Washington Grove: | 94.4% |
| State average: | 88.5% |
Education attainment for males 25 years and older:
- No schooling: 0
- Nursery to 4th grade: 0
- 5th and 6th grade: 0
- 7th and 8th grade: 0
- 9th grade: 0
- 10th grade: 0
- 11th grade: 0
- 12th grade, no diploma: 1
- High school graduate (or equivalency): 70
- Less than 1 year of college: 14
- Some college more than 1 year, no degree: 13
- Associate degree: 2
- Bachelor's degree: 113
- Master's degree: 38
- Professional school degree: 12
- Doctorate degree: 37

Education attainment for females 25 years and older:
- No schooling: 0
- Nursery to 4th grade: 0
- 5th and 6th grade: 0
- 7th and 8th grade: 0
- 9th grade: 0
- 10th grade: 0
- 11th grade: 0
- 12th grade, no diploma: 0
- High school graduate (or equivalency): 10
- Less than 1 year of college: 20
- Some college more than 1 year, no degree: 13
- Associate degree: 9
- Bachelor's degree: 68
- Master's degree: 62
- Professional school degree: 8
- Doctorate degree: 7


Housing units in structures:
- One, detached: 309
- One, attached: 2
Housing units lacking complete kitchen facilities in 2022: 3.2%

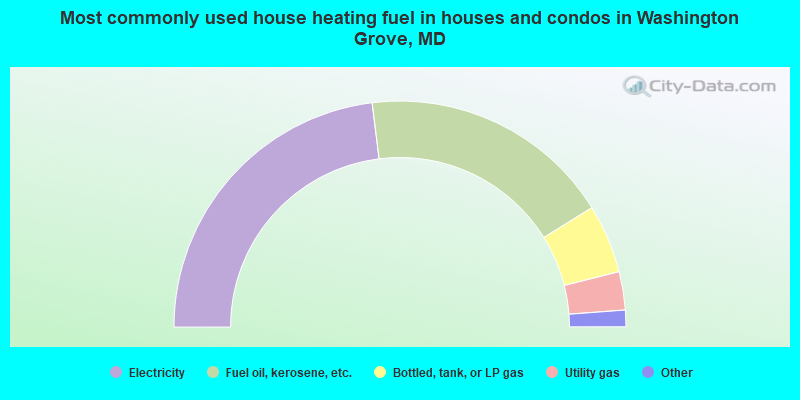
- 46.3%Electricity
- 36.4%Fuel oil, kerosene, etc.
- 9.9%Bottled, tank, or LP gas
- 5.5%Utility gas
- 1.1%Other fuel
- 0.7%Wood
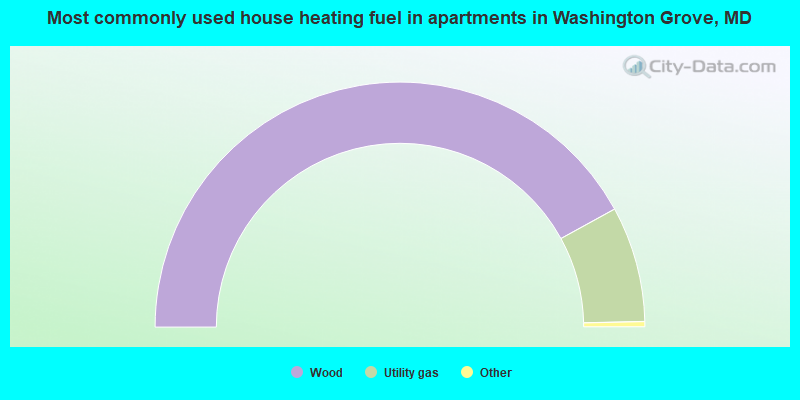
- 84.6%Wood
- 15.4%Utility gas
Private vs. public school enrollment:
| Here: | 0.0% |
| Maryland: | 15.2% |
| Here: | 0.0% |
| Maryland: | 14.4% |
| Here: | 18.8% |
| Maryland: | 20.2% |


