Waterbury, CT (Connecticut) Houses and Residents
| Waterbury: | $208,700 |
| Connecticut: | $347,200 |
Mean price in 2022:
Detached houses: $208,301
Here: $208,301 State: $503,946 Townhouses or other attached units: $131,400
Here: $131,400 State: $304,959 In 2-unit structures: $174,723
Here: $174,723 State: $304,133 In 3-to-4-unit structures: $184,037
Here: $184,037 State: $272,970 In 5-or-more-unit structures: $94,759
Here: $94,759 State: $249,308
Total population: 109,307 (Urban population: 107,271, Rural population: 0)
Houses: 46,201 (43,950 occupied: 19,092 owner occupied, 24,858 renter occupied)
| % of renters here: | 57% |
| State: | 34% |
Housing density: 1,617 houses/condos per square mile
Median price asked for vacant for-sale houses and condos in 2022: $243,256.
Median contract rent in 2022: $881 (lower quartile is $723, upper quartile is $1,071)
Median rent asked for vacant for-rent units in 2022: $856
Median gross rent in Waterbury, CT in 2022: $1,142
Housing units in Waterbury with a mortgage: 12,496 (1,314 second mortgage, 0 home equity loan, 750 both second mortgage and home equity loan)
Houses without a mortgage: 457
Median household income for houses/condos with a mortgage: $85,709
Median household income for apartments without a mortgage: $67,289
Median monthly housing costs: $1,227
Compare current foreclosures in Waterbury, CT:
| Photo | Address | Area | Beds / Baths | Price | Details |
|---|---|---|---|---|---|

|
#1
Janwood Rd
Waterbury, CT 06708
|
1,200 sq. feet
|
2 baths 3 beds |
$275,000
|
show details |

|
#2
Lockhart Ave
Waterbury, CT 06705
|
2,104 sq. feet
|
2 baths 3 beds |
show details | |

|
#3
Barbara Dr
Waterbury, CT 06705
|
1,248 sq. feet
|
2 baths 3 beds |
show details | |

|
#4
Calumet St
Waterbury, CT 06710
|
2,175 sq. feet
|
2 baths 4 beds |
show details | |

|
#5
Clairmont Ave
Waterbury, CT 06708
|
1,564 sq. feet
|
2 baths 4 beds |
show details | |

|
#6
Fairfield Ave
Waterbury, CT 06708
|
1,538 sq. feet
|
1 baths 2 beds |
show details | |

|
#7
Doran St
Waterbury, CT 06704
|
1,036 sq. feet
|
1 baths 3 beds |
show details | |

|
#8
Sylvan Ave
Waterbury, CT 06706
|
1,350 sq. feet
|
1 baths 4 beds |
show details | |

|
#9
Rockland Ave
Waterbury, CT 06708
|
1,200 sq. feet
|
2 baths 3 beds |
show details | |

|
#10
Atwood Ave
Waterbury, CT 06705
|
858 sq. feet
|
1 baths 3 beds |
show details |
| Photo | Address | Area | Beds / Baths | Price | Details |
|---|---|---|---|---|---|

|
#11
Blackman Rd
Waterbury, CT 06704
|
1,280 sq. feet
|
1 baths 3 beds |
show details | |

|
#12
Heritage Dr
Waterbury, CT 06708
|
1,288 sq. feet
|
1 baths 3 beds |
show details | |

|
#13
Hinsdale Ave
Waterbury, CT 06705
|
1,196 sq. feet
|
1 baths 2 beds |
show details | |

|
#14
Greystone Rd
Waterbury, CT 06704
|
1,252 sq. feet
|
1 baths 3 beds |
show details | |

|
#15
N Main St
Waterbury, CT 06704
|
1,300 sq. feet
|
1 baths 3 beds |
show details | |

|
#16
Roland St
Waterbury, CT 06706
|
1,200 sq. feet
|
1 baths 2 beds |
show details | |

|
#17
N Beacon St
Waterbury, CT 06704
|
1,603 sq. feet
|
2 baths 3 beds |
show details | |

|
#18
Cooke St
Waterbury, CT 06710
|
1,545 sq. feet
|
2 baths 3 beds |
show details | |

|
#19
Carmel St
Waterbury, CT 06704
|
1,533 sq. feet
|
2 baths 3 beds |
show details | |

|
#20
Orange St
Waterbury, CT 06704
|
1,122 sq. feet
|
1 baths 3 beds |
show details |
| Photo | Address | Area | Beds / Baths | Price | Details |
|---|---|---|---|---|---|

|
#21
Quentin St
Waterbury, CT 06706
|
1,512 sq. feet
|
1 baths 2 beds |
show details | |

|
#22
Courtland Ave
Waterbury, CT 06705
|
1,020 sq. feet
|
1 baths 3 beds |
show details | |

|
#23
Belmont Ave
Waterbury, CT 06708
|
1,384 sq. feet
|
2 baths 3 beds |
show details | |

|
#24
N Main St
Waterbury, CT 06704
|
912 sq. feet
|
1 baths 3 beds |
show details | |

|
#25
Sheffield St
Waterbury, CT 06704
|
2,112 sq. feet
|
2 baths 6 beds |
show details | |

|
#26
Fairfield Ave
Waterbury, CT 06708
|
1,152 sq. feet
|
1 baths 3 beds |
show details | |

|
#27
Fern Cir
Waterbury, CT 06708
|
2,280 sq. feet
|
2 baths 3 beds |
show details | |

|
#28
Essex Ave
Waterbury, CT 06704
|
1,428 sq. feet
|
1 baths 2 beds |
show details | |

|
#29
Oakville Ave
Waterbury, CT 06708
|
1,152 sq. feet
|
1 baths 3 beds |
show details | |

|
#30
N Walnut St
Waterbury, CT 06704
|
1,404 sq. feet
|
1 baths 2 beds |
show details |
| Photo | Address | Area | Beds / Baths | Price | Details |
|---|---|---|---|---|---|

|
#31
Rockaway Ave
Waterbury, CT 06705
|
1,596 sq. feet
|
2 baths 6 beds |
show details | |

|
#32
Congress Ave
Waterbury, CT 06708
|
1,355 sq. feet
|
2 baths 3 beds |
show details | |

|
#33
Venice Ave
Waterbury, CT 06708
|
1,632 sq. feet
|
2 baths 4 beds |
show details | |

|
#34
Alexander Ave
Waterbury, CT 06705
|
1,203 sq. feet
|
1 baths 3 beds |
show details | |

|
#35
Draher Ave # 3
Waterbury, CT 06708
|
3,467 sq. feet
|
3 baths 9 beds |
show details | |

|
#36
Wheeler St
Waterbury, CT 06704
|
1,646 sq. feet
|
1 baths 3 beds |
show details | |

|
#37
Rockledge Dr
Waterbury, CT 06706
|
1,080 sq. feet
|
1 baths 3 beds |
show details | |

|
#38
Tree Hill Rd
Waterbury, CT 06708
|
960 sq. feet
|
1 baths 3 beds |
show details | |

|
#39
Westport Dr
Waterbury, CT 06706
|
1,647 sq. feet
|
1 baths 3 beds |
show details | |

|
#40
Delaware Ave
Waterbury, CT 06708
|
1,450 sq. feet
|
1 baths 2 beds |
show details |
| Photo | Address | Area | Beds / Baths | Price | Details |
|---|---|---|---|---|---|

|
#41
Lockhart Ave
Waterbury, CT 06705
|
1,224 sq. feet
|
1 baths 3 beds |
show details | |

|
#42
Transit St
Waterbury, CT 06704
|
1,132 sq. feet
|
2 baths 3 beds |
show details | |

|
#43
Highland Ave Unit 33a
Waterbury, CT 06708
|
1,480 sq. feet
|
1 baths 2 beds |
show details | |

|
#44
Hamilton Ave Unit 7
Waterbury, CT 06706
|
1,056 sq. feet
|
1 baths 2 beds |
show details | |

|
#45
Clough Rd
Waterbury, CT 06708
|
1,039 sq. feet
|
1 baths 2 beds |
show details | |

|
#46
Joy Rd
Waterbury, CT 06708
|
1,650 sq. feet
|
1 baths 4 beds |
show details | |

|
#47
Robinwood Rd
Waterbury, CT 06708
|
988 sq. feet
|
1 baths 2 beds |
show details | |

|
#48
Summer St
Waterbury, CT 06704
|
2,762 sq. feet
|
3 baths 6 beds |
show details | |

|
#49
Woodtick Rd
Waterbury, CT 06705
|
1,592 sq. feet
|
2 baths 3 beds |
show details | |

|
Check over 1 million property listings on Foreclosure.com!
|
browse all offers | |||

Latest news about housing in Waterbury, CT collected exclusively by city-data.com from local newspapers, TV, and radio stations


Median year apartment built: 1961
Household type by relationship:
Households: 115,009- Male householders: 15,856 (4,360 living alone), Female householders: 28,094 (8,085 living alone)
13,904 spouses (13,844 opposite-sex spouses), 4,710 unmarried partners, (4,710 opposite-sex unmarried partners), 35,715 children (32,734 natural, 2,334 adopted, 647 stepchildren), 2,117 grandchildren, 2,552 brothers or sisters, 3,363 parents, 670 foster children, 2,750 other relatives, 3,755 non-relatives
- In group quarters: 1,523
Size of family households: 10,602 2-persons, 6,505 3-persons, 7,012 4-persons, 2,128 5-persons, 1,061 6-persons, 1,274 7-or-more-persons.
Size of nonfamily households: 12,445 1-person, 2,188 2-persons, 424 3-persons, 311 4-persons.
10,193 married couples with children.
12,523 single-parent households (2,232 men, 10,291 women).
62.5% of residents of Waterbury speak English at home.
28.9% of residents speak Spanish at home (60% speak English very well, 17% speak English well, 16% speak English not well, 7% don't speak English at all).
6.9% of residents speak other Indo-European language at home (65% speak English very well, 20% speak English well, 10% speak English not well, 5% don't speak English at all).
1.0% of residents speak Asian or Pacific Island language at home (43% speak English very well, 36% speak English well, 12% speak English not well, 9% don't speak English at all).
1.6% of residents speak other language at home (86% speak English very well, 8% speak English well, 6% speak English not well).
Foreign born population: 21,845 (19.0%)
(43.3% of them are naturalized citizens)
| Here: | 5.9 |
| State: | 6.5 |
| Here: | 4.4 |
| State: | 4.0 |

- Bedrooms in owner-occupied houses and condos in Waterbury, Connecticut
- 0no bedroom
- 3511 bedroom
- 4,3262 bedrooms
- 9,8583 bedrooms
- 3,2914 bedrooms
- 1,2665+ bedrooms

- Bedrooms in renter-occupied apartments in Waterbury, Connecticut
- 1,217no bedroom
- 5,4611 bedroom
- 9,9542 bedrooms
- 6,7263 bedrooms
- 1,5004 bedrooms
- 05+ bedrooms

- Cars and other vehicles available in Waterbury in owner-occupied houses/condos
- 957no vehicle
- 6,3441 vehicle
- 7,1902 vehicles
- 2,9503 vehicles
- 1,3304 vehicles
- 3215+ vehicles

- Cars and other vehicles available in Waterbury in renter-occupied apartments
- 7,879no vehicle
- 10,5031 vehicle
- 6,1172 vehicles
- 2963 vehicles
- 634 vehicles
- 05+ vehicles

- Rooms in owner-occupied houses in Waterbury, Connecticut
- 01 room
- 1342 rooms
- 2363 rooms
- 1,6804 rooms
- 5,1295 rooms
- 5,3806 rooms
- 2,9867 rooms
- 1,5638 rooms
- 1,9849+ rooms

- Rooms in renter-occupied apartments in Waterbury, Connecticut
- 1,2171 room
- 1,4212 rooms
- 3,2093 rooms
- 7,6914 rooms
- 6,1715 rooms
- 3,1396 rooms
- 1,2747 rooms
- 3088 rooms
- 4289+ rooms


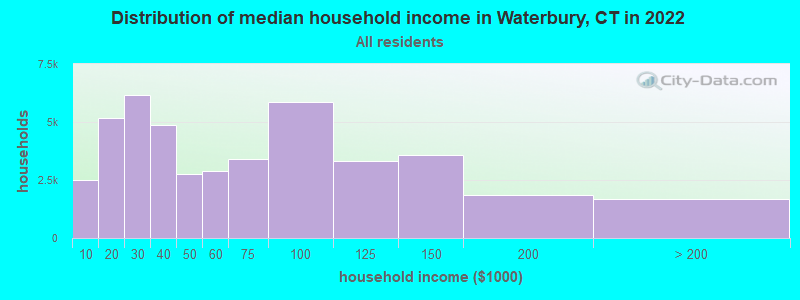
Waterbury, CT household income distribution

- 2,496Less than $10,000
- 5,188$10,000 to $19,999
- 6,154$20,000 to $29,999
- 4,861$30,000 to $39,999
- 2,771$40,000 to $49,999
- 2,873$50,000 to $59,999
- 3,389$60,000 to $74,999
- 5,844$75,000 to $99,999
- 3,317$100,000 to $124,999
- 3,563$125,000 to $149,999
- 1,834$150,000 to $199,999
- 1,660$200,000 or more
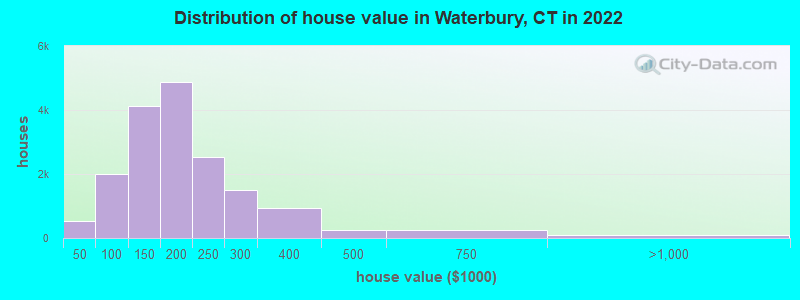
Home value of owner - occupied houses in 2022 in Waterbury, CT
-
- 144Less than $10,000
- 77$10,000 to $14,999
- 27$15,000 to $19,999
- 36$20,000 to $24,999
- 4$25,000 to $29,999
- 18$30,000 to $34,999
- 34$35,000 to $39,999
- 189$40,000 to $49,999
- 235$50,000 to $59,999
- 263$60,000 to $69,999
- 241$70,000 to $79,999
- 568$80,000 to $89,999
- 510$90,000 to $99,999
- 2,290$100,000 to $124,999
- 1,849$125,000 to $149,999
- 2,937$150,000 to $174,999
- 1,942$175,000 to $199,999
- 2,533$200,000 to $249,999
- 1,489$250,000 to $299,999
- 939$300,000 to $399,999
- 244$400,000 to $499,999
- 246$500,000 to $749,999
- 52$750,000 to $999,999
- 12$1,000,000 to $1,499,999
- 4$1,500,000 to $1,999,999
- 20$2,000,000 or more
Rent paid by renters in 2022 in Waterbury, CT
-
- 214Less than $100
- 859$100 to $149
- 557$150 to $199
- 160$200 to $249
- 94$250 to $299
- 507$300 to $349
- 297$350 to $399
- 130$400 to $449
- 147$450 to $499
- 194$500 to $549
- 798$550 to $599
- 225$600 to $649
- 827$650 to $699
- 1,846$700 to $749
- 1,497$750 to $799
- 4,169$800 to $899
- 3,626$900 to $999
- 5,165$1,000 to $1,249
- 998$1,250 to $1,499
- 1,128$1,500 to $1,999
- 40$2,000 to $2,499
- 1,380No cash rent


Percentage of workers working in this county: 67.0%
Number of people working at home: 3,435 (7.2% of all workers)
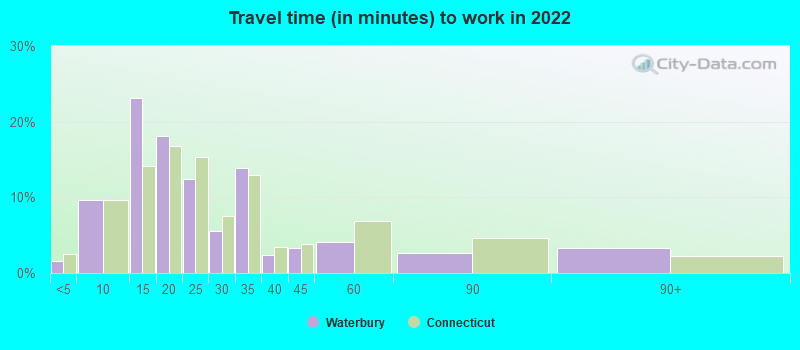
Travel time to work (commute)
- Less than 5 minutes: 859
- 5 to 9 minutes: 3,345
- 10 to 14 minutes: 7,836
- 15 to 19 minutes: 7,552
- 20 to 24 minutes: 5,978
- 25 to 29 minutes: 1,460
- 30 to 34 minutes: 6,350
- 35 to 39 minutes: 789
- 40 to 44 minutes: 1,168
- 45 to 59 minutes: 2,822
- 60 to 89 minutes: 4,081
- 90 or more minutes: 2,085
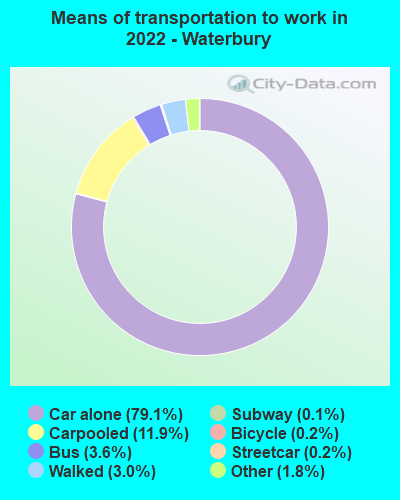
Means of transportation to work:
- Drove a car alone: 28,845 (69.6%)
- Carpooled: 4,605 (11.1%)
- Bus: 1,297 (3.1%)
- Subway or elevated rail: 152 (0.4%)
- Long-distance train or commuter rail: 33 (0.1%)
- Taxi: 818 (2.0%)
- Bicycle: 54 (0.1%)
- Walked: 1,173 (2.8%)
- Worked at home: 3,885 (9.4%)

- Unemployment by race in 2022
- Unemployment rate for White non-Hispanic residents
- 6.3%Males
- 3.0%Females
- Unemployment rate for Black residents
- 21.9%Males
- 10.2%Females
- Unemployment rate for American Indian and Alaska Native residents
- 16.8%Males
- Unemployment rate for Asian residents
- 9.3%Females
- Unemployment rate for other race residents
- 7.6%Males
- 4.0%Females
- Unemployment rate for two or more race residents
- 8.7%Males
- 11.7%Females
- Unemployment rate for Hispanic or Latino residents
- 8.7%Males
- 11.1%Females

- Year of entry for the foreign-born population in Waterbury, Connecticut
- 8,3862010 or later
- 5,5942000 to 2009
- 4,0871990 to 1999
- 2,7941980 to 1989
- 1,7041970 to 1979
- 3,310Before 1970

First ancestries reported:
- Italian: 5,546 (7.9%)
- Jamaican: 2,615 (3.7%)
- Albanian: 1,865 (2.7%)
- Irish: 1,833 (2.6%)
- Brazilian: 1,232 (1.8%)
- American: 1,053 (1.5%)
- Guyanese: 807 (1.2%)
- Portuguese: 792 (1.1%)
- West Indian: 713 (1.0%)
- French: 609 (0.9%)
- German: 571 (0.8%)
- Polish: 536 (0.8%)
- English: 529 (0.8%)
- Trinidadian and Tobagonian: 516 (0.7%)
- Nigerian: 455 (0.6%)
- African: 414 (0.6%)
- Cape Verdean: 400 (0.6%)
- Haitian: 391 (0.6%)
- Lithuanian: 291 (0.4%)
- British West Indian: 291 (0.4%)
- French Canadian: 286 (0.4%)
- European: 236 (0.3%)
- Russian: 211 (0.3%)
- Jordanian: 131 (0.2%)
- Israeli: 126 (0.2%)
- Canadian: 113 (0.2%)
- Estonian: 109 (0.2%)
- Afghan: 68 (0.10%)
- Ukrainian: 65 (0.09%)
- Scottish: 60 (0.09%)
- Bahamian: 58 (0.08%)
- Arab: 53 (0.08%)
- Ugandan: 49 (0.07%)
- Hungarian: 48 (0.07%)
- Lebanese: 45 (0.06%)
- Macedonian: 44 (0.06%)
- British: 40 (0.06%)
- Greek: 34 (0.05%)
- Finnish: 33 (0.05%)
- Barbadian: 32 (0.05%)
- Eastern European: 28 (0.04%)
- Turkish: 28 (0.04%)
- Swedish: 19 (0.03%)
- Palestinian: 17 (0.02%)
- Armenian: 17 (0.02%)
- Belgian: 17 (0.02%)
- Swiss: 17 (0.02%)
- Scandinavian: 14 (0.02%)
- Slovak: 14 (0.02%)
- Moroccan: 12 (0.02%)
- Cypriot: 11 (0.02%)
- Dutch West Indian: 10 (0.01%)
- Scotch-Irish: 8 (0.01%)
- Romanian: 8 (0.01%)
- Austrian: 7 (0.01%)
- Iranian: 6 (0.01%)
- U.S. Virgin Islander: 6 (0.01%)
- Dutch: 5 (0.01%)
- Croatian: 5 (0.01%)
Most common places of birth for foreign-born residents (%):
| Waterbury: | 20.7% (4,483) |
| Connecticut: | 5.0% (27,361) |
| Waterbury: | 10.3% (2,229) |
| Connecticut: | 7.5% (40,568) |
| Waterbury: | 6.5% (1,410) |
| Connecticut: | 1.0% (5,447) |
| Waterbury: | 6.1% (1,327) |
| Connecticut: | 4.7% (25,461) |
| Waterbury: | 5.2% (1,132) |
| Connecticut: | 4.4% (24,026) |
| Waterbury: | 4.2% (914) |
| Connecticut: | 0.2% (1,253) |
| Waterbury: | 3.7% (792) |
| Connecticut: | 3.2% (17,617) |
| Waterbury: | 3.4% (736) |
| Connecticut: | 0.9% (5,157) |
| Waterbury: | 3.4% (727) |
| Connecticut: | 1.3% (7,003) |
| Waterbury: | 2.7% (587) |
| Connecticut: | 2.8% (15,141) |
| Waterbury: | 2.5% (534) |
| Connecticut: | 1.3% (7,220) |
| Waterbury: | 2.5% (534) |
| Connecticut: | 1.7% (9,214) |
| Waterbury: | 2.4% (523) |
| Connecticut: | 7.3% (39,879) |
| Waterbury: | 2.2% (466) |
| Connecticut: | 3.3% (18,124) |
| Waterbury: | 2.1% (455) |
| Connecticut: | 4.8% (25,802) |
| Waterbury: | 1.7% (362) |
| Connecticut: | 2.4% (12,881) |
| Waterbury: | 1.6% (352) |
| Connecticut: | 0.2% (1,333) |
Place of birth for U.S.-born residents:
- This state: 55,168
- Other state: 22,756
- Northeast: 14,587
- Midwest: 497
- South: 5,615
- West: 2,057
88.1% of Waterbury residents lived in the same house 1 years ago.
Out of people who lived in different houses, 34.1% lived in this county.
Out of people who lived in different counties, 43.0% lived in Connecticut.
| Waterbury: | 88.1% |
| State average: | 88.4% |
Education attainment for males 25 years and older:
- No schooling: 2,421
- Nursery to 4th grade: 853
- 5th and 6th grade: 497
- 7th and 8th grade: 1,700
- 9th grade: 532
- 10th grade: 1,337
- 11th grade: 1,181
- 12th grade, no diploma: 807
- High school graduate (or equivalency): 13,489
- Less than 1 year of college: 2,162
- Some college more than 1 year, no degree: 2,891
- Associate degree: 2,459
- Bachelor's degree: 2,870
- Master's degree: 1,830
- Professional school degree: 266
- Doctorate degree: 90

Education attainment for females 25 years and older:
- No schooling: 1,872
- Nursery to 4th grade: 220
- 5th and 6th grade: 552
- 7th and 8th grade: 1,078
- 9th grade: 850
- 10th grade: 808
- 11th grade: 1,779
- 12th grade, no diploma: 1,067
- High school graduate (or equivalency): 13,124
- Less than 1 year of college: 3,787
- Some college more than 1 year, no degree: 5,277
- Associate degree: 5,458
- Bachelor's degree: 3,163
- Master's degree: 1,940
- Professional school degree: 308
- Doctorate degree: 242


Housing units in structures:
- One, detached: 19,509
- One, attached: 1,182
- Two: 6,710
- 3 or 4: 7,401
- 5 to 9: 5,019
- 10 to 19: 1,519
- 20 to 49: 1,265
- 50 or more: 3,596
Housing units lacking complete kitchen facilities in 2022: 1.2%
House/condo owner moved in on average 15 years ago
Renter moved in on average 4 years ago

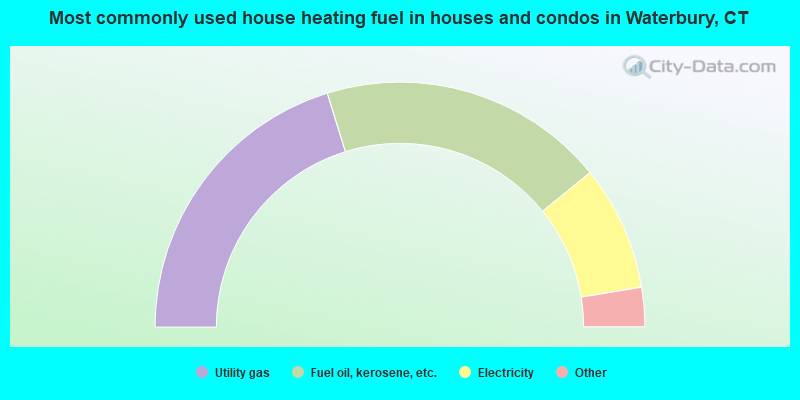
- 40.4%Utility gas
- 37.9%Fuel oil, kerosene, etc.
- 16.5%Electricity
- 3.3%Bottled, tank, or LP gas
- 1.4%Other fuel
- 0.4%Wood
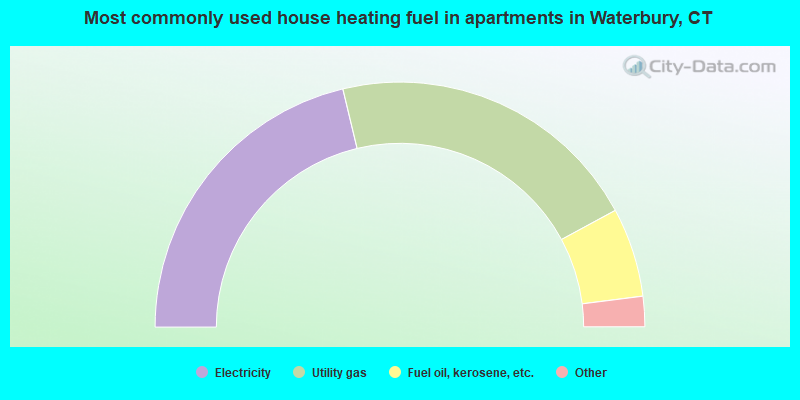
- 42.5%Electricity
- 41.7%Utility gas
- 11.8%Fuel oil, kerosene, etc.
- 2.4%Bottled, tank, or LP gas
- 1.1%No fuel used
- 0.4%Other fuel
Private vs. public school enrollment:
| Here: | 13.5% |
| Connecticut: | 9.5% |
| Here: | 5.7% |
| Connecticut: | 12.9% |
| Here: | 16.3% |
| Connecticut: | 35.5% |


