Waterford, PA (Pennsylvania) Houses and Residents
| Waterford: | $157,330 |
| Pennsylvania: | $245,500 |
Mean price in 2022:
Detached houses: $217,203
Here: $217,203 State: $317,202 Mobile homes: $52,366
Here: $52,366 State: $92,414
Total population: 1,543 (Urban population: 0, Rural population: 1,449 (8 farm, 1,441 nonfarm))
Houses: 641 (566 occupied: 279 owner occupied, 294 renter occupied)
| % of renters here: | 51% |
| State: | 31% |
Housing density: 526 houses/condos per square mile
Median price asked for vacant for-sale houses and condos in 2022 in this county: $121,180.
Median contract rent in 2022: $748 (lower quartile is $559, upper quartile is $922)
Median rent asked for vacant for-rent units in 2022: $1,986
Median gross rent in Waterford, PA in 2022: $904
Housing units in Waterford with a mortgage: 132 (17 second mortgage, 0 home equity loan, 16 both second mortgage and home equity loan)
Houses without a mortgage: 8
Median household income for houses/condos with a mortgage: $79,446
Median household income for apartments without a mortgage: $41,304
Median monthly housing costs: $831
Compare current foreclosures near Waterford, PA:
| Photo | Address | Area | Beds / Baths | Price | Details |
|---|---|---|---|---|---|

|
#1
Hill Rd
Waterford, PA 16441
|
2,308 sq. feet
|
2 baths 5 beds |
show details | |

|
#2
Dorn Rd
Waterford, PA 16441
|
1,560 sq. feet
|
2 baths 3 beds |
show details | |

|
#3
Route 6
Waterford, PA 16441
|
1,440 sq. feet
|
1 baths 2 beds |
show details | |

|
#4
Barton Rd
Waterford, PA 16441
|
- sq. feet
|
3 baths 4 beds |
show details | |

|
#5
Mackey Hill Rd
Waterford, PA 16441
|
1,337 sq. feet
|
1 baths 3 beds |
show details | |

|
#6
Route 97 N
Waterford, PA 16441
|
1,140 sq. feet
|
- baths - beds |
show details | |

|
#7
Willy Rd
Waterford, PA 16441
|
- sq. feet
|
- baths - beds |
show details | |

|
#8
Dutchtown Rd
Waterford, PA 16441
|
1,140 sq. feet
|
- baths - beds |
show details | |

|
#9
E 33rd St
Erie, PA 16504
|
912 sq. feet
|
1 baths 2 beds |
$34,900
|
show details |

|
#10
Conrad Rd
Erie, PA 16510
|
1,460 sq. feet
|
1 baths 3 beds |
show details |
| Photo | Address | Area | Beds / Baths | Price | Details |
|---|---|---|---|---|---|

|
#11
Sierra Dr
Erie, PA 16506
|
1,980 sq. feet
|
1 baths 3 beds |
show details | |

|
#12
Old French Rd
Erie, PA 16509
|
1,788 sq. feet
|
3 baths 5 beds |
show details | |

|
#13
Cascade St
Erie, PA 16502
|
1,452 sq. feet
|
2 baths 3 beds |
show details | |

|
#14
E 40th St
Erie, PA 16510
|
1,176 sq. feet
|
1 baths 3 beds |
show details | |

|
#15
W 37th St
Erie, PA 16508
|
2,304 sq. feet
|
2 baths 3 beds |
show details | |

|
#16
East Ave
Erie, PA 16504
|
1,261 sq. feet
|
1 baths 2 beds |
show details | |

|
#17
W 32nd St
Erie, PA 16508
|
1,280 sq. feet
|
2 baths 3 beds |
show details | |

|
#18
Polk St
Erie, PA 16503
|
504 sq. feet
|
1 baths 2 beds |
show details | |

|
#19
Evergreen Dr
Edinboro, PA 16412
|
1,388 sq. feet
|
3 baths 3 beds |
show details | |

|
#20
Glenwood Park Ave
Erie, PA 16508
|
1,162 sq. feet
|
1 baths 3 beds |
show details |
| Photo | Address | Area | Beds / Baths | Price | Details |
|---|---|---|---|---|---|

|
#21
E 19th St
Erie, PA 16503
|
- sq. feet
|
1 baths 2 beds |
show details | |

|
#22
Lake Pleasant Rd
Erie, PA 16504
|
1,370 sq. feet
|
1 baths 3 beds |
show details | |

|
#23
Fair Ave
Erie, PA 16511
|
1,704 sq. feet
|
2 baths 4 beds |
show details | |

|
#24
Curtze Dr
Fairview, PA 16415
|
988 sq. feet
|
1 baths 3 beds |
show details | |

|
#25
Downing Ave
Erie, PA 16510
|
1,902 sq. feet
|
1 baths 5 beds |
show details | |

|
#26
Belle Rd
Harborcreek, PA 16421
|
2,145 sq. feet
|
2 baths 3 beds |
show details | |

|
#27
Downing Ave
Erie, PA 16510
|
1,530 sq. feet
|
1 baths 3 beds |
show details | |

|
#28
W 25th St
Erie, PA 16506
|
1,316 sq. feet
|
1 baths 3 beds |
show details | |

|
#29
Homer Ave
Erie, PA 16506
|
998 sq. feet
|
1 baths 3 beds |
show details | |

|
#30
Homer Ave
Erie, PA 16506
|
998 sq. feet
|
1 baths 3 beds |
show details |
| Photo | Address | Area | Beds / Baths | Price | Details |
|---|---|---|---|---|---|

|
#31
Raspberry St
Erie, PA 16502
|
1,288 sq. feet
|
2 baths 4 beds |
show details | |

|
#32
W 22nd St
Erie, PA 16502
|
1,956 sq. feet
|
1 baths 4 beds |
show details | |

|
#33
E 23rd St
Erie, PA 16503
|
1,344 sq. feet
|
1 baths 3 beds |
show details | |

|
#34
E 24th St
Erie, PA 16503
|
1,635 sq. feet
|
1 baths 3 beds |
show details | |

|
#35
Cherry Blossom Dr
Erie, PA 16510
|
2,028 sq. feet
|
2 baths 5 beds |
show details | |

|
#36
W 23rd St
Erie, PA 16506
|
912 sq. feet
|
1 baths 3 beds |
show details | |

|
#37
W 21st St
Erie, PA 16502
|
1,052 sq. feet
|
1 baths 3 beds |
show details | |

|
#38
Geist Rd
Erie, PA 16502
|
840 sq. feet
|
1 baths 2 beds |
show details | |

|
#39
Plum St
Erie, PA 16502
|
2,044 sq. feet
|
2 baths 4 beds |
show details | |

|
#40
E 26th St
Erie, PA 16510
|
960 sq. feet
|
1 baths 3 beds |
show details |
| Photo | Address | Area | Beds / Baths | Price | Details |
|---|---|---|---|---|---|

|
#41
W 20th St
Erie, PA 16502
|
1,232 sq. feet
|
1 baths 3 beds |
show details | |

|
#42
Camphausen Ave
Erie, PA 16510
|
950 sq. feet
|
1 baths 2 beds |
show details | |

|
#43
Basswood Dr
Erie, PA 16506
|
2,367 sq. feet
|
2 baths 4 beds |
show details | |

|
#44
Contessa Ln
Erie, PA 16506
|
2,543 sq. feet
|
2 baths 4 beds |
show details | |

|
#45
Contessa Ln
Erie, PA 16506
|
2,543 sq. feet
|
2 baths 4 beds |
show details | |

|
#46
Colonial Ave
Erie, PA 16506
|
1,092 sq. feet
|
1 baths 3 beds |
show details | |

|
#47
W 18th St
Erie, PA 16502
|
1,232 sq. feet
|
1 baths 3 beds |
show details | |

|
#48
W 20th St
Erie, PA 16502
|
1,320 sq. feet
|
1 baths 3 beds |
show details | |

|
#49
Ashton Rd
North East, PA 16428
|
1,464 sq. feet
|
1 baths 3 beds |
show details | |

|
Check over 1 million property listings on Foreclosure.com!
|
browse all offers | |||

Latest news about housing in Waterford, PA collected exclusively by city-data.com from local newspapers, TV, and radio stations

 | Looking for apartment/home rental suggestions in south suburbs (5 replies) |
| Affordable "small" towns with beautiful houses and downtowns? (58 replies) |
| Granada apartments? (13 replies) |
| Moving to PA... Where would you live (rural areas only) ? (74 replies) |
| The drive-in holding on (8 replies) |
| Moving to Pittsburgh in July...need some help with apartments!!! (8 replies) |

Median year apartment built: 1989
Household type by relationship:
Households: 1,231- Male householders: 216 (73 living alone), Female householders: 342 (155 living alone)
264 spouses (264 opposite-sex spouses), 27 unmarried partners, (27 opposite-sex unmarried partners), 341 children (325 natural, 11 adopted, 3 stepchildren), 9 grandchildren, 0 brothers or sisters, 2 parents, 0 foster children, 9 other relatives, 15 non-relatives
Size of family households: 174 2-persons, 47 3-persons, 80 4-persons, 20 5-persons, 2 6-persons.
Size of nonfamily households: 238 1-person, 8 2-persons.
149 married couples with children.
97 single-parent households (21 men, 76 women).
96.7% of residents of Waterford speak English at home.
1.8% of residents speak Spanish at home (86% speak English very well, 14% speak English well).
0.8% of residents speak other Indo-European language at home (100% speak English very well).
Foreign born population: 2 (0.2%)
(50.0% of them are naturalized citizens)
| Here: | 6.6 |
| State: | 6.8 |
| Here: | 4.3 |
| State: | 4.3 |

- Bedrooms in owner-occupied houses and condos in Waterford, Pennsylvania
- 0no bedroom
- 71 bedroom
- 432 bedrooms
- 1773 bedrooms
- 364 bedrooms
- 175+ bedrooms

- Bedrooms in renter-occupied apartments in Waterford, Pennsylvania
- 19no bedroom
- 1041 bedroom
- 822 bedrooms
- 473 bedrooms
- 114 bedrooms
- 325+ bedrooms

- Cars and other vehicles available in Waterford in owner-occupied houses/condos
- 5no vehicle
- 1031 vehicle
- 1182 vehicles
- 443 vehicles
- 74 vehicles
- 35+ vehicles

- Cars and other vehicles available in Waterford in renter-occupied apartments
- 51no vehicle
- 1401 vehicle
- 732 vehicles
- 53 vehicles
- 254 vehicles
- 05+ vehicles

- Rooms in owner-occupied houses in Waterford, Pennsylvania
- 01 room
- 52 rooms
- 03 rooms
- 54 rooms
- 545 rooms
- 706 rooms
- 557 rooms
- 368 rooms
- 559+ rooms

- Rooms in renter-occupied apartments in Waterford, Pennsylvania
- 191 room
- 92 rooms
- 473 rooms
- 874 rooms
- 535 rooms
- 276 rooms
- 127 rooms
- 08 rooms
- 409+ rooms


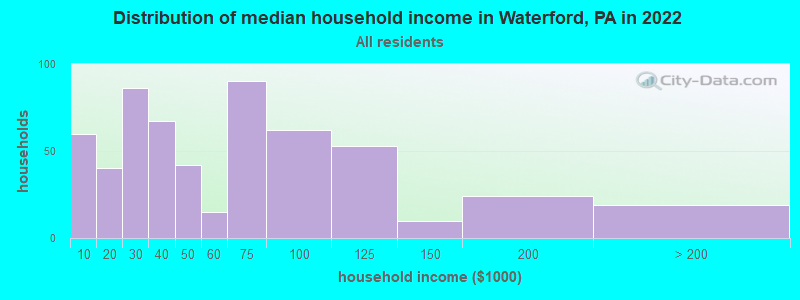
Waterford, PA household income distribution

- 60Less than $10,000
- 40$10,000 to $19,999
- 86$20,000 to $29,999
- 67$30,000 to $39,999
- 42$40,000 to $49,999
- 15$50,000 to $59,999
- 90$60,000 to $74,999
- 62$75,000 to $99,999
- 53$100,000 to $124,999
- 10$125,000 to $149,999
- 24$150,000 to $199,999
- 19$200,000 or more
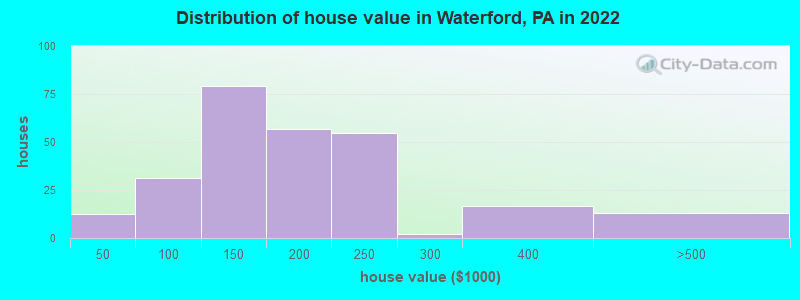
Home value of owner - occupied houses in 2022 in Waterford, PA
-
- 7Less than $10,000
- 2$10,000 to $14,999
- 2$25,000 to $29,999
- 4$70,000 to $79,999
- 5$80,000 to $89,999
- 21$90,000 to $99,999
- 47$100,000 to $124,999
- 32$125,000 to $149,999
- 41$150,000 to $174,999
- 15$175,000 to $199,999
- 54$200,000 to $249,999
- 2$250,000 to $299,999
- 16$300,000 to $399,999
- 13$400,000 to $499,999
Rent paid by renters in 2022 in Waterford, PA
-
- 10$150 to $199
- 6$200 to $249
- 3$250 to $299
- 1$350 to $399
- 9$400 to $449
- 19$450 to $499
- 9$500 to $549
- 15$550 to $599
- 18$600 to $649
- 20$650 to $699
- 11$700 to $749
- 19$750 to $799
- 37$800 to $899
- 29$900 to $999
- 42$1,000 to $1,249
- 14No cash rent


Percentage of workers working in this county: 89.2%
Number of people working at home: 46 (8.3% of all workers)
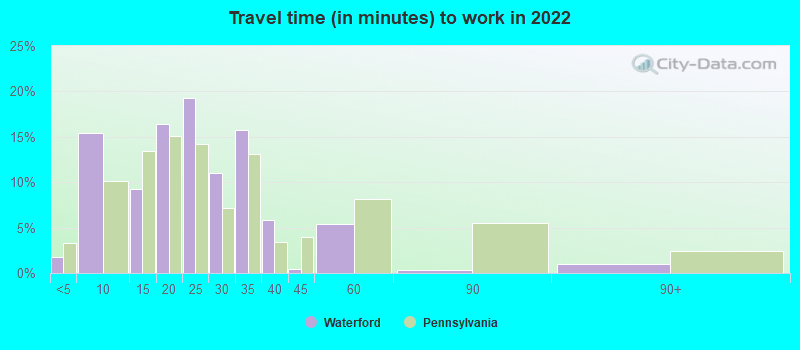
Travel time to work (commute)
- Less than 5 minutes: 32
- 5 to 9 minutes: 80
- 10 to 14 minutes: 16
- 15 to 19 minutes: 41
- 20 to 24 minutes: 64
- 25 to 29 minutes: 37
- 30 to 34 minutes: 143
- 35 to 39 minutes: 10
- 40 to 44 minutes: 7
- 45 to 59 minutes: 36
- 60 to 89 minutes: 7
- 90 or more minutes: 29
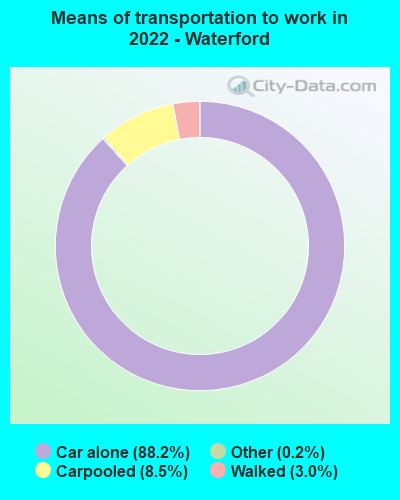
Means of transportation to work:
- Drove a car alone: 765 (82.4%)
- Carpooled: 78 (8.4%)
- Taxi: 3 (0.3%)
- Walked: 28 (3.0%)
- Worked at home: 46 (5.0%)

- Unemployment by race in 2022
- Unemployment rate for White non-Hispanic residents
- 2.6%Males
- 3.4%Females
- Unemployment rate for two or more race residents
- 33.6%Males
- Unemployment rate for Hispanic or Latino residents
- 57.0%Males

- Year of entry for the foreign-born population in Waterford, Pennsylvania
- 02010 or later
- 02000 to 2009
- 01990 to 1999
- 31980 to 1989
- 51970 to 1979
- 15Before 1970

First ancestries reported:
- German: 133 (26.1%)
- English: 67 (13.1%)
- Irish: 66 (12.9%)
- American: 39 (7.6%)
- European: 25 (4.9%)
- Italian: 21 (4.1%)
- Polish: 17 (3.3%)
- Danish: 13 (2.5%)
- Scottish: 11 (2.2%)
- Swedish: 6 (1.2%)
- Lithuanian: 4 (0.8%)
- Russian: 4 (0.8%)
- Slovak: 4 (0.8%)
- Greek: 3 (0.6%)
- British: 2 (0.4%)
- French: 2 (0.4%)
Most common places of birth for foreign-born residents (%):
| Waterford: | 100.0% (2) |
| Pennsylvania: | 0.2% (1,747) |
Place of birth for U.S.-born residents:
- This state: 979
- Other state: 220
- Northeast: 65
- Midwest: 54
- South: 54
- West: 46
91.9% of Waterford residents lived in the same house 1 years ago.
Out of people who lived in different houses, 42.1% lived in this county.
Out of people who lived in different counties, 0.0% lived in Pennsylvania.
| Waterford: | 91.9% |
| State average: | 89.3% |
Education attainment for males 25 years and older:
- No schooling: 1
- Nursery to 4th grade: 0
- 5th and 6th grade: 0
- 7th and 8th grade: 0
- 9th grade: 38
- 10th grade: 23
- 11th grade: 0
- 12th grade, no diploma: 8
- High school graduate (or equivalency): 172
- Less than 1 year of college: 10
- Some college more than 1 year, no degree: 47
- Associate degree: 17
- Bachelor's degree: 43
- Master's degree: 6
- Professional school degree: 2
- Doctorate degree: 3

Education attainment for females 25 years and older:
- No schooling: 1
- Nursery to 4th grade: 0
- 5th and 6th grade: 0
- 7th and 8th grade: 2
- 9th grade: 0
- 10th grade: 0
- 11th grade: 17
- 12th grade, no diploma: 4
- High school graduate (or equivalency): 201
- Less than 1 year of college: 38
- Some college more than 1 year, no degree: 29
- Associate degree: 87
- Bachelor's degree: 79
- Master's degree: 40
- Professional school degree: 10
- Doctorate degree: 0


Housing units in structures:
- One, detached: 394
- One, attached: 4
- Two: 38
- 3 or 4: 75
- 5 to 9: 36
- 10 to 19: 22
- 20 to 49: 55
- Mobile homes: 16
Housing units lacking complete kitchen facilities in 2022: 5.5%
House/condo owner moved in on average 19 years ago
Renter moved in on average 5 years ago

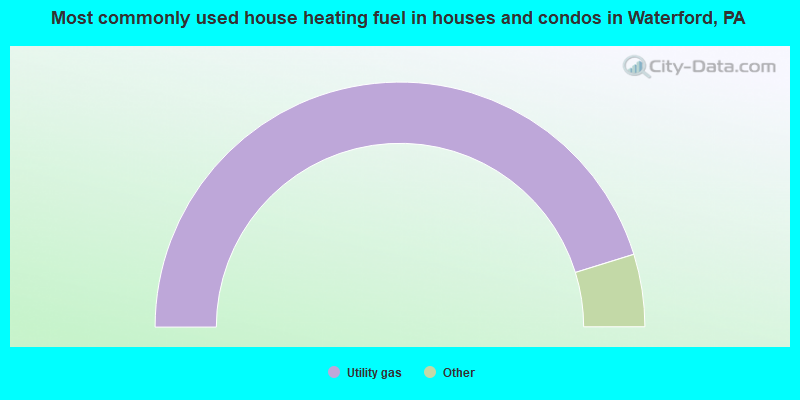
- 90.5%Utility gas
- 3.3%Fuel oil, kerosene, etc.
- 2.9%Electricity
- 1.8%Bottled, tank, or LP gas
- 1.5%Wood
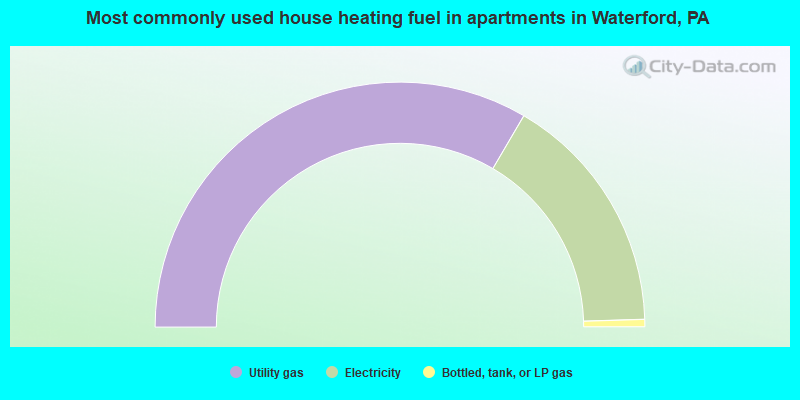
- 66.9%Utility gas
- 32.1%Electricity
- 1.0%Bottled, tank, or LP gas
Private vs. public school enrollment:
| Here: | 3.3% |
| Pennsylvania: | 15.7% |
| Here: | 0.0% |
| Pennsylvania: | 13.4% |
| Here: | 39.3% |
| Pennsylvania: | 39.8% |


