Waterman, IL (Illinois) Houses and Residents
| Waterman: | $201,914 |
| Illinois: | $251,600 |
Mean price in 2022:
Detached houses: $209,430
Here: $209,430 State: $310,164 Townhouses or other attached units: $144,638
Here: $144,638 State: $286,230 In 2-unit structures: $263,307
Here: $263,307 State: $299,638 Mobile homes: $22,682
Here: $22,682 State: $78,855
Total population: 1,503 (Urban population: 0, Rural population: 1,219 (8 farm, 1,211 nonfarm))
Houses: 536 (519 occupied: 429 owner occupied, 86 renter occupied)
| % of renters here: | 17% |
| State: | 33% |
Housing density: 535 houses/condos per square mile
Median price asked for vacant for-sale houses and condos in 2022 in this county: $178,377.
Median contract rent in 2022: $701 (lower quartile is $615, upper quartile is $780)
Median rent asked for vacant for-rent units in 2022: $595
Median gross rent in Waterman, IL in 2022: $758
Housing units in Waterman with a mortgage: 309 (23 second mortgage, 0 home equity loan, 13 both second mortgage and home equity loan)
Houses without a mortgage: 8
Median household income for houses/condos with a mortgage: $103,780
Median household income for apartments without a mortgage: $71,773
Median monthly housing costs: $1,223
Compare current foreclosures near Waterman, IL:
| Photo | Address | Area | Beds / Baths | Price | Details |
|---|---|---|---|---|---|

|
#1
N Birch St
Waterman, IL 60556
|
- sq. feet
|
- baths - beds |
show details | |

|
#2
Leonard Ave
Dekalb, IL 60115
|
1,295 sq. feet
|
2 baths 3 beds |
$245,000
|
show details |

|
#3
W Fuller Dr
Waterman, IL 60556
|
- sq. feet
|
- baths - beds |
show details | |

|
#4
Big Rock Ave
Plano, IL 60545
|
2,021 sq. feet
|
2 baths 3 beds |
show details | |

|
#5
N Wolfe St
Sandwich, IL 60548
|
1,120 sq. feet
|
1 baths 3 beds |
show details | |

|
#6
S Peace Rd
Sycamore, IL 60178
|
763 sq. feet
|
1 baths 2 beds |
show details | |

|
#7
Kristen Ct
Plano, IL 60545
|
2,500 sq. feet
|
3 baths 4 beds |
show details | |

|
#8
Tamaira St
Plano, IL 60545
|
2,072 sq. feet
|
2 baths 4 beds |
show details | |

|
#9
S Cherry St
Somonauk, IL 60552
|
- sq. feet
|
2 baths 3 beds |
show details | |

|
#10
Easy St
Sycamore, IL 60178
|
- sq. feet
|
1 baths 4 beds |
show details |
| Photo | Address | Area | Beds / Baths | Price | Details |
|---|---|---|---|---|---|

|
#11
Tilton Park Dr
Dekalb, IL 60115
|
1,400 sq. feet
|
1 baths 3 beds |
show details | |

|
#12
Clark St
Dekalb, IL 60115
|
1,105 sq. feet
|
2 baths 2 beds |
show details | |

|
#13
S Inverness St
Maple Park, IL 60151
|
- sq. feet
|
- baths - beds |
show details | |

|
#14
Williams Way
Dekalb, IL 60115
|
- sq. feet
|
- baths - beds |
show details | |

|
#15
Eves Cir W
Dekalb, IL 60115
|
- sq. feet
|
- baths - beds |
show details | |

|
#16
Eves Cir E
Dekalb, IL 60115
|
- sq. feet
|
- baths - beds |
show details | |

|
#17
N 46th Rd
Somonauk, IL 60552
|
- sq. feet
|
- baths - beds |
show details | |

|
#18
Ridge Dr Apt 705
Dekalb, IL 60115
|
- sq. feet
|
- baths - beds |
show details | |

|
#19
N 1st St Apt 3
Dekalb, IL 60115
|
- sq. feet
|
- baths - beds |
show details | |

|
#20
Ridge Dr Apt 4
Dekalb, IL 60115
|
- sq. feet
|
- baths - beds |
show details |
| Photo | Address | Area | Beds / Baths | Price | Details |
|---|---|---|---|---|---|

|
#21
E 6th St
Sandwich, IL 60548
|
- sq. feet
|
- baths - beds |
show details | |

|
#22
Aspen Ct, Apt 3
Dekalb, IL 60115
|
- sq. feet
|
- baths - beds |
show details | |

|
#23
N Annie Glidden Rd Apt 225
Dekalb, IL 60115
|
- sq. feet
|
- baths - beds |
show details | |

|
#24
Regent Dr Apt 102
Dekalb, IL 60115
|
- sq. feet
|
- baths - beds |
show details | |

|
#25
N 46th Rd
Leland, IL 60531
|
- sq. feet
|
- baths - beds |
show details | |

|
#26
Katie Dr
Big Rock, IL 60511
|
- sq. feet
|
- baths - beds |
show details | |

|
#27
Kimberly Dr Apt 111
Dekalb, IL 60115
|
- sq. feet
|
- baths - beds |
show details | |

|
#28
N 5th St
Malta, IL 60150
|
- sq. feet
|
- baths - beds |
show details | |

|
#29
Wentworth Dr Apt 2
Sandwich, IL 60548
|
- sq. feet
|
- baths - beds |
show details | |

|
#30
W Hillcrest Dr
Dekalb, IL 60115
|
- sq. feet
|
- baths - beds |
show details |
| Photo | Address | Area | Beds / Baths | Price | Details |
|---|---|---|---|---|---|

|
#31
Regent Dr
Dekalb, IL 60115
|
- sq. feet
|
- baths - beds |
show details | |

|
#32
N 4645th Rd # B
Somonauk, IL 60552
|
- sq. feet
|
- baths - beds |
show details | |

|
#33
Settlement Dr
Maple Park, IL 60151
|
- sq. feet
|
- baths - beds |
show details | |

|
#34
Country Life Dr
Maple Park, IL 60151
|
- sq. feet
|
- baths - beds |
show details | |

|
#35
Dauberman Rd
Elburn, IL 60119
|
- sq. feet
|
- baths - beds |
show details | |

|
#36
W Railroad St
Earlville, IL 60518
|
- sq. feet
|
- baths - beds |
show details | |

|
#37
W Galena Blvd, Apt 211
Sugar Grove, IL 60554
|
- sq. feet
|
- baths - beds |
show details | |

|
#38
Carolyn Ct
Yorkville, IL 60560
|
- sq. feet
|
- baths - beds |
show details | |

|
#39
Maple St
Sugar Grove, IL 60554
|
- sq. feet
|
- baths - beds |
show details | |

|
#40
N 42nd Rd
Sheridan, IL 60551
|
- sq. feet
|
- baths - beds |
show details |
| Photo | Address | Area | Beds / Baths | Price | Details |
|---|---|---|---|---|---|

|
#41
N 4251st Rd
Sheridan, IL 60551
|
- sq. feet
|
- baths - beds |
show details | |

|
#42
N Sacramento St # 12
Sycamore, IL 60178
|
- sq. feet
|
- baths - beds |
show details | |

|
#43
Cloverlane Dr
Sycamore, IL 60178
|
- sq. feet
|
- baths - beds |
show details | |

|
#44
Bailey Rd
Sycamore, IL 60178
|
- sq. feet
|
- baths - beds |
show details | |

|
#45
Bailey Rd
Sycamore, IL 60178
|
- sq. feet
|
- baths - beds |
show details | |

|
#46
Becker Pl
Sycamore, IL 60178
|
- sq. feet
|
- baths - beds |
show details | |

|
#47
Coltonville Rd
Sycamore, IL 60178
|
- sq. feet
|
- baths - beds |
show details | |

|
#48
W Us Highway 34 # C
Plano, IL 60545
|
- sq. feet
|
- baths - beds |
show details | |

|
#49
Coltonville Rd Apt 12
Sycamore, IL 60178
|
- sq. feet
|
- baths - beds |
show details | |

|
Check over 1 million property listings on Foreclosure.com!
|
browse all offers | |||

Latest news about housing in Waterman, IL collected exclusively by city-data.com from local newspapers, TV, and radio stations

 | waterman, il. (26 replies) |
| Fishing and Camping in Illinois? (45 replies) |
| Moving back to IL - need a central 'burb to Huntley, Dekalb & Plainfield (9 replies) |
| Please Join Us In Our Niu Discussion (0 replies) |

Median year apartment built: 1953
Household type by relationship:
Households: 1,503- Male householders: 270 (44 living alone), Female householders: 243 (55 living alone)
359 spouses (359 opposite-sex spouses), 37 unmarried partners, (37 opposite-sex unmarried partners), 527 children (489 natural, 5 adopted, 31 stepchildren), 12 grandchildren, 3 brothers or sisters, 0 parents, 0 foster children, 2 other relatives, 43 non-relatives
Size of family households: 178 2-persons, 84 3-persons, 51 4-persons, 75 5-persons, 8 6-persons, 3 7-or-more-persons.
Size of nonfamily households: 91 1-person, 20 2-persons, 6 3-persons, 3 6-persons.
279 married couples with children.
51 single-parent households (23 men, 28 women).
91.9% of residents of Waterman speak English at home.
6.7% of residents speak Spanish at home (46% speak English very well, 23% speak English well, 31% speak English not well).
0.1% of residents speak other Indo-European language at home (100% speak English very well).
Foreign born population: 53 (3.5%)
(84.9% of them are naturalized citizens)
| Here: | 6.6 |
| State: | 6.4 |
| Here: | 4.8 |
| State: | 4.1 |

- Bedrooms in owner-occupied houses and condos in Waterman, Illinois
- 0no bedroom
- 111 bedroom
- 522 bedrooms
- 2513 bedrooms
- 1064 bedrooms
- 105+ bedrooms

- Bedrooms in renter-occupied apartments in Waterman, Illinois
- 8no bedroom
- 111 bedroom
- 412 bedrooms
- 243 bedrooms
- 34 bedrooms
- 05+ bedrooms

- Cars and other vehicles available in Waterman in owner-occupied houses/condos
- 5no vehicle
- 781 vehicle
- 2342 vehicles
- 543 vehicles
- 374 vehicles
- 225+ vehicles

- Cars and other vehicles available in Waterman in renter-occupied apartments
- 7no vehicle
- 371 vehicle
- 292 vehicles
- 93 vehicles
- 34 vehicles
- 25+ vehicles

- Rooms in owner-occupied houses in Waterman, Illinois
- 01 room
- 02 rooms
- 33 rooms
- 444 rooms
- 845 rooms
- 576 rooms
- 627 rooms
- 1088 rooms
- 729+ rooms

- Rooms in renter-occupied apartments in Waterman, Illinois
- 41 room
- 72 rooms
- 143 rooms
- 104 rooms
- 245 rooms
- 126 rooms
- 57 rooms
- 58 rooms
- 69+ rooms


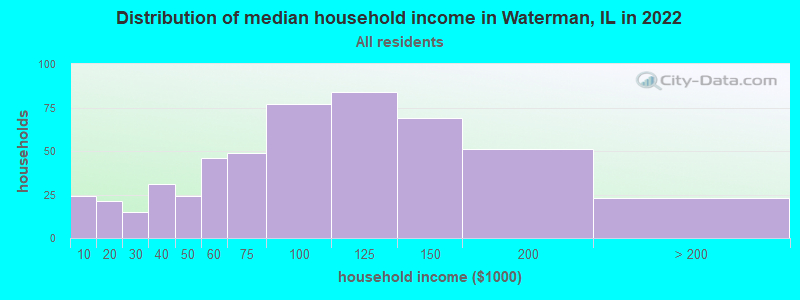
Waterman, IL household income distribution

- 24Less than $10,000
- 21$10,000 to $19,999
- 15$20,000 to $29,999
- 31$30,000 to $39,999
- 24$40,000 to $49,999
- 46$50,000 to $59,999
- 49$60,000 to $74,999
- 77$75,000 to $99,999
- 84$100,000 to $124,999
- 69$125,000 to $149,999
- 51$150,000 to $199,999
- 23$200,000 or more
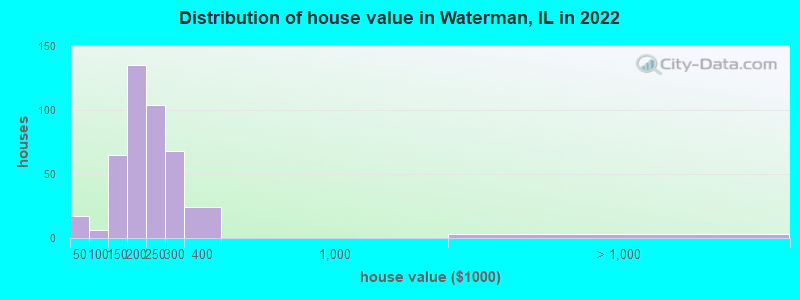
Home value of owner - occupied houses in 2022 in Waterman, IL
-
- 3$15,000 to $19,999
- 7$20,000 to $24,999
- 5$35,000 to $39,999
- 3$80,000 to $89,999
- 3$90,000 to $99,999
- 36$100,000 to $124,999
- 28$125,000 to $149,999
- 62$150,000 to $174,999
- 72$175,000 to $199,999
- 104$200,000 to $249,999
- 68$250,000 to $299,999
- 23$300,000 to $399,999
- 2$1,000,000 to $1,499,999
Rent paid by renters in 2022 in Waterman, IL
-
- 1$150 to $199
- 5$550 to $599
- 21$600 to $649
- 14$650 to $699
- 3$700 to $749
- 8$750 to $799
- 8$800 to $899
- 15$900 to $999
- 4$1,000 to $1,249
- 6No cash rent


Percentage of workers working in this county: 43.4%
Number of people working at home: 56 (7.1% of all workers)
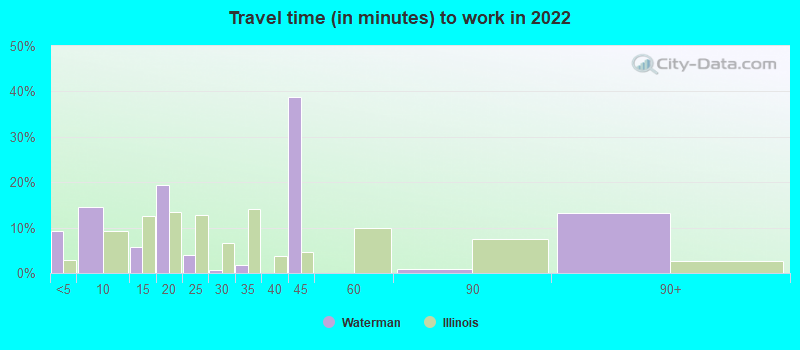
Travel time to work (commute)
- Less than 5 minutes: 43
- 5 to 9 minutes: 70
- 10 to 14 minutes: 15
- 15 to 19 minutes: 61
- 20 to 24 minutes: 71
- 25 to 29 minutes: 32
- 30 to 34 minutes: 112
- 35 to 39 minutes: 19
- 40 to 44 minutes: 32
- 45 to 59 minutes: 97
- 60 to 89 minutes: 70
- 90 or more minutes: 88
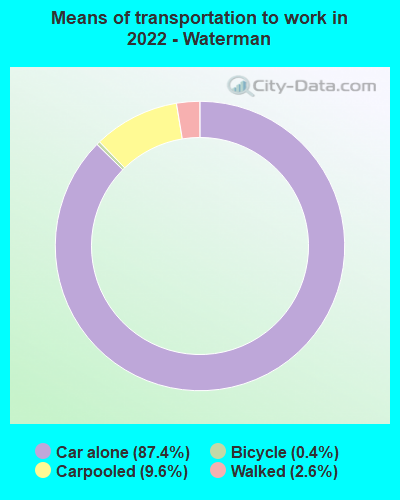
Means of transportation to work:
- Drove a car alone: 397 (77.1%)
- Carpooled: 46 (8.9%)
- Bicycle: 2 (0.4%)
- Walked: 11 (2.1%)
- Worked at home: 56 (10.9%)

- Unemployment by race in 2022
- Unemployment rate for White non-Hispanic residents
- 1.2%Males
- 1.4%Females
- Unemployment rate for other race residents
- 20.3%Females
- Unemployment rate for Hispanic or Latino residents
- 14.6%Females

- Year of entry for the foreign-born population in Waterman, Illinois
- 42010 or later
- 222000 to 2009
- 211990 to 1999
- 01980 to 1989
- 41970 to 1979
- 8Before 1970

First ancestries reported:
- German: 134 (26.4%)
- American: 85 (16.7%)
- English: 49 (9.6%)
- Italian: 20 (3.9%)
- Irish: 14 (2.8%)
- Norwegian: 5 (1.0%)
- Czech: 3 (0.6%)
- Swedish: 3 (0.6%)
- Dutch: 2 (0.4%)
- European: 2 (0.4%)
- Greek: 2 (0.4%)
- Polish: 2 (0.4%)
- Scottish: 2 (0.4%)
- Welsh: 2 (0.4%)
- British: 1 (0.2%)
Most common places of birth for foreign-born residents (%):
| Waterman: | 88.1% (52) |
| Illinois: | 34.7% (626,958) |
| Waterman: | 6.8% (4) |
| Illinois: | 0.9% (16,553) |
| Waterman: | 5.1% (3) |
| Illinois: | 1.0% (18,753) |
Place of birth for U.S.-born residents:
- This state: 1,293
- Other state: 164
- Northeast: 8
- Midwest: 71
- South: 44
- West: 34
93.4% of Waterman residents lived in the same house 1 years ago.
Out of people who lived in different houses, 33.1% lived in this county.
Out of people who lived in different counties, 92.3% lived in Illinois.
| Waterman: | 93.4% |
| State average: | 88.3% |
Education attainment for males 25 years and older:
- No schooling: 0
- Nursery to 4th grade: 0
- 5th and 6th grade: 11
- 7th and 8th grade: 0
- 9th grade: 6
- 10th grade: 3
- 11th grade: 3
- 12th grade, no diploma: 10
- High school graduate (or equivalency): 178
- Less than 1 year of college: 41
- Some college more than 1 year, no degree: 50
- Associate degree: 43
- Bachelor's degree: 99
- Master's degree: 16
- Professional school degree: 9
- Doctorate degree: 0

Education attainment for females 25 years and older:
- No schooling: 0
- Nursery to 4th grade: 0
- 5th and 6th grade: 0
- 7th and 8th grade: 20
- 9th grade: 3
- 10th grade: 0
- 11th grade: 0
- 12th grade, no diploma: 12
- High school graduate (or equivalency): 189
- Less than 1 year of college: 59
- Some college more than 1 year, no degree: 79
- Associate degree: 42
- Bachelor's degree: 44
- Master's degree: 26
- Professional school degree: 0
- Doctorate degree: 3


Housing units in structures:
- One, detached: 442
- One, attached: 18
- Two: 12
- 3 or 4: 4
- 5 to 9: 2
- 10 to 19: 20
- 20 to 49: 8
- 50 or more: 6
- Mobile homes: 24
House/condo owner moved in on average 14 years ago
Renter moved in on average 2 years ago

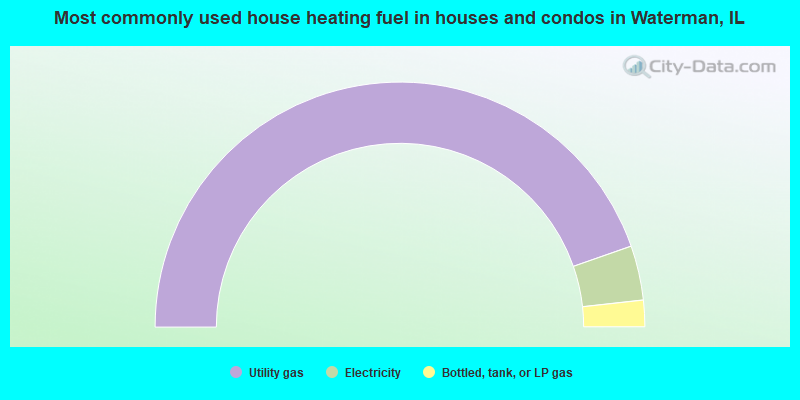
- 89.3%Utility gas
- 7.2%Electricity
- 3.5%Bottled, tank, or LP gas
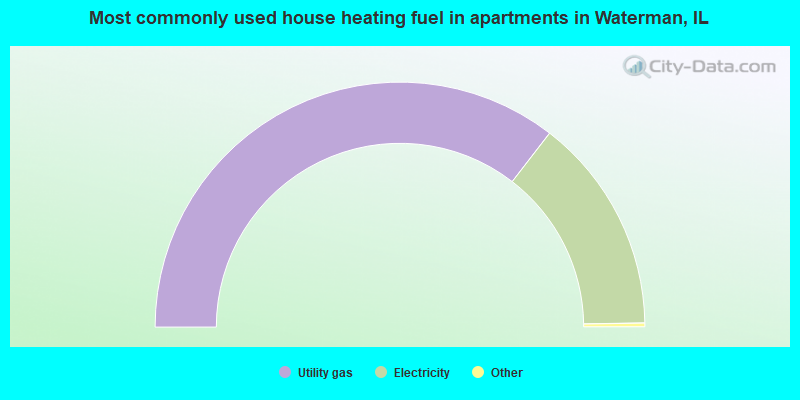
- 71.3%Utility gas
- 28.7%Electricity
Private vs. public school enrollment:
| Here: | 14.7% |
| Illinois: | 13.3% |
| Here: | 3.2% |
| Illinois: | 9.9% |
| Here: | 24.0% |
| Illinois: | 27.4% |


