Watervliet, MI (Michigan) Houses and Residents
| Watervliet: | $123,905 |
| Michigan: | $224,400 |
Mean price in 2022:
Detached houses: $152,716
Here: $152,716 State: $280,038 Mobile homes: $27,737
Here: $27,737 State: $72,868
Total population: 1,703 (All urban)
Houses: 717 (668 occupied: 449 owner occupied, 213 renter occupied)
| % of renters here: | 32% |
| State: | 27% |
Housing density: 582 houses/condos per square mile
Median price asked for vacant for-sale houses and condos in 2022 in this county: $272,552.
Median contract rent in 2022: $646
Median rent asked for vacant for-rent units in 2022: $707
Median gross rent in Watervliet, MI in 2022: $855
Housing units in Watervliet with a mortgage: 331 (22 second mortgage, 0 home equity loan, 15 both second mortgage and home equity loan)
Houses without a mortgage: 9
Median household income for houses/condos with a mortgage: $64,496
Median household income for apartments without a mortgage: $37,341
Median monthly housing costs: $924
Compare current foreclosures near Watervliet, MI:
| Photo | Address | Area | Beds / Baths | Price | Details |
|---|---|---|---|---|---|

|
#1
N Prospect Ct
Watervliet, MI 49098
|
- sq. feet
|
2 baths 3 beds |
show details | |

|
#2
Elm
Watervliet, MI 49098
|
- sq. feet
|
- baths - beds |
show details | |

|
#3
Park St
Watervliet, MI 49098
|
- sq. feet
|
- baths - beds |
show details | |

|
#4
48th Ave
Watervliet, MI 49098
|
- sq. feet
|
- baths - beds |
show details | |

|
#5
Van Atter Ct
Watervliet, MI 49098
|
- sq. feet
|
- baths - beds |
show details | |

|
#6
Paras Hill Dr
Hartford, MI 49057
|
1,025 sq. feet
|
2 baths 3 beds |
show details | |

|
#7
Bishop Ave
Benton Harbor, MI 49022
|
1,040 sq. feet
|
1 baths 4 beds |
show details | |

|
#8
Elm St
Dowagiac, MI 49047
|
1,219 sq. feet
|
2 baths 4 beds |
show details | |

|
#9
Plimpton Ave
Benton Harbor, MI 49022
|
720 sq. feet
|
1 baths 1 beds |
show details | |

|
#10
Wedgewood Rd
Saint Joseph, MI 49085
|
1,847 sq. feet
|
2 baths 3 beds |
show details |
| Photo | Address | Area | Beds / Baths | Price | Details |
|---|---|---|---|---|---|

|
#11
S Benton Center Rd
Benton Harbor, MI 49022
|
1,730 sq. feet
|
1 baths 3 beds |
show details | |

|
#12
Porter Dr
Eau Claire, MI 49111
|
1,352 sq. feet
|
2 baths 3 beds |
show details | |

|
#13
Chambers St
South Haven, MI 49090
|
1,500 sq. feet
|
2 baths 3 beds |
show details | |

|
#14
Clark St
Hartford, MI 49057
|
1,300 sq. feet
|
2 baths 4 beds |
show details | |

|
#15
Leach Rd
Dowagiac, MI 49047
|
1,213 sq. feet
|
1 baths 2 beds |
show details | |

|
#16
S Cherry Dr
Stevensville, MI 49127
|
2,592 sq. feet
|
3 baths 3 beds |
show details | |

|
#17
Glenwood Rd
Dowagiac, MI 49047
|
1,856 sq. feet
|
2 baths 3 beds |
show details | |

|
#18
67 1/2 St
Hartford, MI 49057
|
1,100 sq. feet
|
2 baths 3 beds |
show details | |

|
#19
Lake Rd
Coloma, MI 49038
|
- sq. feet
|
1 baths 4 beds |
show details | |

|
#20
Monroe St
Benton Harbor, MI 49022
|
- sq. feet
|
2 baths 3 beds |
show details |
| Photo | Address | Area | Beds / Baths | Price | Details |
|---|---|---|---|---|---|

|
#21
Defield Rd
Coloma, MI 49038
|
- sq. feet
|
1 baths 2 beds |
show details | |

|
#22
Hurd Ave
Benton Harbor, MI 49022
|
- sq. feet
|
1 baths 2 beds |
show details | |

|
#23
67th St
Dowagiac, MI 49047
|
- sq. feet
|
1 baths 2 beds |
show details | |

|
#24
Plaza Dr Apt 319
Benton Harbor, MI 49022
|
- sq. feet
|
- baths - beds |
show details | |

|
#25
Kline Ave
Benton Harbor, MI 49022
|
- sq. feet
|
- baths - beds |
show details | |

|
#26
Monroe St
Benton Harbor, MI 49022
|
- sq. feet
|
- baths - beds |
show details | |

|
#27
Union Ave Apt 3a
Benton Harbor, MI 49022
|
- sq. feet
|
- baths - beds |
show details | |

|
#28
Hastings Ave
Benton Harbor, MI 49022
|
- sq. feet
|
- baths - beds |
show details | |

|
#29
Eloise Dr
Benton Harbor, MI 49022
|
- sq. feet
|
- baths - beds |
show details | |

|
#30
Bishop Ave
Benton Harbor, MI 49022
|
- sq. feet
|
- baths - beds |
show details |
| Photo | Address | Area | Beds / Baths | Price | Details |
|---|---|---|---|---|---|

|
#31
Glenwood Rd
Dowagiac, MI 49047
|
- sq. feet
|
- baths - beds |
show details | |

|
#32
M 152
Dowagiac, MI 49047
|
- sq. feet
|
- baths - beds |
show details | |

|
#33
Truman Dr
Benton Harbor, MI 49022
|
- sq. feet
|
- baths - beds |
show details | |

|
#34
W Saint Marys St
Decatur, MI 49045
|
- sq. feet
|
- baths - beds |
show details | |

|
#35
Church St # 1
Saint Joseph, MI 49085
|
- sq. feet
|
- baths - beds |
show details | |

|
#36
Lakeshore Dr
Saint Joseph, MI 49085
|
- sq. feet
|
- baths - beds |
show details | |

|
#37
County Road 388
South Haven, MI 49090
|
- sq. feet
|
- baths - beds |
show details | |

|
#38
Lake Pine Dr
Saint Joseph, MI 49085
|
- sq. feet
|
- baths - beds |
show details | |

|
#39
8th Ave
South Haven, MI 49090
|
- sq. feet
|
- baths - beds |
show details | |

|
#40
County Road 380
Grand Junction, MI 49056
|
- sq. feet
|
- baths - beds |
show details |
| Photo | Address | Area | Beds / Baths | Price | Details |
|---|---|---|---|---|---|

|
#41
16th Ave Lot 51
South Haven, MI 49090
|
- sq. feet
|
- baths - beds |
show details | |

|
#42
Broadway St Apt 106
South Haven, MI 49090
|
- sq. feet
|
- baths - beds |
show details | |

|
#43
County Road 384
Grand Junction, MI 49056
|
- sq. feet
|
- baths - beds |
show details | |

|
#44
Wilson Dr
Dowagiac, MI 49047
|
- sq. feet
|
- baths - beds |
show details | |

|
#45
W Telegraph St
Dowagiac, MI 49047
|
- sq. feet
|
- baths - beds |
show details | |

|
#46
W Delaware St
Decatur, MI 49045
|
- sq. feet
|
- baths - beds |
show details | |

|
#47
County Road 388 Lot 59
South Haven, MI 49090
|
- sq. feet
|
- baths - beds |
show details | |

|
#48
County Road 388 Lot 16
South Haven, MI 49090
|
- sq. feet
|
- baths - beds |
show details | |

|
#49
Maiden Ln
Saint Joseph, MI 49085
|
- sq. feet
|
- baths - beds |
show details | |

|
Check over 1 million property listings on Foreclosure.com!
|
browse all offers | |||

Latest news about housing in Watervliet, MI collected exclusively by city-data.com from local newspapers, TV, and radio stations

 | What are these areas of SW Michigan like? (7 replies) |
| need phone books for Watervliet, MI area (1 reply) |
| moving to michigan (8 replies) |
| Best place to live between Kalamazoo and Benton Harbor? (10 replies) |
| Coloma, MI - Paw Paw Lake (7 replies) |

Median year apartment built: 1958
Household type by relationship:
Households: 1,870- Male householders: 369 (84 living alone), Female householders: 291 (93 living alone)
326 spouses (313 opposite-sex spouses), 97 unmarried partners, (96 opposite-sex unmarried partners), 646 children (596 natural, 36 adopted, 12 stepchildren), 22 grandchildren, 7 brothers or sisters, 39 parents, 8 foster children, 8 other relatives, 50 non-relatives
Size of family households: 136 2-persons, 89 3-persons, 79 4-persons, 20 5-persons, 57 6-persons.
Size of nonfamily households: 188 1-person, 71 2-persons, 2 3-persons.
445 married couples with children.
69 single-parent households (31 men, 38 women).
91.6% of residents of Watervliet speak English at home.
8.2% of residents speak Spanish at home (42% speak English very well, 38% speak English well, 20% don't speak English at all).
Foreign born population: 56 (3.0%)
(53.6% of them are naturalized citizens)
| Here: | 6.3 |
| State: | 6.5 |
| Here: | 4.6 |
| State: | 4.3 |

- Bedrooms in owner-occupied houses and condos in Watervliet, Michigan
- 0no bedroom
- 11 bedroom
- 932 bedrooms
- 2733 bedrooms
- 764 bedrooms
- 75+ bedrooms

- Bedrooms in renter-occupied apartments in Watervliet, Michigan
- 10no bedroom
- 581 bedroom
- 552 bedrooms
- 913 bedrooms
- 04 bedrooms
- 05+ bedrooms

- Cars and other vehicles available in Watervliet in owner-occupied houses/condos
- 8no vehicle
- 1191 vehicle
- 2222 vehicles
- 873 vehicles
- 74 vehicles
- 75+ vehicles

- Cars and other vehicles available in Watervliet in renter-occupied apartments
- 31no vehicle
- 771 vehicle
- 912 vehicles
- 153 vehicles
- 04 vehicles
- 05+ vehicles

- Rooms in owner-occupied houses in Watervliet, Michigan
- 01 room
- 02 rooms
- 63 rooms
- 154 rooms
- 1075 rooms
- 1056 rooms
- 1537 rooms
- 208 rooms
- 459+ rooms

- Rooms in renter-occupied apartments in Watervliet, Michigan
- 101 room
- 212 rooms
- 463 rooms
- 294 rooms
- 355 rooms
- 576 rooms
- 07 rooms
- 38 rooms
- 139+ rooms


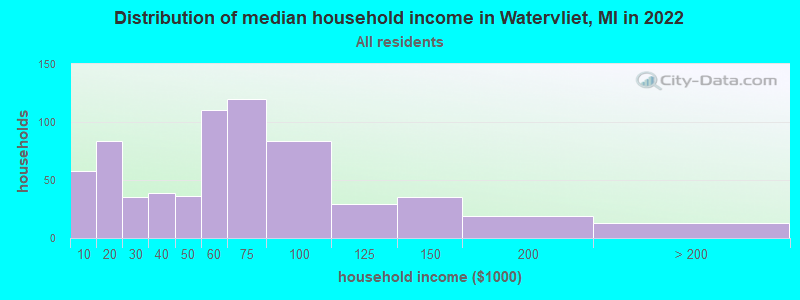
Watervliet, MI household income distribution

- 58Less than $10,000
- 84$10,000 to $19,999
- 35$20,000 to $29,999
- 39$30,000 to $39,999
- 36$40,000 to $49,999
- 110$50,000 to $59,999
- 120$60,000 to $74,999
- 84$75,000 to $99,999
- 29$100,000 to $124,999
- 35$125,000 to $149,999
- 19$150,000 to $199,999
- 13$200,000 or more
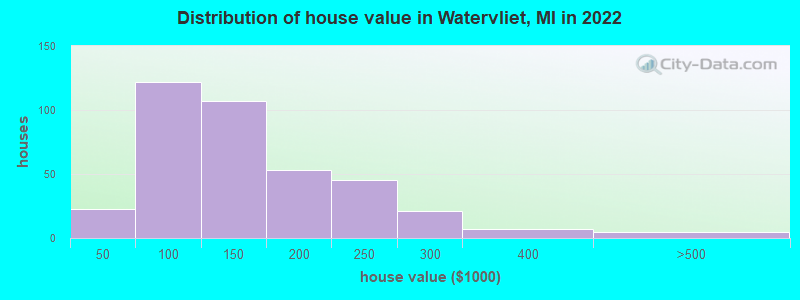
Home value of owner - occupied houses in 2022 in Watervliet, MI
-
- 0$10,000 to $14,999
- 3$25,000 to $29,999
- 15$30,000 to $34,999
- 3$40,000 to $49,999
- 5$50,000 to $59,999
- 15$60,000 to $69,999
- 22$70,000 to $79,999
- 18$80,000 to $89,999
- 57$90,000 to $99,999
- 73$100,000 to $124,999
- 33$125,000 to $149,999
- 33$150,000 to $174,999
- 20$175,000 to $199,999
- 45$200,000 to $249,999
- 20$250,000 to $299,999
- 7$300,000 to $399,999
- 5$400,000 to $499,999
Rent paid by renters in 2022 in Watervliet, MI
-
- 17$100 to $149
- 12$150 to $199
- 14$200 to $249
- 13$300 to $349
- 3$400 to $449
- 4$450 to $499
- 11$550 to $599
- 18$600 to $649
- 19$650 to $699
- 10$700 to $749
- 2$750 to $799
- 15$800 to $899
- 31$900 to $999
- 3$1,000 to $1,249
- 5$1,500 to $1,999
- 9No cash rent


Percentage of workers working in this county: 71.5%
Number of people working at home: 16 (2.0% of all workers)
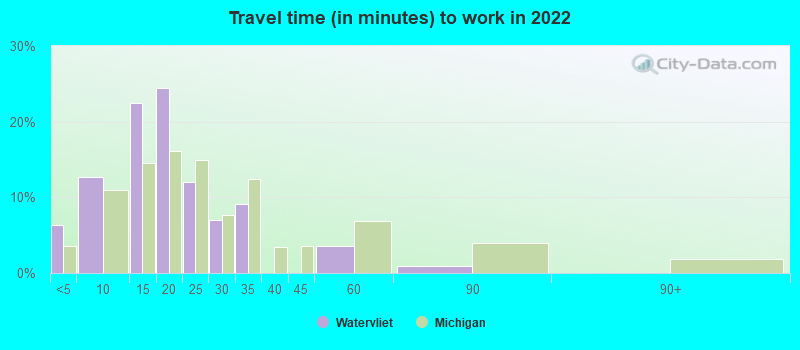
Travel time to work (commute)
- Less than 5 minutes: 21
- 5 to 9 minutes: 149
- 10 to 14 minutes: 98
- 15 to 19 minutes: 131
- 20 to 24 minutes: 136
- 25 to 29 minutes: 58
- 30 to 34 minutes: 72
- 35 to 39 minutes: 34
- 40 to 44 minutes: 4
- 45 to 59 minutes: 12
- 60 to 89 minutes: 2
- 90 or more minutes: 16
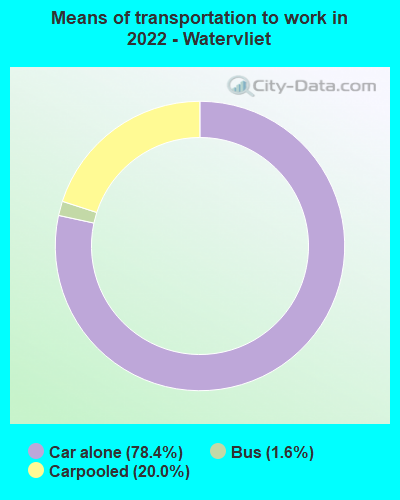
Means of transportation to work:
- Drove a car alone: 403 (72.0%)
- Carpooled: 140 (25.0%)
- Bus: 7 (1.2%)
- Worked at home: 16 (2.9%)

- Unemployment by race in 2022
- Unemployment rate for White non-Hispanic residents
- 2.6%Males
- 7.3%Females
- Unemployment rate for other race residents
- 19.6%Males
- Unemployment rate for Hispanic or Latino residents
- 10.8%Males

- Year of entry for the foreign-born population in Watervliet, Michigan
- 142010 or later
- 12000 to 2009
- 351990 to 1999
- 171980 to 1989
- 01970 to 1979
- 12Before 1970

First ancestries reported:
- German: 300 (37.0%)
- Irish: 128 (15.8%)
- English: 29 (3.6%)
- American: 27 (3.3%)
- Italian: 18 (2.2%)
- Scottish: 15 (1.8%)
- Scotch-Irish: 12 (1.5%)
- Welsh: 8 (1.0%)
- European: 6 (0.7%)
- Polish: 6 (0.7%)
- Scandinavian: 3 (0.4%)
- French Canadian: 2 (0.2%)
Most common places of birth for foreign-born residents (%):
| Watervliet: | 62.9% (39) |
| Michigan: | 10.9% (75,965) |
| Watervliet: | 11.3% (7) |
| Michigan: | 1.0% (7,097) |
| Watervliet: | 8.1% (5) |
| Michigan: | 1.6% (10,857) |
| Watervliet: | 4.8% (3) |
| Michigan: | 0.5% (3,489) |
| Watervliet: | 3.2% (2) |
| Michigan: | 5.0% (35,052) |
Place of birth for U.S.-born residents:
- This state: 1,436
- Other state: 369
- Northeast: 5
- Midwest: 120
- South: 177
- West: 81
89.2% of Watervliet residents lived in the same house 1 years ago.
Out of people who lived in different houses, 33.8% lived in this county.
Out of people who lived in different counties, 87.6% lived in Michigan.
| Watervliet: | 89.2% |
| State average: | 88.4% |
Education attainment for males 25 years and older:
- No schooling: 21
- Nursery to 4th grade: 0
- 5th and 6th grade: 0
- 7th and 8th grade: 5
- 9th grade: 9
- 10th grade: 12
- 11th grade: 1
- 12th grade, no diploma: 13
- High school graduate (or equivalency): 191
- Less than 1 year of college: 41
- Some college more than 1 year, no degree: 114
- Associate degree: 108
- Bachelor's degree: 36
- Master's degree: 3
- Professional school degree: 8
- Doctorate degree: 0

Education attainment for females 25 years and older:
- No schooling: 38
- Nursery to 4th grade: 0
- 5th and 6th grade: 0
- 7th and 8th grade: 8
- 9th grade: 4
- 10th grade: 12
- 11th grade: 19
- 12th grade, no diploma: 33
- High school graduate (or equivalency): 166
- Less than 1 year of college: 50
- Some college more than 1 year, no degree: 127
- Associate degree: 75
- Bachelor's degree: 41
- Master's degree: 15
- Professional school degree: 0
- Doctorate degree: 0


Housing units in structures:
- One, detached: 561
- One, attached: 52
- Two: 25
- 3 or 4: 19
- 10 to 19: 1
- 20 to 49: 8
- 50 or more: 49
- Mobile homes: 1
Housing units lacking complete kitchen facilities in 2022: 3.8%
House/condo owner moved in on average 10 years ago
Renter moved in on average 6 years ago

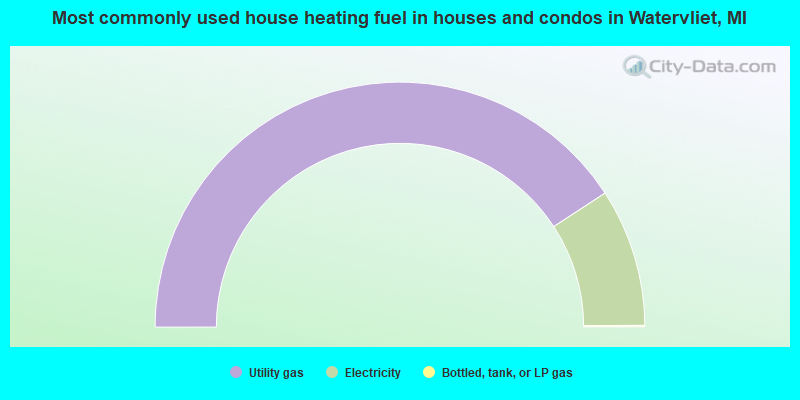
- 81.6%Utility gas
- 18.2%Electricity
- 0.2%Bottled, tank, or LP gas
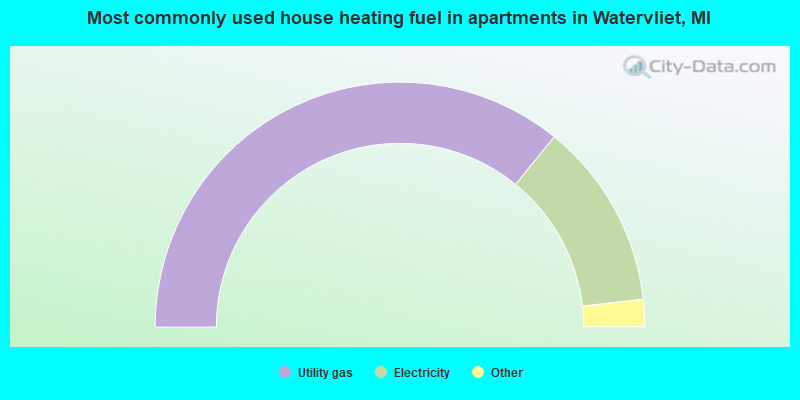
- 72.0%Utility gas
- 24.8%Electricity
- 1.9%Bottled, tank, or LP gas
- 1.4%Other fuel
Private vs. public school enrollment:
| Here: | 26.1% |
| Michigan: | 12.4% |
| Here: | 39.4% |
| Michigan: | 9.8% |
| Here: | 19.5% |
| Michigan: | 14.9% |


