Wauconda, IL (Illinois) Houses and Residents
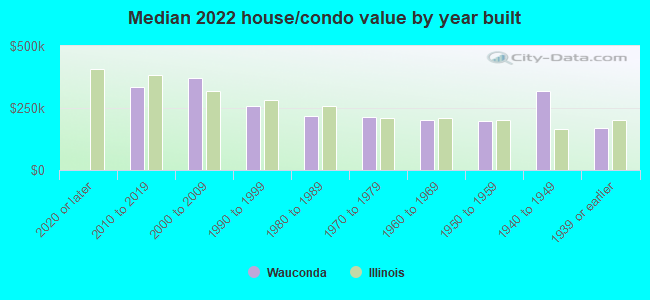
| Wauconda: | $272,836 |
| Illinois: | $251,600 |
Mean price in 2022:
Detached houses: $324,937
Here: $324,937 State: $310,164 Townhouses or other attached units: $217,496
Here: $217,496 State: $286,230 In 3-to-4-unit structures: $220,827
Here: $220,827 State: $330,907 In 5-or-more-unit structures: $243,215
Here: $243,215 State: $318,887 Mobile homes: $25,535
Here: $25,535 State: $78,855
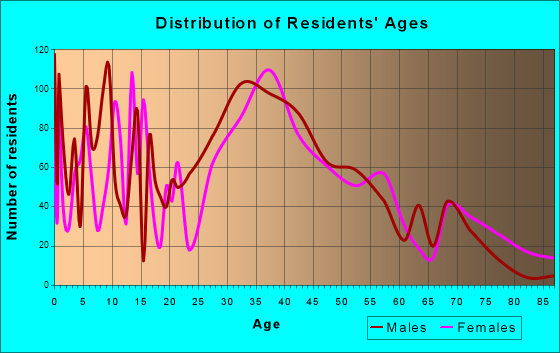
Total population: 13,896 (Urban population: 9,259, Rural population: 127 (all nonfarm))
Houses: 5,353 (5,074 occupied: 4,003 owner occupied, 1,168 renter occupied)
| % of renters here: | 23% |
| State: | 33% |
Housing density: 1,385 houses/condos per square mile
Median price asked for vacant for-sale houses and condos in 2022: $558,785.
Median contract rent in 2022: $1,146 (lower quartile is $895, upper quartile is $1,595)
Median rent asked for vacant for-rent units in 2022: $1,340
Median gross rent in Wauconda, IL in 2022: $1,269
Housing units in Wauconda with a mortgage: 2,887 (310 second mortgage, 0 home equity loan, 298 both second mortgage and home equity loan)
Houses without a mortgage: 31
Median household income for houses/condos with a mortgage: $125,821
Median household income for apartments without a mortgage: $65,338
Median monthly housing costs: $1,587
Compare current foreclosures near Wauconda, IL:
| Photo | Address | Area | Beds / Baths | Price | Details |
|---|---|---|---|---|---|

|
#1
Fieldbrook Dr
Wauconda, IL 60084
|
2,286 sq. feet
|
3 baths 3 beds |
show details | |

|
#2
Jessica Dr
Wauconda, IL 60084
|
4,535 sq. feet
|
3 baths - beds |
show details | |

|
#3
Lake Shore Dr
Wauconda, IL 60084
|
1,128 sq. feet
|
1 baths - beds |
show details | |

|
#4
Laurel Ave
Wauconda, IL 60084
|
925 sq. feet
|
1 baths - beds |
show details | |

|
#5
Fieldbrook Ave
Wauconda, IL 60084
|
2,632 sq. feet
|
2 baths - beds |
show details | |

|
#6
Larkdale Row
Wauconda, IL 60084
|
925 sq. feet
|
1 baths - beds |
show details | |

|
#7
W Blakely Pkwy
Wauconda, IL 60084
|
3,252 sq. feet
|
2 baths - beds |
show details | |

|
#8
Indian Ridge Trl
Wauconda, IL 60084
|
2,302 sq. feet
|
2 baths - beds |
show details | |

|
#9
Stonybrook St
Wauconda, IL 60084
|
2,312 sq. feet
|
1 baths - beds |
show details | |

|
#10
Apple Valley Dr
Wauconda, IL 60084
|
4,402 sq. feet
|
3 baths - beds |
show details |
| Photo | Address | Area | Beds / Baths | Price | Details |
|---|---|---|---|---|---|

|
#11
Fishhook Way
Wauconda, IL 60084
|
2,301 sq. feet
|
2 baths - beds |
show details | |

|
#12
S Maple Ave
Wauconda, IL 60084
|
1,574 sq. feet
|
1 baths - beds |
show details | |

|
#13
Bangs St
Wauconda, IL 60084
|
1,271 sq. feet
|
1 baths - beds |
show details | |

|
#14
Kimball Ave
Wauconda, IL 60084
|
2,205 sq. feet
|
1 baths - beds |
show details | |

|
#15
E Liberty St Apt D
Wauconda, IL 60084
|
- sq. feet
|
- baths - beds |
show details | |

|
#16
W Maple Ave
Wauconda, IL 60084
|
- sq. feet
|
- baths - beds |
show details | |

|
#17
Peace Blvd
Wauconda, IL 60084
|
- sq. feet
|
- baths - beds |
show details | |

|
#18
Oak Grove Cir
Wauconda, IL 60084
|
- sq. feet
|
- baths - beds |
show details | |

|
#19
Sunshine Ln
Woodstock, IL 60098
|
2,054 sq. feet
|
2 baths 5 beds |
$217,000
|
show details |

|
#20
Clover Ct
Round Lake, IL 60073
|
1,682 sq. feet
|
1 baths 3 beds |
$273,000
|
show details |
| Photo | Address | Area | Beds / Baths | Price | Details |
|---|---|---|---|---|---|

|
#21
Briar Hill Dr
Schaumburg, IL 60194
|
1,600 sq. feet
|
2 baths 4 beds |
$410,400
|
show details |

|
#22
Wisconsin Ave
Barrington, IL 60010
|
1,297 sq. feet
|
2 baths 3 beds |
$499,000
|
show details |

|
#23
Carriage Way Dr
Arlington Heights, IL 60004
|
- sq. feet
|
2 baths 2 beds |
$179,900
|
show details |

|
#24
W Lake Shore Dr
Spring Grove, IL 60081
|
1,023 sq. feet
|
1 baths 2 beds |
$110,250
|
show details |

|
#25
W Milton Rd
Wauconda, IL 60084
|
- sq. feet
|
- baths - beds |
show details | |

|
#26
Clover Ln
Round Lake, IL 60073
|
- sq. feet
|
2 baths 3 beds |
$130,000
|
show details |

|
#27
Timber Lake Dr
Antioch, IL 60002
|
3,473 sq. feet
|
3 baths 5 beds |
show details | |

|
#28
Hillsboro Ln
Lake In The Hills, IL 60156
|
2,196 sq. feet
|
2 baths 4 beds |
show details | |

|
#29
Harbor Rd
Wonder Lake, IL 60097
|
2,100 sq. feet
|
2 baths 4 beds |
show details | |

|
#30
Cherokee Dr
Round Lake, IL 60073
|
1,136 sq. feet
|
2 baths 4 beds |
show details |
| Photo | Address | Area | Beds / Baths | Price | Details |
|---|---|---|---|---|---|

|
#31
Tall Oaks Dr
Antioch, IL 60002
|
2,160 sq. feet
|
2 baths 3 beds |
show details | |

|
#32
Barharbor Dr
Lake In The Hills, IL 60156
|
1,998 sq. feet
|
2 baths 4 beds |
show details | |

|
#33
Dove St
Rolling Meadows, IL 60008
|
2,632 sq. feet
|
2 baths 3 beds |
show details | |

|
#34
N Harvard Ave
Arlington Heights, IL 60004
|
1,614 sq. feet
|
2 baths 4 beds |
show details | |

|
#35
N Hidden Trl
Spring Grove, IL 60081
|
2,463 sq. feet
|
2 baths 3 beds |
show details | |

|
#36
N Old Lake Ave
Antioch, IL 60002
|
2,904 sq. feet
|
2 baths 3 beds |
show details | |

|
#37
S Fulton Ave
Waukegan, IL 60085
|
1,365 sq. feet
|
1 baths 4 beds |
show details | |

|
#38
Cameron Dr
Antioch, IL 60002
|
2,427 sq. feet
|
2 baths 4 beds |
show details | |

|
#39
Hillside Ave
Antioch, IL 60002
|
2,448 sq. feet
|
3 baths 5 beds |
show details | |

|
#40
W Tahoe Dr
Mundelein, IL 60060
|
2,849 sq. feet
|
3 baths 5 beds |
show details |
| Photo | Address | Area | Beds / Baths | Price | Details |
|---|---|---|---|---|---|

|
#41
W Kinley Blvd
Mchenry, IL 60050
|
1,068 sq. feet
|
3 baths 3 beds |
show details | |

|
#42
16th St
North Chicago, IL 60064
|
1,388 sq. feet
|
1 baths 4 beds |
show details | |

|
#43
Broadway Ave
North Chicago, IL 60064
|
1,482 sq. feet
|
2 baths 3 beds |
show details | |

|
#44
Lincoln St
North Chicago, IL 60064
|
1,136 sq. feet
|
1 baths 2 beds |
show details | |

|
#45
Keats Ln
Highland Park, IL 60035
|
5,000 sq. feet
|
6 baths 5 beds |
show details | |

|
#46
Park Ave
North Chicago, IL 60064
|
1,550 sq. feet
|
1 baths 3 beds |
show details | |

|
#47
Glenwood Ave
Mchenry, IL 60051
|
780 sq. feet
|
1 baths 3 beds |
show details | |

|
#48
N Oltendorf Rd
Streamwood, IL 60107
|
1,235 sq. feet
|
1 baths 2 beds |
show details | |

|
#49
W Meadowview Dr
Round Lake, IL 60073
|
2,756 sq. feet
|
2 baths 4 beds |
show details | |

|
Check over 1 million property listings on Foreclosure.com!
|
browse all offers | |||

Latest news about housing in Wauconda, IL collected exclusively by city-data.com from local newspapers, TV, and radio stations

 | Townhome/Condo rentals in Lake Co. (2 replies) |
| Relocating for job in Wauconda (12 replies) |
| Job changing location from Lombard to Wauconda where to move (10 replies) |
| Remembering that one water slide in Wauconda bangs lake (16 replies) |
| Do kids play outside in the burbs anymore? (71 replies) |
| Advice please, possible move to NW suburbs (4 replies) |
Median year apartment built: 1979
Household type by relationship:
Households: 13,961- Male householders: 2,546 (614 living alone), Female householders: 2,476 (671 living alone)
2,813 spouses (2,801 opposite-sex spouses), 425 unmarried partners, (411 opposite-sex unmarried partners), 4,873 children (4,391 natural, 73 adopted, 408 stepchildren), 216 grandchildren, 87 brothers or sisters, 78 parents, 0 foster children, 187 other relatives, 208 non-relatives
- In group quarters: 46
Size of family households: 1,238 2-persons, 584 3-persons, 1,114 4-persons, 315 5-persons, 72 6-persons, 144 7-or-more-persons.
Size of nonfamily households: 1,357 1-person, 363 2-persons, 2 3-persons.
2,895 married couples with children.
564 single-parent households (283 men, 281 women).
75.5% of residents of Wauconda speak English at home.
15.7% of residents speak Spanish at home (62% speak English very well, 23% speak English well, 9% speak English not well, 5% don't speak English at all).
5.2% of residents speak other Indo-European language at home (64% speak English very well, 24% speak English well, 9% speak English not well, 3% don't speak English at all).
2.8% of residents speak Asian or Pacific Island language at home (44% speak English very well, 44% speak English well, 12% speak English not well).
0.1% of residents speak other language at home (100% speak English very well).
Foreign born population: 1,961 (14.0%)
(56.9% of them are naturalized citizens)
| Here: | 7.1 |
| State: | 6.4 |
| Here: | 4.4 |
| State: | 4.1 |
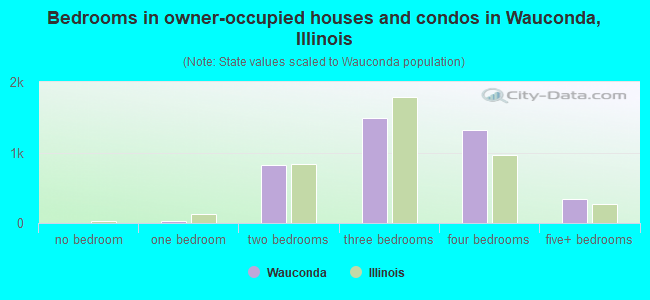
- Bedrooms in owner-occupied houses and condos in Wauconda, Illinois
- 0no bedroom
- 351 bedroom
- 8222 bedrooms
- 1,4873 bedrooms
- 1,3134 bedrooms
- 3475+ bedrooms
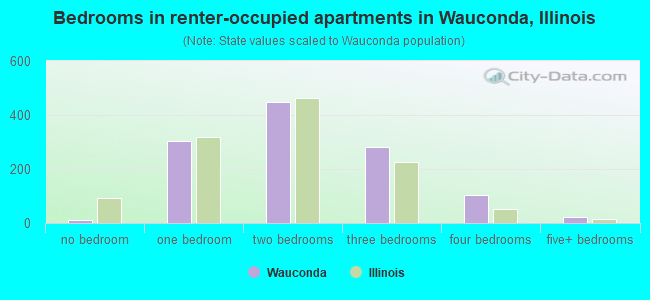
- Bedrooms in renter-occupied apartments in Wauconda, Illinois
- 10no bedroom
- 3031 bedroom
- 4492 bedrooms
- 2813 bedrooms
- 1034 bedrooms
- 225+ bedrooms
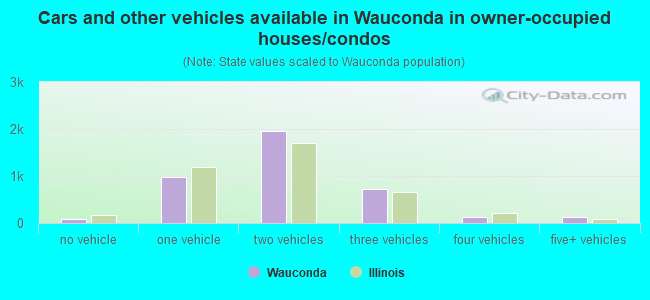
- Cars and other vehicles available in Wauconda in owner-occupied houses/condos
- 89no vehicle
- 9851 vehicle
- 1,9552 vehicles
- 7203 vehicles
- 1334 vehicles
- 1215+ vehicles
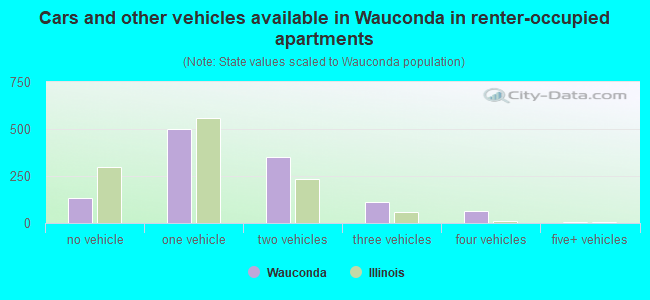
- Cars and other vehicles available in Wauconda in renter-occupied apartments
- 135no vehicle
- 5001 vehicle
- 3522 vehicles
- 1133 vehicles
- 624 vehicles
- 65+ vehicles
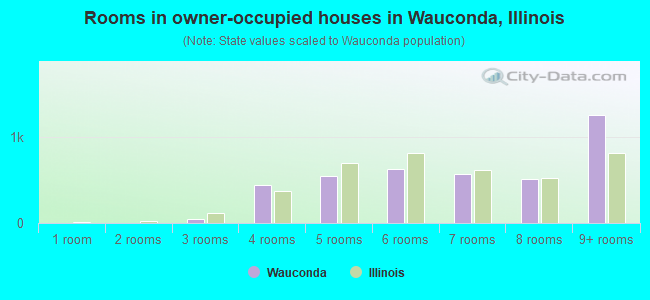
- Rooms in owner-occupied houses in Wauconda, Illinois
- 01 room
- 02 rooms
- 473 rooms
- 4434 rooms
- 5455 rooms
- 6306 rooms
- 5697 rooms
- 5148 rooms
- 1,2559+ rooms
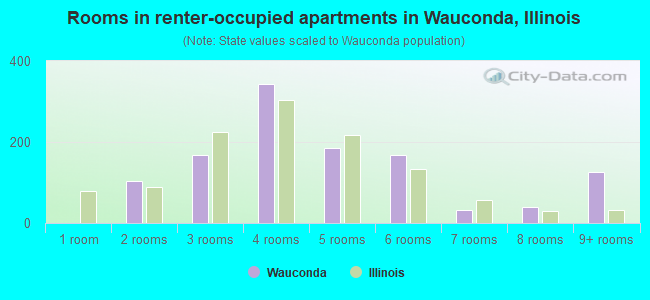
- Rooms in renter-occupied apartments in Wauconda, Illinois
- 01 room
- 1032 rooms
- 1693 rooms
- 3444 rooms
- 1865 rooms
- 1686 rooms
- 327 rooms
- 398 rooms
- 1279+ rooms
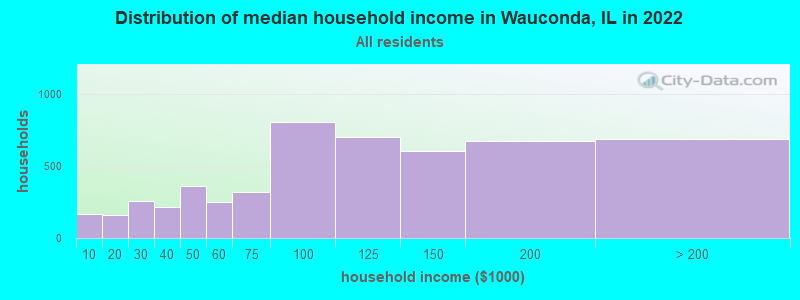
Wauconda, IL household income distribution

- 168Less than $10,000
- 161$10,000 to $19,999
- 256$20,000 to $29,999
- 212$30,000 to $39,999
- 363$40,000 to $49,999
- 249$50,000 to $59,999
- 321$60,000 to $74,999
- 804$75,000 to $99,999
- 700$100,000 to $124,999
- 605$125,000 to $149,999
- 671$150,000 to $199,999
- 689$200,000 or more
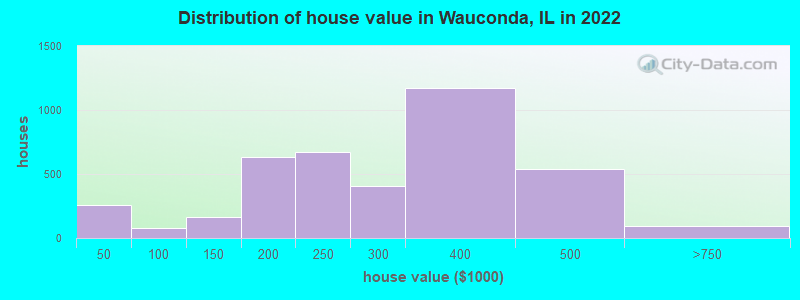
Home value of owner - occupied houses in 2022 in Wauconda, IL
-
- 71Less than $10,000
- 8$10,000 to $14,999
- 79$15,000 to $19,999
- 100$20,000 to $24,999
- 2$50,000 to $59,999
- 51$70,000 to $79,999
- 22$90,000 to $99,999
- 40$100,000 to $124,999
- 121$125,000 to $149,999
- 172$150,000 to $174,999
- 463$175,000 to $199,999
- 669$200,000 to $249,999
- 403$250,000 to $299,999
- 1,174$300,000 to $399,999
- 542$400,000 to $499,999
- 89$500,000 to $749,999
- 7$1,500,000 to $1,999,999
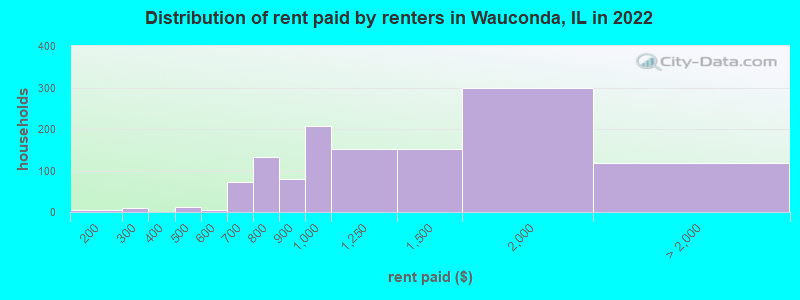
Rent paid by renters in 2022 in Wauconda, IL
-
- 4$100 to $149
- 9$250 to $299
- 11$450 to $499
- 6$550 to $599
- 68$600 to $649
- 4$650 to $699
- 48$700 to $749
- 83$750 to $799
- 79$800 to $899
- 206$900 to $999
- 151$1,000 to $1,249
- 152$1,250 to $1,499
- 297$1,500 to $1,999
- 14$2,000 to $2,499
- 7$2,500 to $2,999
- 22$3,000 to $3,499
- 73No cash rent
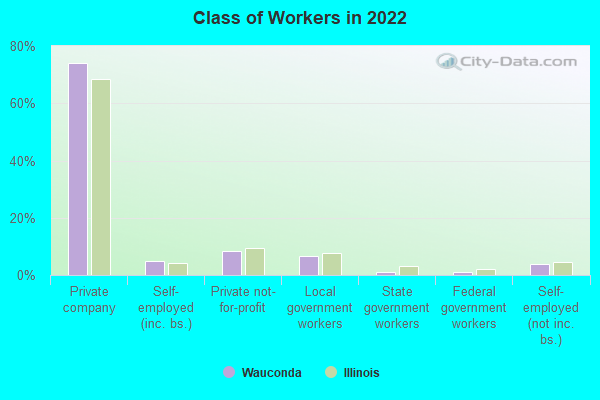
Percentage of workers working in this county: 67.7%
Number of people working at home: 1,218 (15.6% of all workers)
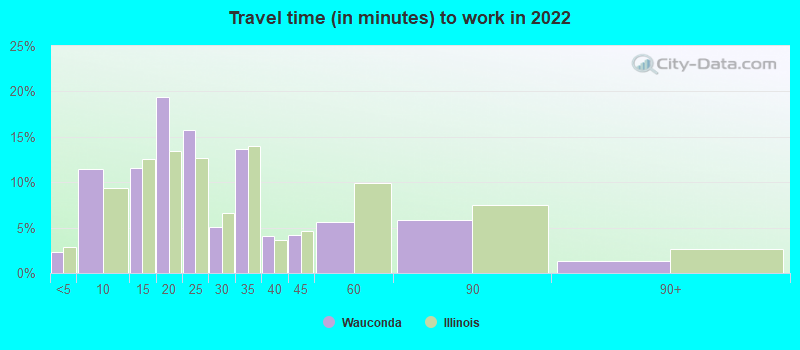
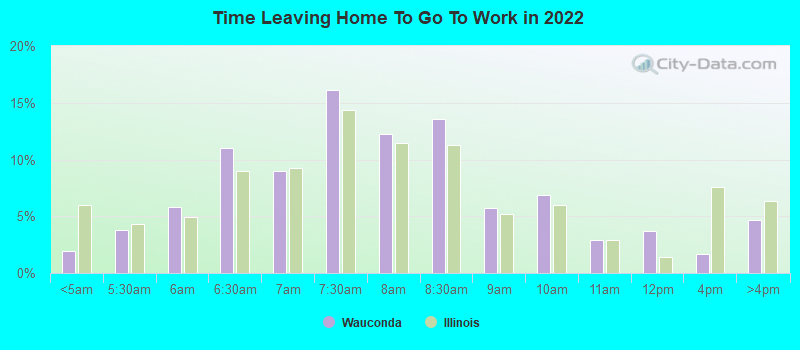
Travel time to work (commute)
- Less than 5 minutes: 26
- 5 to 9 minutes: 694
- 10 to 14 minutes: 599
- 15 to 19 minutes: 514
- 20 to 24 minutes: 892
- 25 to 29 minutes: 868
- 30 to 34 minutes: 899
- 35 to 39 minutes: 329
- 40 to 44 minutes: 405
- 45 to 59 minutes: 847
- 60 to 89 minutes: 317
- 90 or more minutes: 154
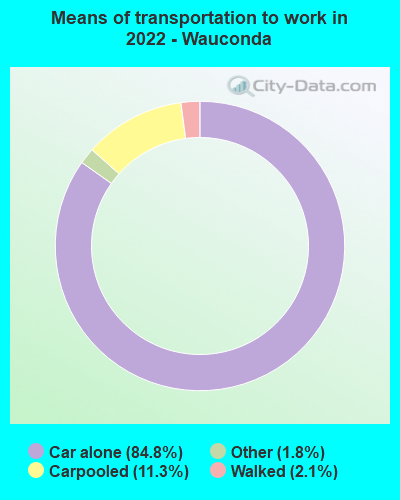
Means of transportation to work:
- Drove a car alone: 4,553 (68.9%)
- Carpooled: 616 (9.3%)
- Taxi: 101 (1.5%)
- Walked: 115 (1.7%)
- Worked at home: 1,218 (18.4%)
- Unemployment by race in 2022
- Unemployment rate for White non-Hispanic residents
- 1.6%Males
- 0.4%Females
- Unemployment rate for Black residents
- 2.6%Males
- Unemployment rate for American Indian and Alaska Native residents
- 51.6%Females
- Unemployment rate for Asian residents
- 9.2%Females
- Unemployment rate for other race residents
- 8.8%Females
- Unemployment rate for two or more race residents
- 0.5%Males
- 3.2%Females
- Unemployment rate for Hispanic or Latino residents
- 0.4%Males
- 8.0%Females
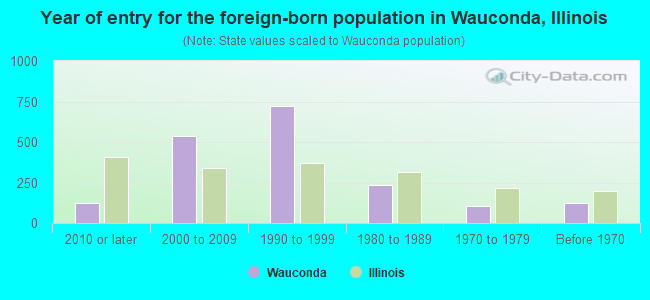
- Year of entry for the foreign-born population in Wauconda, Illinois
- 1232010 or later
- 5342000 to 2009
- 7251990 to 1999
- 2371980 to 1989
- 1021970 to 1979
- 125Before 1970
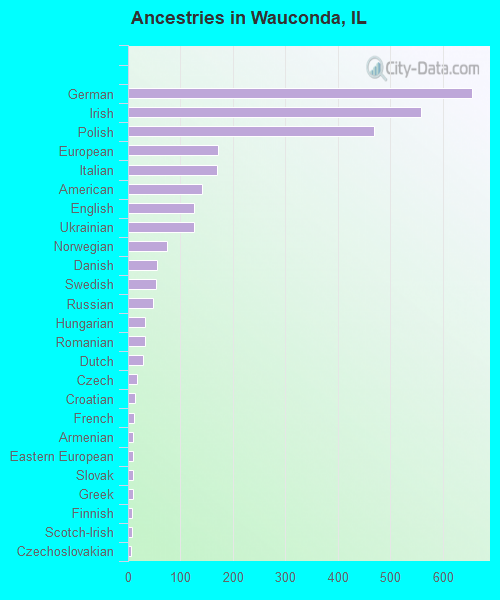
First ancestries reported:
- German: 655 (12.7%)
- Irish: 558 (10.8%)
- Polish: 469 (9.1%)
- European: 171 (3.3%)
- Italian: 170 (3.3%)
- American: 141 (2.7%)
- English: 126 (2.4%)
- Ukrainian: 126 (2.4%)
- Norwegian: 75 (1.5%)
- Danish: 55 (1.1%)
- Swedish: 54 (1.0%)
- Russian: 48 (0.9%)
- Hungarian: 33 (0.6%)
- Romanian: 32 (0.6%)
- Dutch: 28 (0.5%)
- Czech: 18 (0.3%)
- Croatian: 13 (0.3%)
- French: 11 (0.2%)
- Armenian: 10 (0.2%)
- Eastern European: 10 (0.2%)
- Slovak: 10 (0.2%)
- Greek: 9 (0.2%)
- Finnish: 8 (0.2%)
- Scotch-Irish: 8 (0.2%)
- Czechoslovakian: 6 (0.1%)
- Iranian: 5 (0.10%)
- Welsh: 5 (0.10%)
Most common places of birth for foreign-born residents (%):
| Wauconda: | 52.9% (994) |
| Illinois: | 34.7% (626,958) |
| Wauconda: | 8.1% (153) |
| Illinois: | 0.1% (2,412) |
| Wauconda: | 7.2% (135) |
| Illinois: | 4.1% (74,364) |
| Wauconda: | 6.7% (125) |
| Illinois: | 9.2% (166,409) |
| Wauconda: | 5.2% (98) |
| Illinois: | 6.9% (124,474) |
| Wauconda: | 4.3% (81) |
| Illinois: | 5.2% (93,003) |
| Wauconda: | 4.0% (76) |
| Illinois: | 0.3% (4,938) |
| Wauconda: | 3.4% (64) |
| Illinois: | 0.3% (4,775) |
| Wauconda: | 2.1% (40) |
| Illinois: | 1.6% (29,519) |
| Wauconda: | 1.7% (32) |
| Illinois: | 0.9% (16,308) |
| Wauconda: | 1.7% (32) |
| Illinois: | 1.0% (18,753) |
Place of birth for U.S.-born residents:
- This state: 9,340
- Other state: 2,384
- Northeast: 343
- Midwest: 1,469
- South: 352
- West: 174
92.5% of Wauconda residents lived in the same house 1 years ago.
Out of people who lived in different houses, 30.4% lived in this county.
Out of people who lived in different counties, 80.3% lived in Illinois.
| Wauconda: | 92.5% |
| State average: | 88.3% |
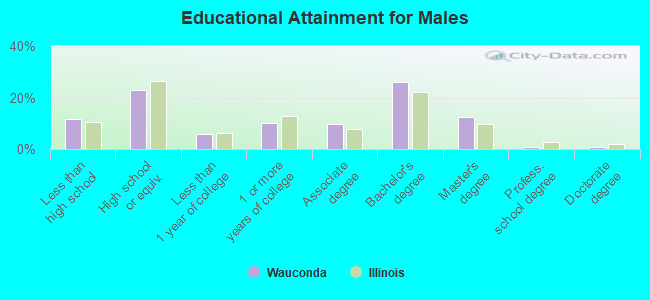
Education attainment for males 25 years and older:
- No schooling: 128
- Nursery to 4th grade: 0
- 5th and 6th grade: 9
- 7th and 8th grade: 200
- 9th grade: 0
- 10th grade: 20
- 11th grade: 5
- 12th grade, no diploma: 156
- High school graduate (or equivalency): 1,036
- Less than 1 year of college: 255
- Some college more than 1 year, no degree: 447
- Associate degree: 434
- Bachelor's degree: 1,164
- Master's degree: 563
- Professional school degree: 30
- Doctorate degree: 41
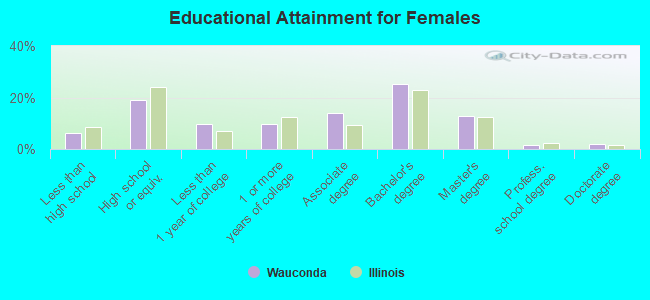
Education attainment for females 25 years and older:
- No schooling: 97
- Nursery to 4th grade: 22
- 5th and 6th grade: 21
- 7th and 8th grade: 26
- 9th grade: 19
- 10th grade: 54
- 11th grade: 0
- 12th grade, no diploma: 47
- High school graduate (or equivalency): 859
- Less than 1 year of college: 434
- Some college more than 1 year, no degree: 442
- Associate degree: 636
- Bachelor's degree: 1,146
- Master's degree: 582
- Professional school degree: 73
- Doctorate degree: 94
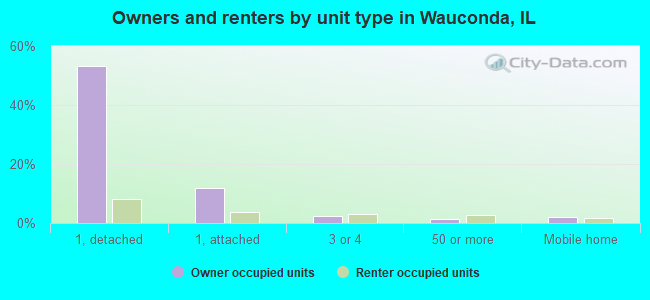
Housing units in structures:
- One, detached: 3,717
- One, attached: 488
- Two: 171
- 3 or 4: 226
- 5 to 9: 233
- 10 to 19: 39
- 20 to 49: 69
- 50 or more: 182
- Mobile homes: 226
Median worth of mobile homes: $26,074
Housing units lacking complete kitchen facilities in 2022: 1.3%
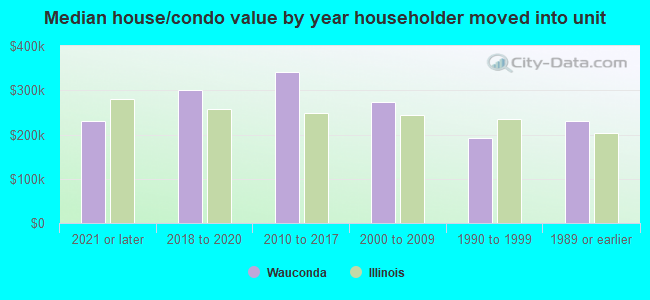
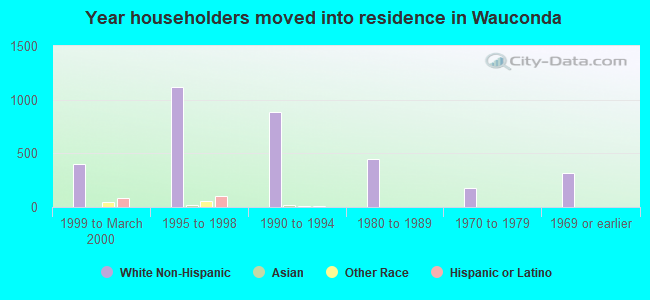
House/condo owner moved in on average 8 years ago
Renter moved in on average 7 years ago
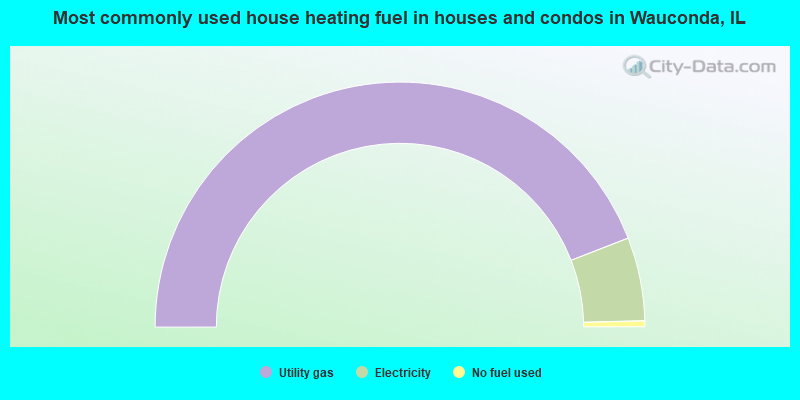
- 88.2%Utility gas
- 11.0%Electricity
- 0.8%No fuel used
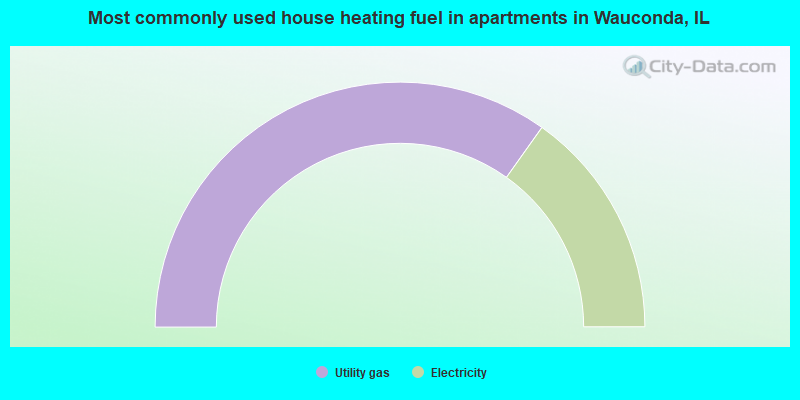
- 69.7%Utility gas
- 30.3%Electricity
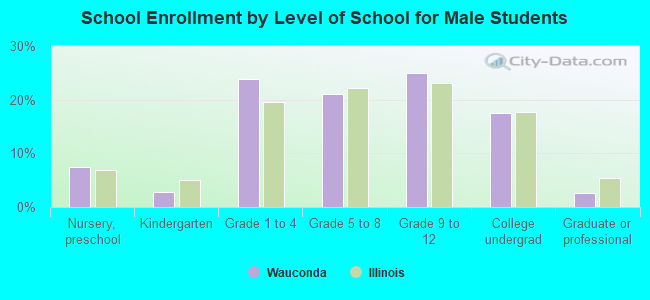
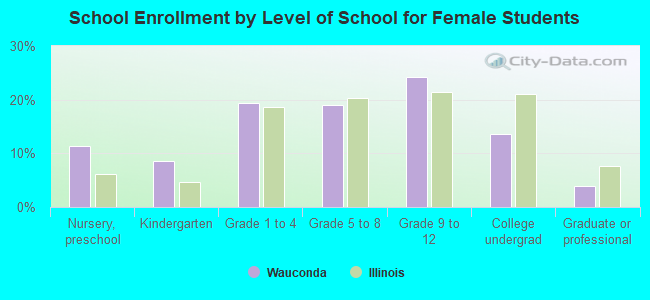
Private vs. public school enrollment:
| Here: | 2.5% |
| Illinois: | 13.3% |
| Here: | 7.6% |
| Illinois: | 9.9% |
| Here: | 15.3% |
| Illinois: | 27.4% |